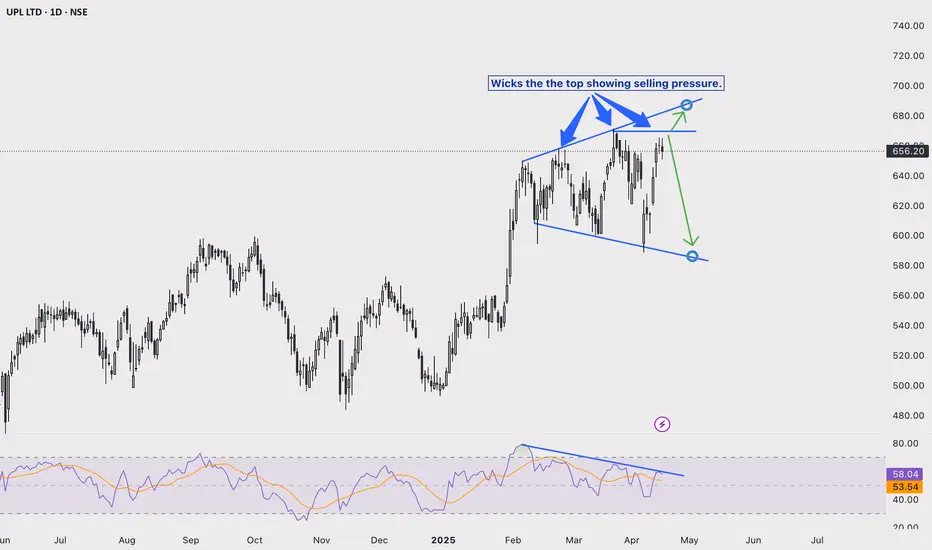
UPL Rising wedge analysis. Bullish trap possibleChart analysis:- UPL
Broadening wedge pattern
This pattern may look bullish, but it has hidden bearish signs:-
1. Buyers' exhausting action. Failing to make new highs and breaking out of the last highs.
2. RSI is showing divergence. Price rising, but RSI is falling.
3. Long wicks on top showing selling pressure.
In such a case, we can see a pullback to the lower side of the wedge.
On the other hand, if it breaks out of 670, it will test the upper side of the wedge at around the 680- 685sh zone.
Buy only if the price breakout is accompanied by a volume candle and RSI breaking the level of 65+
This chart is to analyse the possible trade setup on either side of the breakout of the wedge pattern.
Wedge
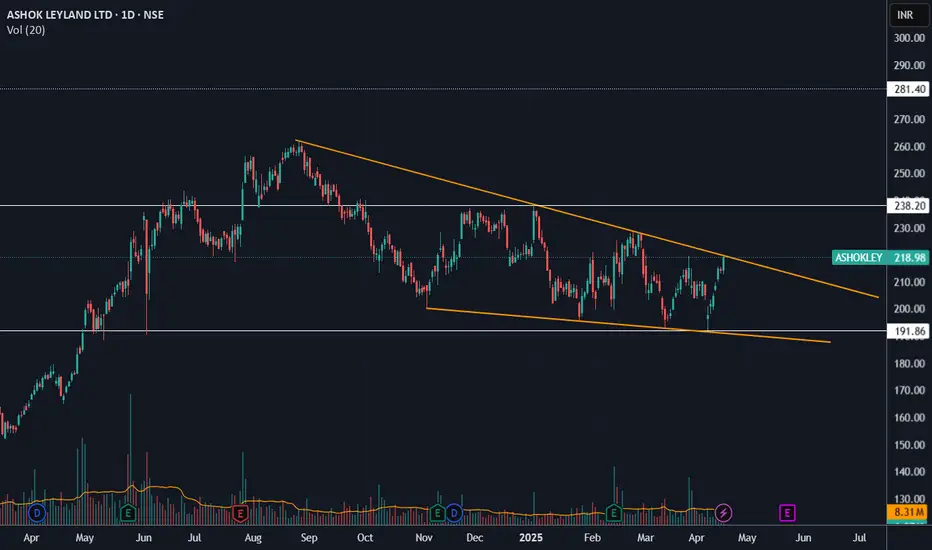
ASHOK LEYLAND perfect watchlist scriptFor the last nine months, Ashok Leyland has developed a falling wedge pattern. With the stock currently testing the upper trendline, a close above it would likely confirm a bullish breakout. It can reach 280 levels, as indicated by the pattern.
SHRIRAMFIN Swing Trade (14.6%)After forming a Head & Shoulder pattern, retail sellers got trapped and that becomes the liquidity for next up-move from the institutional demand zone. So the trend is up.
Recently good liquidity sweep happened which can fuel next up-move in short term.
With 1:3 Risk Reward and potential 14.6% up-move.
Only if Nifty holds current levels. ie it does not go below 22,700. Otherwise exit this trade.
Follow for more such setups, comment your thoughts.

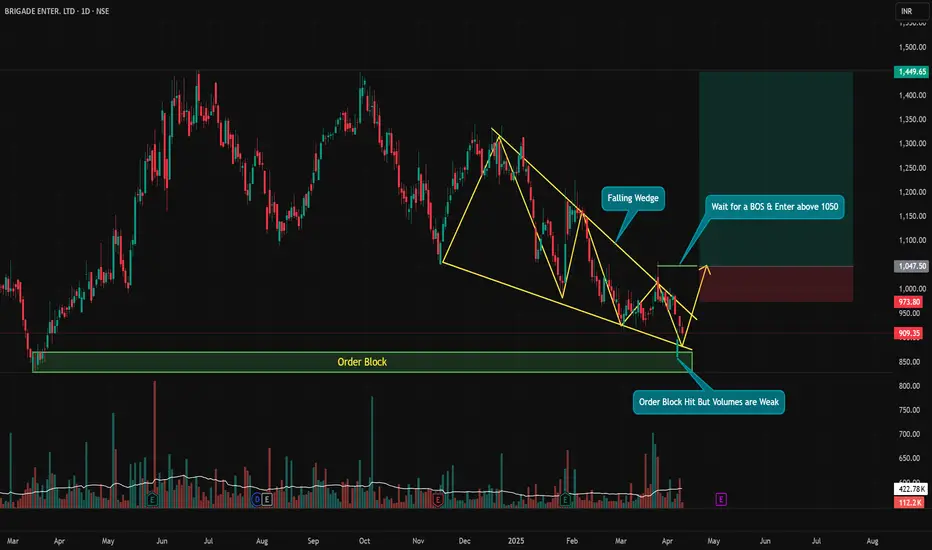
BRIGADE – Falling Wedge at Demand Zone, Waiting for BOSSetup Type: Reversal + Breakout Play | Conviction: Medium-High (Needs Confirmation)
Chart Framework: Smart Money + Classic TA
BRIGADE is showing signs of a potential trend reversal, but we’re not jumping in yet. Here's what the chart tells us:
🟡 Falling Wedge Formation – A bullish reversal pattern that typically resolves to the upside.
🟢 Tapped into a Strong Order Block – Smart money territory where previous accumulation took place.
🧲 Liquidity Grab Below Prior Lows, but... Volume on Bounce is Weak – Sign of caution.
📢 Analyst Rating: STRONG BUY – Adds institutional bias to the bullish setup.
🔐 No Confirmed Break of Structure Yet – Enter only after a clean breakout above ₹1050.
📈 Trade Plan:
Wait for a strong BOS (Break of Structure) and price closing above ₹1050 with volume.
Target zone near ₹1440+ aligns with measured move of wedge and previous supply.
⚠️ This is a setup with potential, but it’s not “ready” yet. Don't front-run smart money — let price confirm before jumping in. Risk management is a must.
Tata Consumer Prod. - Chart of the WeekNSE:TATACONSUM has a beautiful structure in the Weekly Timeframe that qualifies for my Chart of the Week idea. It saw Decent Volumes this week and closed above its recent swing high, with RSI and MACD Trending Upwards and Closing Above all Major Moving Averages.
About:
NSE:TATACONSUM is one of the leading companies of the Tata Group, with presence in the food and beverages business in India and internationally. It is the second-largest tea company globally and has significant market presence and leadership in many markets. In addition to South Asia (mainly India), it has presence in various other geographies including Canada, the UK, North America, Australia, Europe, the Middle East and Africa.
F&O Activity:
Significant Shorts are getting covered with 1050 PE OI Increasing Significantly.
Trade Setup:
It is Forming Like a Falling Wedge, it can test the upper edge and can give a good swing towards
1186-1190 Levels. So buy on Dips Until it closes below the Swing Low, ideally around the Marked Green Levels.
Target(Take Profit):
Around the Upper Edge of the Falling Wedge.
Stop Loss:
Swing Low Levels around 950-930.
📌Thank you for exploring my idea! I hope you found it valuable.
🙏FLLOW for more
👍BOOST if useful
✍️COMMENT below with your views.
Meanwhile, check out my other stock ideas on the right side until this trade is activated. I would love your feedback.
Disclaimer: "I am not SEBI REGISTERED RESEARCH ANALYST AND INVESTMENT ADVISER."
This analysis is intended solely for informational and educational purposes and should not be interpreted as financial advice. It is advisable to consult a qualified financial advisor or conduct thorough research before making investment decisions.

A Falling Wedge Pattern is Witnessed.Not a Good time To Buy as the major market is falling but a Falling Wedge Pattern is Witnessed, keep at watch might become a good choice to buy in the future.
BankIndia - ChannelNSE:BANKINDIA :
Moving in the channel, Expecting to break the channel, and close above 112
First target : 134-135
Second target : 150.
SL : 92.5 DCB
Time : 4 months

Rainbow Hospitals - Rising Wedge PatternRainbow Hospitals is making a Rising Wedge Pattern which is a bullish pattern and as per it we can expect Target of 2500+. Other factors:
1. One of the best Pediatric Hospital Chain in India.
2. Fundamentally strong stock with QnQ great results
3. Capacity expansion of 50%+ bed increase with state of art hospital in Gurgaon
4. Acquisition of hospitals in north east & Hyderabad
5. Technically a rising wedge pattern which is a bullish pattern
Based on fundamentals & technical analysis this stocks is looking great. Do keep in your radar!!
Keep following @Cleaneasycharts as we provide Right Stock at Right Time at Right Price!!
Cheers!!!

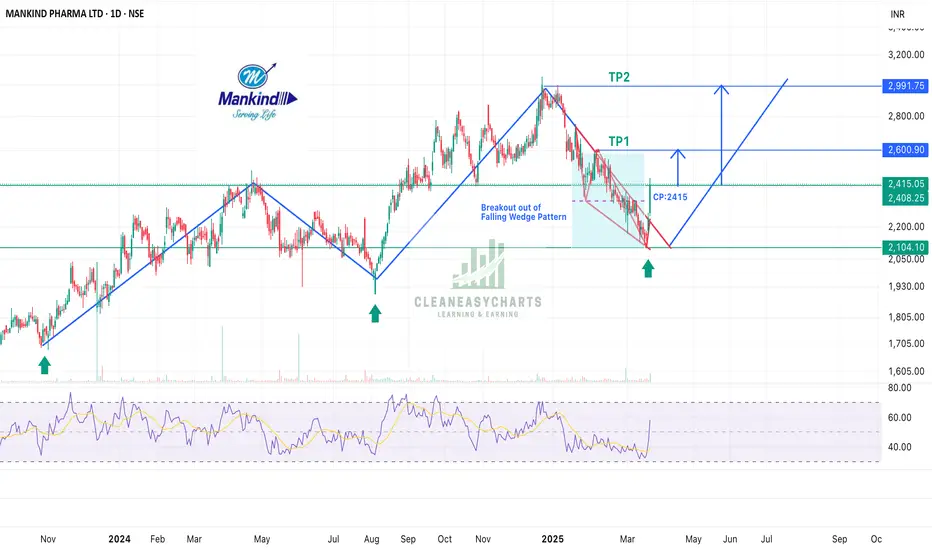
Mankind Pharma - Breakout out of Falling Wedge PatternMankind Pharma is one of the 4 largest Pharma from domestic market perspective. It has fallen 30% from peak price, but has recently given BO from fallen wedge pattern. This looks a great stock:
1. 4 brands are having top market share and growing
2. First Co. to make oral anti-obesity medicine
3. Acquisition of BSV has made a very strong hold in women healthcare
4. Best YoY results with rising EPS
Technically also, Pharma sector looking strong and especially top 5 Indian Pharma Industry companies which includes Mankind Pharma.
Keep this in your radar.
Keep following @Cleaneasycharts as we prvoide Right Stock at Right Time at Right Price!!
Cheers!!
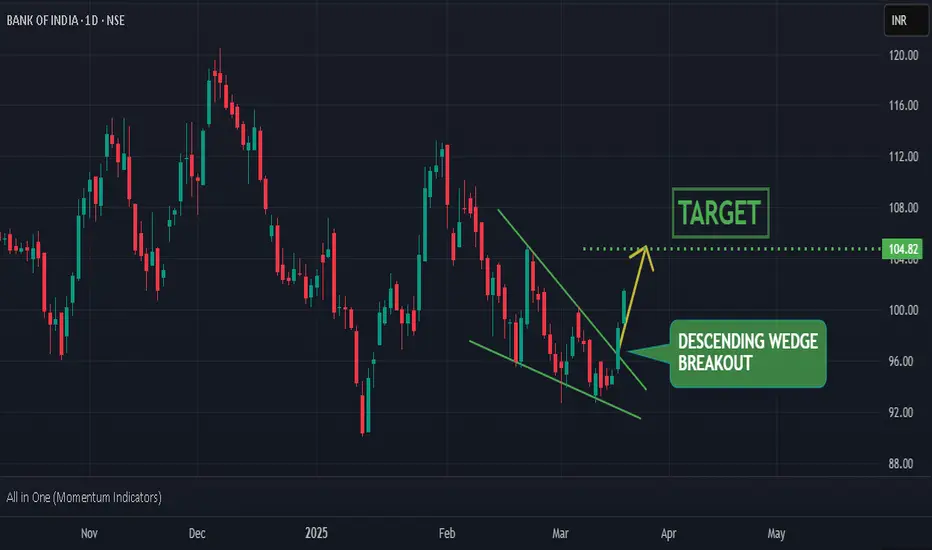
Bank of India : broken out of descending wedge pattern
DESCENDING WEDGE BREAKOUT -
the stock has recently broken out of a descending wedge pattern with strong green candlestick indicating strong upward momentum for the stock
REVERSAL FROM STRONG SUPPORT-RESISTANCE ZONE -
the stock has tested a very strong support-resistance zone several times and took reversal from it
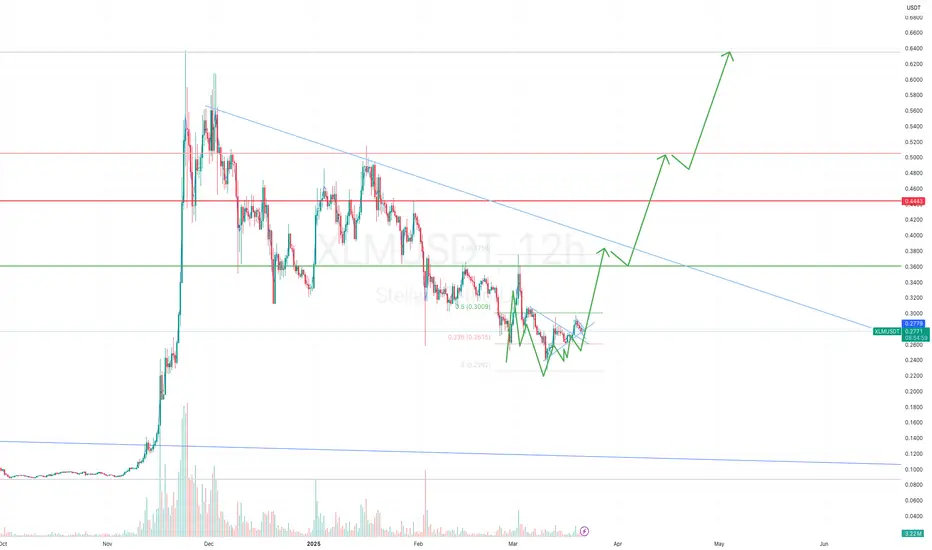
XLM super bullish pattern with base formationSolid price action formation in XLM token. 4h 12h daily TF looking super bullish with good base formation(accumulation). Breakouts must happens in smaller time frames to conquer the next levels. Target is like 50% 100% upside. Keep this coin in your watch list.
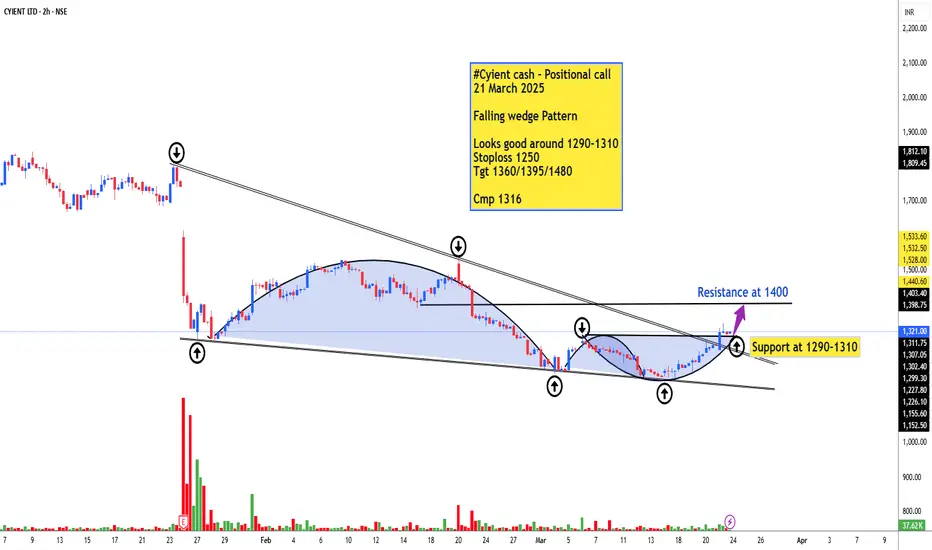
#Cyient cash - Falling wedge Pattern breakout#Cyient cash - Positional call
21 March 2025
Falling wedge Pattern
Looks good around 1290-1310
Stoploss 1250
Tgt 1360/1395/1480
Cmp 1316
USDJPY bearish signsUSDJPY might start the solid downtrend. Gradually falling down with falling wedge pattern breakdown. But dont get fooled and short immediately. It will give one healthy bounce too for the 0.23 fib levels as RSI also suggesting bit of oversold zone here, if it has to fall it will give one technical bounce. We have to observe it there closely if it rejects there or sustains above it. But as per my analysis slowly now trend is becoming bearish as per the weekly & daily chart analysis. As there is double top rejection is visible too in the chart.

TSLA Chart analysis -Daily Falling wedge BreakDown Target doneThis is a daily candlestick chart of Tesla Inc. (TSLA) with some technical analysis annotations. Here’s a breakdown of the key insights:
### **1. Price Action and Pattern:**
- The chart shows a descending triangle pattern that broke downwards.
- After breaking down from the triangle, the price dropped by **-113.47 points (-31.11%)** from the breakdown point.
---
### **2. Key Gap Zones:**
- ✅ **Gap 255 – 275 Range**
- Price recently filled or tested this gap zone.
- Currently consolidating near this range.
- ✅ **Gap 242 – 218 Range**
- If the price breaks below the current zone, the next key support is in this lower gap range.
---
### **3. Volume Profile:**
- High volume nodes are visible around **326–275**, suggesting strong historical trading activity (potential resistance).
- Current price near **262.67** shows declining volume, indicating possible indecision or lack of strong buying interest.
---
### **4. Support and Resistance Levels:**
- **Support:**
- Around **250.71** (previous low)
- Next major support at **209.84**
- **Resistance:**
- **273.35** (prior support turned resistance)
- **325.61 – 326.46** (volume profile resistance)
---
### **5. Volume Trend:**
- Volume has been elevated during the recent sell-off, indicating strong selling pressure.
- A reversal would need to see increased green volume and a hold above the 255–275 range.
---
### ✅ **Outlook:**
- If the price holds above **255**, a bounce toward **273–275** is possible.
- A break below **250** could trigger further downside toward the **242–218** range.
- Watch for volume confirmation and reaction near support/resistance zones for directional bias.
---

JUBLPHARMA Ready for an Up Move?Hello fellow traders, I hope you are all doing well.
Key Observations:
1. Strong Support Zone: JUBLPHARMA has reached a strong zone that previously acted as resistance and could now turn into support.
2. Chart Pattern: A falling wedge pattern is visible, which is typically a bullish reversal signal. We can also see that the breakout has already happened and now the price has come to retest.
3. Bullish Engulfing Candle: On the weekly time frame, we see buying pressure emerging, confirmed by a Bullish Engulfing candle.
4. Entry Point: A good entry could be above ₹1010 for better confirmation of the uptrend.
5. Targets: The potential targets are already marked on the chart as T1, T2, and T3 .
As this is my first published idea, I kindly ask you to ignore any mistakes, and I will strive to improve in the future.
Disclaimer:
This is purely an analysis and not investment advice. Please trade with due diligence and manage your risks carefully.
I hope you like my work, Thanks in advance.
Best regards - Anantesh

The Falling Wedge Pattern: A Guide to Catching Bullish BreakoutsFalling Wedge Pattern: A Continuation Chart Pattern
Hello Traders!
In today's post, we’ll explore the Falling Wedge Pattern , one of the most reliable continuation patterns that traders look for during uptrends. It’s an important tool for identifying potential breakout points in trending markets. If you want to learn how to trade these breakouts effectively, mastering the Falling Wedge is essential.
The Falling Wedge pattern typically forms during an uptrend and consists of converging trendlines, where the price makes lower highs and lower lows. However, despite the price being pushed lower, the momentum starts weakening, and eventually, the price breaks above the upper trendline, signaling a continuation of the prevailing uptrend .
What is the Falling Wedge Pattern?
The Falling Wedge Pattern is characterized by two converging trendlines, where the upper trendline slopes downward more steeply than the lower trendline. This pattern shows a decreasing range between highs and lows, and when the price breaks above the upper trendline, it indicates a continuation of the uptrend .
Key Characteristics of the Falling Wedge Pattern
Uptrend Prior to the Pattern: The Falling Wedge pattern forms during a strong uptrend , signaling that the market is taking a brief pause before resuming the previous momentum.
Converging Trendlines: The pattern consists of two downward-sloping trendlines that converge, with the upper trendline steeper than the lower one. This shows that the selling pressure is weakening.
Breakout Confirmation: A bullish breakout occurs when the price breaks above the upper trendline, signaling the continuation of the uptrend .
Volume Increase on Breakout: The breakout is confirmed when there is an increase in volume, indicating strong momentum behind the move.
How to Trade the Falling Wedge Pattern?
Entry Point: The ideal entry point is when the price breaks above the upper trendline, confirming the bullish breakout .
Stop Loss: Place your stop loss just below the lower trendline or the most recent swing low to protect your trade from sudden market reversals.
Profit Target: Measure the height of the wedge and project that distance upward from the breakout point to determine the price target .
Risk Management Considerations
Position Sizing: Adjust your position size based on your risk tolerance and the distance between the entry point and the stop loss.
Stop Loss Placement: Make sure to place your stop loss in a way that minimizes risk but still gives enough room for the trade to move in your favor.
Wait for Confirmation: Always wait for the breakout confirmation, and make sure that the price action is supported by an increase in volume.
What This Means for Traders
The Falling Wedge pattern is an excellent tool for traders who are looking for reliable continuation trades in strong uptrends. It can help identify breakout points and offer favorable risk-to-reward setups when combined with other technical indicators.
Look for the Falling Wedge pattern during uptrends to identify high-probability continuation trades.
Confirm with volume to ensure the breakout is backed by strong momentum.
Use stop loss placement to manage risk effectively while targeting favorable risk-to-reward ratios.
Conclusion
The Falling Wedge pattern is a reliable continuation pattern that can help traders identify breakout opportunities in trending markets. By mastering its formation, waiting for the breakout confirmation, and managing risk effectively, you can increase the chances of a successful trade in the uptrend .
Have you traded the Falling Wedge pattern before?
Share your experiences and thoughts in the comments below! Let’s continue learning and growing as traders!

Nifty!Nifty Simple Explanation
Falling Wedge Formation: The chart shows a falling wedge pattern, which often signals a potential bullish reversal if the price breaks above the upper trendline.
Order Block (₹24,500–₹25,000): This zone represents strong supply or resistance. If the stock rallies, it may face selling pressure here, but reaching this area could mean a gain of about 28–30% from current levels.
Breakout vs Breakdown:
Breakout above the wedge indicates renewed buying interest and could drive the price into the order block.
Breakdown below the wedge suggests the downtrend remains in control.
Overall, watch for a wedge breakout for a bullish move, but be cautious of strong resistance in the ₹24,500–₹25,000 range.

Nifty in.tradingview.com
Nifty on a Descending triangle from the last few months, more healthy correction is highly anticipated.

NIFTY: At a Crucial Junction After a 13% Correction Topic Statement:
NIFTY has corrected 13% from its highs of 26,277 and is now trading within a converging pattern, where a breakout will determine the market’s next major move.
Key points:
1. The price is taking support on the long-term up trendline.
2. The price faces resistance as it approaches the short-term down trendline.
3. The two trendlines form a wedge, and a breakout from this pattern will decide the market’s direction.

SHAHALLOYS: Signs of Reversal?Hello fellow traders,
I hope everyone is doing well.
Please find my analysis for SHAHALLOYS below:
Key Observations:
1. Reversal from Support Zone: SHAHALLOYS appears to be reversing from a key support area.
2. 200 Weekly EMA Support: The price seems to be holding around the 200 Weekly EMA, indicating potential strength.
3. Chart Pattern: A falling wedge pattern is visible, which is typically a bullish reversal signal. The breakout and subsequent retest have already occurred.
4. Entry Point: A good entry opportunity could be around current levels of ₹69.19 level.
5. Targets: The potential targets are marked on the chart as T1, T2, and T3.
6. Risk-to-Reward Ratio: The trade offers an attractive R:R of 1:3.
Disclaimer:
This is purely an analysis and not investment advice. Please trade responsibly, conduct your own research, and manage your risks carefully.
I hope you find this analysis helpful. Thank you in advance for your support! 😊
Best regards,
Anantesh

NIFTY 50 I Falling Wedge Pattern + Bulllish Divergence Nifty 50 Index is currently trading within a very important zone in simple words called area of interest Usually consisting of demand or supply zone. This level has acted as a solid base for the index.
The NIFTY 50 index presents a promising opportunity to initiate long positions at these levels (CMP23,000), Aligning well with the risk reward ratio and making it a favourable entry point for traders looking for Taking advantage of the upcoming trend.
The index has shown a pattern of forming lower highs and lower lows, which indicates a downtrend. However, the Relative Strength Index (RSI) is showing a contrasting pattern of higher highs and higher lows. This divergence between price action and RSI suggests a potential shift in momentum and a possibility of a short covering rally.
Adding to this I see a falling wedge pattern which is a bullish signal suggesting an upward price movement which typically appears in a downtrend and often seen as a bullish Reversal pattern.
The analysis holds true when price close above 23,824 - daily timeframe.
While entering on current levels also has good opportunity of risk reward ratio, I suggest looking for a pin bar candle on today's close will Confirm Market picking support from the levels .
Conversely if nifty 50 index continues to recover, We could see a push towards 24,200 and 24,800 Which represent key Resistance areas. A good breakout above these levels likely signal Continuation of bullish trends in the indian markets.

OMUSDT(mantra) strong upmove on chartsOMUSDT from the current levels very bullish. Targets wont come in one day but it will come. Follow the post. will keep posting the small small but good target trades based on daily price action. This is long long term view. Same kind of prediction i have done for XRP too and look at it 10 times move from there. Mantra OM is fundamentally strong coin too so dont ignore this view. Expecting atleast 200% return from here in this coin.

ENAUSDT big target visible.ENA has very big target visible on the chart. very good accumulation zone. Keep adding in the trades. It can even blast upto 5 too.
