Weekly analysis of XAUUS/Gold with buy and sell scenarios...Gold has reached to Level 2 as we analysed few weeks back.
Gold has created a strong weekly momentum candle showing positive sentiment. But there is divergence with volume. Candle is strongest amongst last four weekly candles while volume is lowest. On daily time frame there are consecutive 5 buy candles. RSI is also over 80 and oversold All these brings a caution
So, price may take a pause or pull back to adjust pricing. Now we need to be cautious and plan for rangebound pull back.
1. Price has created higher highs in lower time frames and created micro structures.
2. Now price may pull back with some delivery change in lower time frames.
3. Still, we should be positive till delivery changes at 4H/1H TF.
4. Most probably price will take liquidity of FVG/RDRB level and create MSS/CISD/TS/iFVG in LTF.
5. Price should show rejection/reversal in respective LTF (4H/1h/15m) at FVG zone.
6. Take the trade only once clear entry model i.e. turtle soup. iFVG break, CDS or MSS happens on LTF
All these combinations are signalling a high probability and high RnR trade scenario.
Note – if you liked this analysis, please boost the idea so that other can also get benefit of it.
Also follow me for notification for incoming ideas.
Also Feel free to comment if you have any input to share.
Disclaimer: This analysis is for educational purposes only and does not constitute investment advice. Please do your own research (DYOR) and check with your financial advisor before making any trading decisions.
Weeklymarketsanalysis

Weekly Analysis of BTC - Detailed Another week and price still moved as expected in same range. No major view change since last prediction for long term trades.
Further short-term view.
Week is closed bearish and may target recent draw on liquidities of ~84K. Price may move in choppy mode for some time. So, the best idea is to look for small trade rather than long swing trades.
As the market in rangebound/Choppy, so we should keep eye on both side Opps but focus on down side as next high-level draw on liquidity is at downside.
Refer previous details below for larger perspective…
We analysed three weeks back that BTC would be in range for some time before taking any further move, And BTC is following same analysis and trapped within a small range since then. BTC prediction of last week also worked perfectly well and market kept in consolidation mode itself. BTC is still in consolidation zone and may spend some more days. It may develop ABC pattern or reversal at identified daily FVG level, if price has to change its delivery and take turn from here. This zone is kind of make or break. If price is not able to sustain and breakdown, then it may witness ~65-70K levels as well.
We hope for reversal from this level as price is developing the pattern at higher time frame.
1. Price has taken liquidity or 82K and almost touched 80K.
2. It has inversed 1Day FVG and now price is consolidating in the range between EMAs.
3. We may expect price retracement till 1D iFVG and then reversal.
4. Before to that we may see sweep of 92900 (1D CISD) level and then a retracement short trade till 1D FVG
5. Most probably price will take liquidity of FVG/RDRB level and create MSS/CISD/TS/iFVG in LTF.
6. Price should show rejection/reversal in respective LTF (5m/15m) at FVG zone.
7. Take the trade only once clear entry model i.e. turtle soup. iFVG break, CDS or MSS happens on LTF
All these combinations are signalling a high probability trade scenario.
Note – if you liked this analysis, please boost the idea so that other can also get benefit of it.
Also follow me for notification for incoming ideas.
Also Feel free to comment if you have any input to share.
Disclaimer: This analysis is for educational purposes only and does not constitute investment advice. Please do your own research (DYOR) and check with your financial advisor before making any trading decisions.

Nifty weekly analysis - Detailed Last week Nifty had strong downfall of ~3% because of various factors including global events and selling of FIIs. Week closed with a strong bearish candle with heavy volume showing further downside pressure targeting near draw on liquidity of ~24600. This level has highest volume, which will act as magnet for price.
Order flow is also downside creating lower highs.
Currently price is inside weekly price imbalance zone and at a psychological number of 25000. So, we can expect a pause at this level for few days. So next week may go in range bound mode to bearish.
Over all sentiments are bearish until there is a big positive change appears in global politics.
Critical points ……………….
• Support zone: 24,580–25,050
• Resistance zone: 25,550–25,600
• Bias: Range-bound to mildly bearish for the coming week.
1. If breakout support with volume we may see 24600 levels soon.
Note – if you liked this analysis, please boost the idea so that other can also get benefit of it.
Also follow me for notification for incoming ideas.
Also Feel free to comment if you have any input to share.
Disclaimer: This analysis is for educational purposes only and does not constitute investment advice. Please do your own research (DYOR) and check with your financial advisor before making any trading decisions.

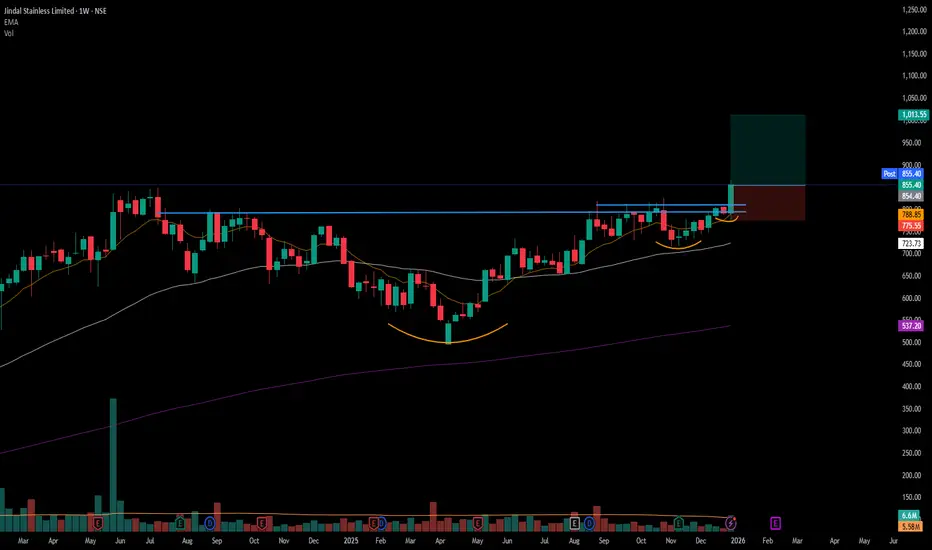
#JSL - VCP BO in WTFScript: JSL
⚡Key highlights: 💡
📈 VCP BO in WTF
📈 Volume spike seen during Breakout
📈 MACD Bounce
📈 RS Line making 52WH
📈 Sector is strong
If you have any doubts about the setup, drop a comment and I’ll reply.
✅Boost and follow to never miss a new idea! ✅
⚠️ Important: Always Exit the trade before any Event.
⚠️ Important: Always maintain your Risk:Reward Ratio as 1:2, with this RR, you only need a 33% win rate to Breakeven.
⚠️Disclaimer: I am not SEBI Registered Advisor. My posts are purely for training and educational purposes.
Eat🍜 Sleep😴 TradingView📈 Repeat 🔁
USDJPY – Weekly Triangle Near a Big Decision !!The pair has been stuck inside a large weekly triangle formation, compressing price action after years of volatility. These types of structures usually lead to powerful breakouts, and the direction will depend on how the BoJ policy stance and the Fed’s rate cut cycle unfold.
Chart validation:
Price is coiling between lower highs and higher lows the classic look of a triangle consolidation.
Resistance sits around 162, with the upper bound of the triangle capping rallies.
Support near 137–138 has been holding the downside so far.
The breakout path points to two extremes:
Upside projection: A clean break could open a run towards 175–176.
Downside projection: A bearish resolution could drag it back to 127, the lower long-term support.
Key takeaway:
For now, USDJPY is neutral but building energy.
The next decisive move will be sparked by central bank divergence if the Fed cuts faster than the BoJ tightens, the yen could strengthen and break lower; if the BoJ holds back and the Fed stays cautious, the pair could rip higher.
We should wait for confirmation outside this triangle before positioning for the next trend. Trade safe !

GOLD@ 3890 : Bubble Peak or Just a Pit-Stop?Pullback vs. Correction The 100th-Idea Deep Dive !!
Gold has moved almost 88% in the last two years to new records. The main drivers are falling real yield expectations with an easing bias, persistent geopolitical risk, record central bank buying and the 2025 rebound in ETF demand.
Geopolitics is shifting as Washington pushes for a Gaza ceasefire. Headlines talk about partial acceptance and ultimatums but nothing is done yet. The war premium can fade step by step though headline shocks will still remain.
Key levels:-
Resistance 3890–4000
Pullback zone 3640–3650 (5%)
Correction zone 3475–3480 (11%)
Weekly RSI stretched into high 70s and 80s → risk of mean reversion before any bigger change.
Macro gears:-
Real yields and the dollar:-
Lower real yields = higher gold. That is the key lever. As rate cuts and softer real rates were priced into 2025, gold repriced hard.
Central bank sponsorship:-
Official demand has been consistent three years in a row. 2022 at 1082t, 2023 at 1037t, 2024 at 1045t. This is rare in modern data and explains why dips are shallow.
ETF flows:-
After outflows in 2024, 2025 turned. Three straight months of inflows into August, strongest since 2020, YTD around 588t. Pure fuel ✨
Geopolitics & the premium:-
From 2023 to 2025 Middle East risk kept term premia elevated. Now Gaza peace talks open a path for that premium to fade. But timelines and enforcement are unclear. Strikes still came even with peace headlines. Means the bleed can be gradual but headline spikes remain..
Pullback or true correction:-
3890–4000 is the confluence zone. Psychological milestone + vertical extension after 88% impulse. Bubble behavior meets supply.
Level 1 at 3640 → about -5% pullback. If bids hold, trend resumes.
Level 2 at 3470→ -10 to -12% wash into prior shelf. Would be first real reset in two years.
Weekly momentum overbought. Phases like this don’t end instantly but forward returns improve after reset.
Flows @ CBs rarely chase tops, they buy weakness across months. That softens drawdowns.
ETFs are flighty. Peace plus firmer yields can stall inflows. Any Fed pivot or growth wobble can flip them back fast.
Possible future paths :-
Continuation bubble :- Break 3900 → 4050–4200
Triggers dovish Fed, softer yields, failed peace, ETF flows
Tactic = only add above 3900 on daily/weekly close. No chasing wicks.
Shallow pullback :-Tag 3630–3660 then rotate
Triggers peace holds, modestly firm yields, demand returns
Tactic = scale in near 3640–3650 if H4 shows higher low + reclaim POC. First TP 3780–3820.
True correction :- flush 3520–3460
Triggers Gaza settlement + real yields higher + ETF stall
Tactic = let it wash. Look for capitulation + basing 3480–3460. Best R:R after failed bounce and reclaim.
Levels & invalidation:-
Bull continuation pivot 3890–3900. Opens 4050–4200.
Pullback buy zone 3630(Hvz)–3650 with confirmation. Invalidation H4 <3600.
Correction buy zone 3480 ±20 after basing. Invalidation weekly <3420 → opens 3300–3350.
If flat → stagger entries and size carefully.
If long from lower → trail under last daily HL, book partial 3880–3950.
Surprise risk (Imp) ETF squeeze higher – inflows still not at 2020 peak → late cycle melt-up possible.
Policy shock – faster cuts or fiscal noise sink yields = blow-off. Strong data → pop in yields = sharp air pocket.
Geopolitical whipsaw – peace unravels → $50–100 spike in thin tape!!
Bottom line:-
This is a two year vertical impulse meeting macro reality at 3890.
Level 1 = 3640–3650 pullback line.
Level 2 = 3480 correction line.
Until weekly breaks, dips are still opportunities not obituaries. But only with structure. No blind catching this high up.
Bubbles don’t end quietly – great trends reset then go again ✨
Fade euphoria into 39xx if momentum stalls. Buy fear into 348x if the market finally delivers the reset it owes.
Trade safe ⚡
Sparkrlight ♾️✨⚡

BTCUSD Weekly – Supply Pressure vs Key Support (110K in Focus)On the weekly timeframe, BTC is trapped between major supply (117K–119K) and key support (110K–112K).
Supply Zone: Price has faced multiple rejections near 117K–119K, showing strong seller presence.
Order Block/Resistance: The yellow zone around 113K is acting as an active selling area, preventing BTC from reclaiming higher ground.
Support Zone: BTC is currently testing the 110K–112K support zone. If this level holds, we could see another attempt to reclaim 113K.
Scenarios:
1. Bullish Breakout (less likely unless strong volume appears):
Needs to reclaim 113K and break above 119K.
Target zone → 126K–134K.
Stop loss for longs → below 110K.
2. Bearish Breakdown (higher probability if 110K fails):
If 111K–110K zone breaks, BTC likely retests the 103K–106K demand zone.
If that fails → extended move possible toward 97K.
Stop loss for shorts → above 113.5K.
Bias: Neutral to Bearish unless BTC reclaims 113K with strong volume.

Nifty upcoming moveWe have clean equal lows at 24462 and OB below that, weekly. Market should heavily expand towards that and take it first before giving any real upside move that would sustain. until then, any move upside is only correction phase.
your views are welcome.

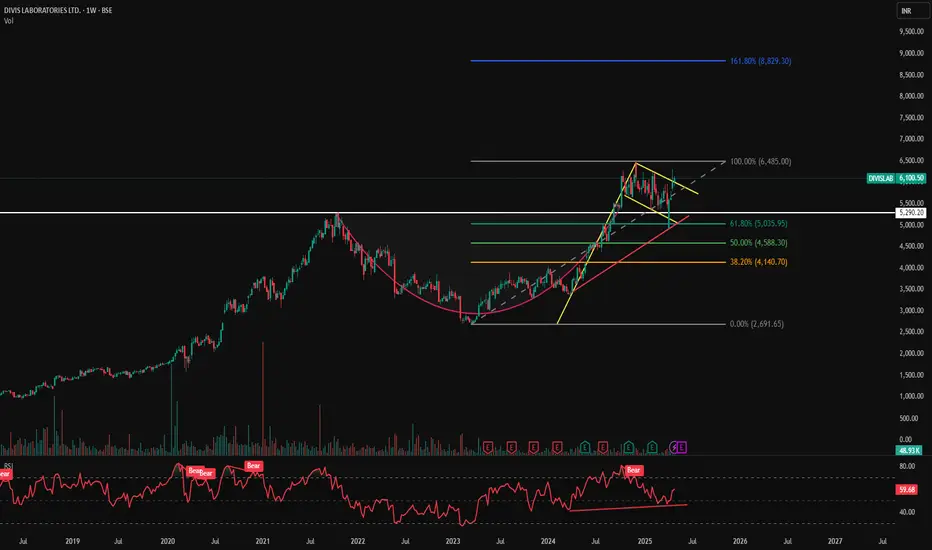
DIVISLAB - Cup Pattern Breakout with Bullish Flag Consolidation📊 DIVISLAB – Cup Pattern Breakout with Bullish Flag Consolidation
🕰️ Timeframe: 1W | 🔍 Pattern: Cup Formation + Bullish Flag | 🚀 Long-Term Breakout Potential
📈 Technical Breakdown:
DIVISLAB has formed a massive Cup pattern on the weekly timeframe and is currently consolidating inside a Bullish Flag after hitting the neckline breakout. This is a classic continuation setup following a long accumulation.
Post breakout, the price tested the upper region and is now preparing for a potential next leg toward Fibonacci extension levels.
🔑 Key Support & Resistance Levels:
🔵 Resistance / Upside Targets:
₹6,485.00 (Cup breakout top)
₹8,829.30 (Fib extension 161.8%) 🟦
🔴 Support Zones:
₹5,290.20 – Local horizontal support
₹5,035.95 – Fib 61.8% retracement (strong support)
₹4,588.30 – Fib 50%
₹4,140.70 – Fib 38.2%
₹2,691.65 – Long-term base (0% Fib)
🧭 Strategic View:
🟢 Bias: Bullish
🔁 Retest Zone: ₹5,290–₹5,035 can be re-entry zones
🎯 Target Zones: ₹6,485 followed by ₹8,829 for positional long
🛑 Invalidation: Below ₹5,000 zone
⚠️ Disclaimer: This is an educational chart setup and not trading advice. Please conduct your own research and risk management.
📣 Follow @PriceAction_Pulse for more such clean breakouts and chart pattern analysis!
🔁 Drop a comment if DIVISLAB is on your radar for the next breakout rally 📈
Euro Weekly SetupEURUSD weekly setup suggesting major short.
charts shows some rally on long expected just to enter short from level 1.05900 for target 1.03350

NHPC 1D T FNSE:NHPC is near a demand zone which has multiple touch points making it stronger. This can be traded either up or down. We can wait for confirmations from the price and then we can get into the trade
Disclaimer:- This analysis is only for educational purpose. Please always do your own analysis or consult with your financial advisor before taking any kind of trades

JIOFIN 1D TFNSE:JIOFIN , In the previous post discussed the stock broke a demand zone with strong bearish candle, but is now forming a stong bullish candle.This could be possible liquidity grab. This is a risky entry but could be traded for a 1:1.5 R:R.
We have discussed this more on our previous post. You can view the previous post by clicking the attachment below this post.
Disclaimer:- This analysis is only for educational purpose. Please always do your own analysis or consult with your financial advisor before taking any kind of trades

NTPC 1D TFNSE:NTPC has broken a trend line which I have posted in previous post. The stock could be have been traded in two ways.
Trade 1:
Entering the market as soon as the stock broke the trend line.
The stock has reached 1:1.5 and is running in profit.
Trade 2:
Waiting for another bearish candle or a retracement. The stock formed another bearish candle and If I have traded below that the stock is running in profit and I am waiting for the market to achieve a 1.5 reward.
We have discussed this more on our previous post. You can view the previous post by clicking the attachment below this post.
Disclaimer:- This analysis is only for educational purpose. Please always do your own analysis or consult with your financial advisor before taking any kind of trades

JIOFIN 1D TFAs we discussed in the previous posts NSE:JIOFIN has broken down a strong demand zone. A trade can be taken here with good profits.
We have discussed this more on our previous post. You can view the previous post by clicking the attachment below this post.
Disclaimer:- This analysis is only for educational purpose. Please always do your own analysis or consult with your financial advisor before taking any kind of trades

GAIL 1D TFNSE:GAIL has retraced from a demand zone and has gained liquidity and is coming down again. We could take entry with a R;R of 1:1.5. And the possibility of this trade winning is more as there are many confirmations associated with this one.
Disclaimer:- This analysis is only for educational purpose. Please always do your own analysis or consult with your financial advisor before taking any kind of trades

TATASTEEL 1D TFAs discussed in the previous post NSE:TATASTEEL was moving around a trend line which it has broke down now. The stock could be traded with strong confirmations only.
We have discussed this more on our previous post. You can view the previous post by clicking the attachment below this post.
Disclaimer:- This analysis is only for educational purpose. Please always do your own analysis or consult with your financial advisor before taking any kind of trades

TATAPOWER 1D TFNSE:TATAPOWER broke a trend line and is moving around a demand zone. The market need strength to break this demand zone hence waiting for the entry is good. If the market breaks the demand zone with a good candle or if a retracement occurs the entry could be taken.
We have discussed this more on our previous post. You can view the previous post by clicking the attachment below this post.
Disclaimer:- This analysis is only for educational purpose. Please always do your own analysis or consult with your financial advisor before taking any kind of trades

VEDANTA 1D TFNSE:VEDL has broken down a trend line pattern with a good bearish candle. The trade could be taken with a good risk and reward.
Disclaimer:- This analysis is only for educational purpose. Please always do your own analysis or consult with your financial advisor before taking any kind of trades

PFC 1D TFWe've spoke about NSE:PFC forming a triangular pattern in the previous post. Now the stock is moving up breaking the triangular pattern. But I would wait for a retracement or another strong bullish candle in order to enter this trade.
We have discussed this more on our previous post. You can view the previous post by clicking the attachment below this post.
Disclaimer:- This analysis is only for educational purpose. Please always do your own analysis or consult with your financial advisor before taking any kind of trades

POWERGRID 1D TFIn the previous post, I've posted that NSE:POWERGRID is in a demand zone and will retrace. But the market hit stoploss in that trade. Now we can clearly see that NSE:POWERGRID has gained liquidity and moving up. Though a strong bullish candle can be seen. This is a risky entry. Hence be cautious and look for confirmations before entering the trade.
We have discussed this more on our previous post. You can view the previous post by clicking the attachment below this post.
Disclaimer:- This analysis is only for educational purpose. Please always do your own analysis or consult with your financial advisor before taking any kind of trades

NTPC 1D TFAs discussed in the previous post, NSE:NTPC has broke down a trend line and is moving down. But i would wait for multiple confirmations (a retracement for example) in order to enter this stock. As the trendline is not too strong, waiting for a strong confirmation is good before entering the trade
We have discussed this more on our previous post. You can view the previous post by clicking the attachment below this post.
Disclaimer:- This analysis is only for educational purpose. Please always do your own analysis or consult with your financial advisor before taking any kind of trades

BEL 1D TFAs we discussed in the previous post, NSE:BEL is trading in parallel zone pattern and can break out at any moment.As nifty is also moving up from an support zone I hope the chart will move on the upside. With proper confirmations this trade could be taken with a good R:R.
The link to the previous post is attached below..
Disclaimer:- This analysis is only for educational purpose. Please always do your own analysis or consult with your financial advisor before taking any kind of trades

PowerGrid-1D TimeframeNSE:POWERGRID is in a uptrend in 1 month timeframe. While coming to lower timeframe, it is clear that the chart has touched the support zone for three times and hence we could go for a long position. There are two partial profits too in this analysis.As the higher timeframe chart is in uptrend, having a long position is advicable.
Disclaimer:- This analysis is only for educational purpose. Please always do your own analysis or consult with your financial advisor before taking any kind of trades
NSE:POWERGRID
