WIPRO : ALGO BUY SIGNALHOW TO FOLLOW ALGO SIGNAL:
Deciding buy/sell
1.Strictly use only on 1 hour time frame.
2.Wait for a ‘X’ sign before mind make up. A red ‘X’ means look for selling opportunity , a green ‘X’ means look for buying opportunity.
Taking a position:
3.Wait for an arrow before entering into any position. A red arrow on upside of a bar pointing downward means open short position. A green arrow below the bar pointing upward means open buy position.
4.NOTE: Only after the the signalling of X , look for arrow. Do not buy/sell if you see any arrow before the signal of X.
5.STOP LOSS should be the most recent swing high/low or most recent STRONG CANDLE’S high/low.
While maintaining the position :
6.The small triangles after the each bar completion tells you to hold the position. The red triangles appearing upside on the bar tells you to hold the short position, whereas the green triangles appearing below the bars tells you to hold the long position.
Exiting the position:
7.After you create a buy position , if you see a green arrow above any bar pointing downward, then you should either book partially/leave the position for sometime. You will get another signal to re-enter.
8.Similarly, after you create a sell position , if you see a red arrow below any bar pointing upward, then you should either book partially/leave the position for sometime. You will get another signal to re-enter.
9.While being in position if you see any X signal which is opposite of your trade , then leave your position immediately.
10.When you see a big red circle dot then you must exit all your short positions. Contrary , when you see a big green circle dot , you must exit all your long positions. And then wait for a X-signal.
No Trading Zone:
11.When you get frequent X-signals in green-red-green-red & that too very close, then its means that stock is going to form a range. One should wait for the range break & move away to another stock. (THIS IS WHERE YOU WILL REQUIRE A PRACTICE TO IDENTIFY THE RANGE)
Wipro


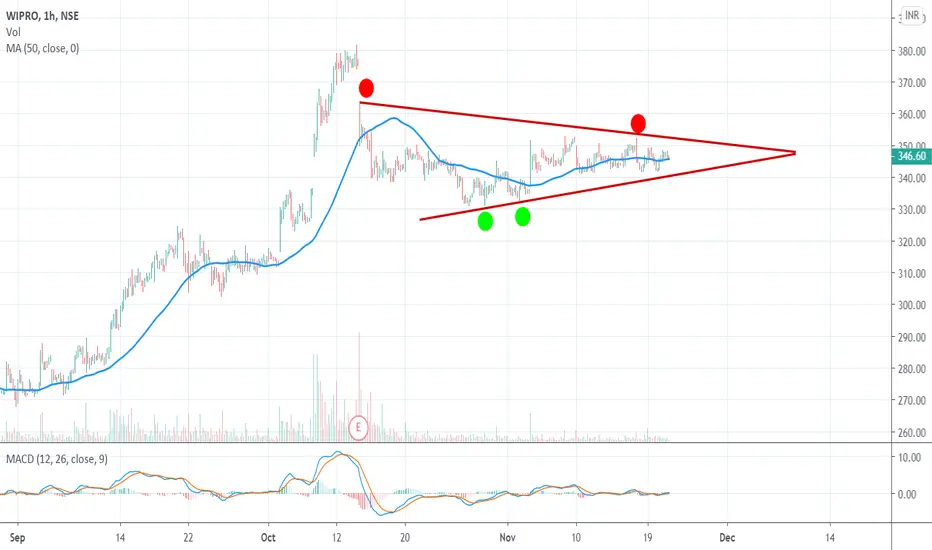


WIPRO can give breakout from 1hr time frame SM triangleWIPRO can give breakout from 1hr time frame SM triangle

Wipro Long#Wipro #Bullish #Reteststructure #buy #deeppocket #long
Wipro Buy @350.70
SL 342.40
Tgt 363-375

Intraday / Swing Setup: Looks good for 360/380Intraday / Swing Setup: Looks good for 360/380. Enter between 348-349 with SL of 344 for Intraday and 341 for Swing. Wait for confirmation on 15 mins chart.
Note: I am not a SEBI register and view is only for educational purpose as well as personal, always consult your financial advisor before investing or trading.


RELIANCE KEY LEVELS SUPPORT AND RESISTANCE 03/11/2020 INTRADAYRELIANCE KEY LEVELS SUPPORT AND RESISTANCE FOR INTRADAY 03/11/2020
TRADE WITH STRICT STOP-LOSS AND FOLLOW RISK MANAGEMENT

NIFTY KEY LEVELS SUPPORT AND RESISTANCE INTRADAY 03/11/2020 STOCK KEY LEVELS SUPPORT AND RESISTANCE FOR INTRADAY 03/11/2020
TRADE WITH STRICT STOPLOSS AND FOLLOW RISK MANAGEMENT

BANKNIFTY KEY LEVELS SUPPORT AND RESISTANCE 03/11/2020 INTRADAYSTOCK KEY LEVELS SUPPORT AND RESISTANCE FOR INTRADAY 03/11/2020
TRADE WITH STRICT STOPLOSS AND FOLLOW RISK MANAGEMENT

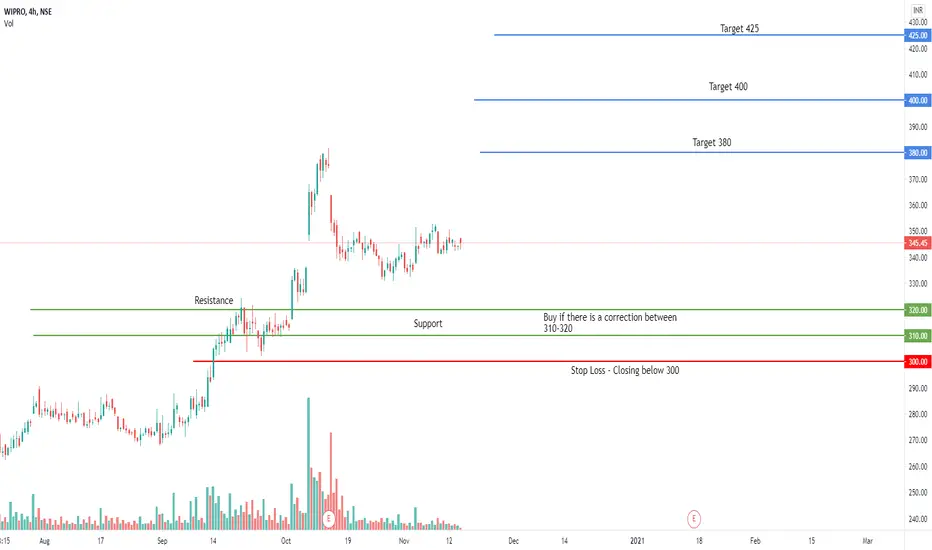
WIPRO REVRSAL , POSITIONAL TRADE.Wipro looks good for a positional trade, or option selling trade. Reasons are :
1. Bullish engulfing reversal at day frame.
2. double bottom reversal at 1 hour frame.
3. Reversal from 0.618% retracement zone.
4. The IT sector as a whole is in a bullish trend.
The stock has a good potential of around 9-10% in maximum 1 month.
But still, even after all these positive signs , remember that the trade can fail!
BUY- Risky players can enter at 339-340 zone. safe player enter only if it breaks 345.1
SL-331
TARGETS-356-363-369-373-379-OPEN
R:R-1:2.5
Also i have a Bullish bias on the market , the charts say so. Nifty will be above its all time highs by before 2021.

NIFTY KEY LEVELS SUPPORT AND RESISTANCE INTRADAY 02/11/2020 NIFTY50 KEY LEVELS SUPPORT AND RESISTANCE FOR INTRADAY 02/11/2020
TRADE WITH STRICT STOPLOSS AND FOLLOW RISK MANAGEMENT


#WIPRO Wipro seems to be bullish only if holds above 347, else we might find a good selling opportunity arround 344 for 326.
Regards

WIPRO - Breakout (Bearish Pennant Continuation Pattern) As per the price action on hourly chart, it is observed that the price action consolidated after a sharp correction to the previous gap up levels. Now price action formed a pennant triangle pattern, indicating continuation of prior strong bearish move. The price action may further fall down to 325-330 levels.
It is a low risk, high reward trade setup.
T1- 335 T2- 325 SL- 348

Inverted Cup and handle - Wipro. Ready for a downward break?Chart says it all. Forming an inverted cup and handle(Bearish). I expect it to breakdown in few days.

Intraday / Swing Setup: Looks good for 360/380Intraday / Swing Setup: Looks good for 360/380. Enter between 348-349 with SL of 344 for Intraday and 341 for Swing. Wait for confirmation on 15 mins chart.
Note: I am not a SEBI register and view is only for educational purpose as well as personal, always consult your financial advisor before investing or trading.

WIPRO : BUY CANDIDATEBUY CANDIDATE FROM THE CURRENT LEVEL , SHOULD BREAK THE DOT COM BUBBLE LEVEL (REDLINE) ! STOP LOSS SHOULD BE THE LEVEL OF 324 STRICTLY !
