WIPRO ... CHART SHOWS BY ITS OWN .....
I think we can see deep correction in wipro 2maro .....
IF wipro reacts positively , den look for tata to wipro
Wipro


wipro SHORT below 179 and long above 187stay short as long as it sustains below 187
once it cross 187 then go LONG
plan position size as per your own risk appetite


Marico & Wipro ShortsBoth have similar structure and rejected off HTF resistance. Break of Pinbars with volume would resume bearish continuation.


WIPRO LONGThere is a flag pattern formation in the WIPRO weekly chart and it is retesting the 200 EMA line .. lets look for the further movement and possible opportunity for the long position
Will post another linked article if required conditions met ...
DISCLAIMER : All the articles posted are for analysis purpose only , any trade taken shall be under your own analysis and risk

WIPROAlternate view on the WIPRO long position ... might look like the pattern is already broken and it has been retested
Can get a trade opportunity based on next week candle
DISCLAIMER : All the articles posted are for analysis purpose only , any trade taken shall be under your own analysis and risk

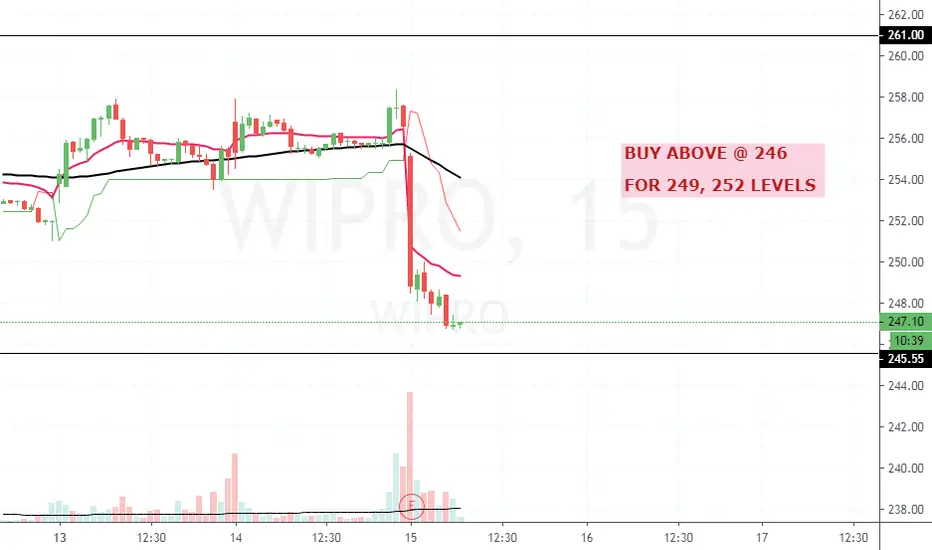
WIPRO Long position opportunityPossible long position opportunity with the targets provided as in chart
DISCLAIMER : All the articles posted are for analysis purpose only , any trade taken shall be under your own analysis and risk

Wipro Trend Analysis & Trade Setup !! Budget Day !TREND ANALYSIS & TRADE SETUP
Follow Chart Instruction.
Do not be Hurry for entry.
Wait for Proper Entry Setup.
Buy/Sell with Best Risk Reward.
Educational Chart Only.
You can Comment and ask the TREND ANALYSIS of any STOCK/SCRIPT/INDEX/FOREX.
Wait for entry setup, if available then Long/short.
R:R is 8-15 times.

The advance the stock had made in the last few weeks seems to beThe advance the stock had made in the last few weeks seems to be corrective rather than a attempt to move up. As of the stock has taken resistance at an resistance level and formed a dark cloud cover. A move below 243 will aggravate selling and the stock may test 238, 235 & 227 level. However a move above 251 will negate the bearish view and the stock may render into sideways movements again.

Short WIPROWipro has made a symmetrical pattern and it broke down but tested back again
STOPLOSS - top of triangle


WIPRO day chart study - Keep it in your watchlistWIPRO day chart study - Keep it in your watchlist.
We will be on wait and watch mode until Wipro forms a bottom and shows signals of reversal.

LONG WIPROON VERY STRONG DEMAND ZONE SO MAY GET BUYERS AND AGAIN RETEST MENTIONS LEVELS IN A BOUNCE. LEVELS MENTIONS ON CHART.