Wipro

WIPRO INVERSE H&S BREAKOUTWIPRO breaking inverse h&s reversal pattern
with huge volume,strong rsi
#target 580 soon
educational idea

Wipro Rising Post-Consolidation: Strong Risk-Reward SetupWipro has been on the rise after a solid consolidation phase, forming higher highs and higher lows. Currently, it’s retracing to a strong level with a favorable risk-to-reward ratio, aiming towards its all-time high (ATH). Ensure you enter trades with a predefined stop loss for safety.

Wipro Weekly AnalysisWipro is good on Long Side. It is a good time to enter in this stock. But this is for long term investments. The stock may give returns up to 44% returns.
Disclaimer:- Please always do your own analysis or consult with your financial advisor before taking any kind of trades NSE:WIPRO

Wipro Ltd | A Strong IT Momentum StockWipro Ltd | A Strong IT Momentum Stock
Wipro Ltd is a global Information technology, consulting and business process services (BPS) company
Financial: strong
Market Cap = 2,41,673 Cr. ROCE = 17.7 % ROE b= 15.9 %
Debt to equity = 0.26 Promoter holding =72.9 % Quick ratio = 2.28
Current ratio = 2.29 Piotroski score = 5.00 Profit Var 3Yrs= 5.30 %
Sales growth 3Years = 14.0 % Return on assets = 10.1 %
you Can see clearly rounding bottom create and good consolidation already done since 2 years.
stock is at good price. also feb retracement is also support in level.
moreover all IT sector is ready become rocket bcz USA market is also in positive trend.
Note: I am not SEBI registered financial Adviser. I solely present my views on chart .I do not charge any kind of service. This is not buy sell recommendation.
If you like my ideas than like boost and follow me for more ideas.
Thanks and comment freely

Buy Wipro Right now its up for breakout after consolidating in the sub wave of corrective structure. Look to buy and hold if you have the patience. Its already in the up move.

WiproWipro important points marked.
*nvestments in equity market are subject to market risk do own analysis before investing into equity market.


WIPRO C&H BREAKOUT WCBWIPRO breaking c&h pattern
weekly basis with good volume
good rsi ,trading above 20ema
#target 613-730
EDUCATIONAL IDEA

Triangle Breakout seen in India's 4th largest IT Services StockHello everyone, i hope you all will be doing good in your trading and your life as well, i have brought a large cap IT sector stock which has given Triangle Pattern breakout, and price is still sustaining above the breakout area, in yesterday's session we have seen neckline breakout, and today's price has come to retest the breakout.. A high probability trade is waiting from here, all levels i have given on chart like entry exit and targets. IT sector moment is supporting now a day's. Specially Midcap IT is on fire, i will try to bring some midcap stocks as well, but for now focus on nifty 50 stock.
Technically stock is looking good on chart, MACD is also giving bullish crossover.
RSI also giving bullish crossover, price is above 200-DEMA. (I have not placed any indicator on chart, but i have done my analysis before to publishing the idea.)
Stock is good to go long for short term to long term as well, we all know how wipro helped their investor to make them Billionaires, who invested in early 80's.
So the stock is same, still it has charm to give returns like it does earlier, but you have to be patience in it.
Market Cap
₹ 2,56,398 Cr.
Current Price
₹ 490
High / Low
₹ 546 / 375
Stock P/E
23.2
Book Value
₹ 143
Dividend Yield
0.20 %
ROCE
17.2 %
ROE
14.5 %
Face Value
₹ 2.00
Industry PE
29.7
Debt
₹ 16,465 Cr.
EPS
₹ 21.1
Promoter holding
72.9 %
Intrinsic Value
₹ 243
Pledged percentage
0.00 %
EVEBITDA
13.6
Change in Prom Hold
-0.01 %
Profit Var 5Yrs
4.17 %
Sales growth 5Years
8.75 %
Return over 5years
11.6 %
Debt to equity
0.22
Net profit
₹ 11,112 Cr.
ROE 5Yr
17.3 %
Profit growth
-2.69 %
Disclaimer:- Please always do your own analysis or consult with your financial advisor before taking any kind of trades.
Dear traders, If you like my work then do not forget to hit like and follow me, and guy's let me know what do you think about this idea in comment box, i would be love to reply all of you guy's.
Thankyou.

INVESTMENT PICK - WIPRO - TREND REVERSAL LONG ENTRIESSymbol - WIPRO
Wipro Ltd is a global Information technology, consulting and business process services (BPS) company. It is the 4th largest Indian player in the global IT services industry behind TCS, Infosys and HCL Technologies.
Wipro was in consolidation & accumulation phase from July 2022 to December 23.
After that it broke out of this consolidation zone with good buying volumes & went till 550. Now it is retracing back to breakout zone which is 450.
Wipro is a company with good fundamentals so it can be considered for medium to long term investment.
Wipro CMP - 452
It can be accumulated at current level for long term Investment perspective.
More position can be added at 410 - 415 levels.
Stoploss can be 350 or below 350.
Targets can be 545, 600 & 720 which represents 21%, 35% & 58% upside from current level respectively.
Disclaimer - Do not consider this as a buy/sell recommendation. I'm sharing my analysis & my investment position. You can track it for educational purposes. Thanks!

Bullish Cup and Handle Pattern: Wipro Heading Towards 545Details:
Asset: Wipro Limited (WIPRO)
Pattern: Cup and Handle
Breakout Level: Above handle resistance (specific level not mentioned, assuming current resistance)
Potential Target: 545
Stop Loss: Below breakout level or as per risk tolerance
Timeframe: Short to medium-term
Rationale: Wipro Limited (WIPRO) is forming a cup and handle pattern, which is a bullish continuation pattern. A breakout from the handle could indicate the potential for a significant upward move towards the target of 545.
Market Analysis:
Technical Pattern: The cup and handle pattern is a bullish formation that typically signals further upside. Breaking out from the handle suggests a resumption of the prior uptrend.
Market Sentiment: Positive market sentiment or company-specific catalysts may be supporting the anticipated breakout in WIPRO.
Price Target:
The target for WIPRO is set at 545, based on the cup and handle pattern breakout.
Risk Management:
Implementing a stop loss strategy below the breakout level (handle resistance) is crucial to manage risk in case of unexpected price reversals.
Timeframe:
The projected move towards 545 is based on a short to medium-term outlook, but actual timing may vary based on market conditions.
Risk-Reward Ratio: Consider individual risk tolerance and adjust position size accordingly to maintain a favorable risk-reward ratio.
As with any investment opportunity, conduct thorough analysis and consider factors such as market trends, company fundamentals, and risk management strategies before making trading decisions.

Wipro creating good swing trade in weekly time frame Wipro creating good swing trade in weekly time frame
Price consollidation near 200 EMA since 2 years and time to breakout consolidation upper zone.
As per wave theory its ready to create fresh 12345 in weekly time frame and 5 of Monthly time frame.
Wipro-An amazing opportunity to enter a bluechip stock!Wipro had a strong resistance of 450 which broke and is now acting as a support.
Since Nifty IT is looking bullish, we can expect a reversal in this stock.
An amazing investment stock available at a very good price.

Wipro formed Big Bullish candle on Weekly TFIT Sector witnessed strong momentum in last week
Wipro took support around prev week lows & came near 480 level
It may come for retesting levels, track for Bullish pattern with all confirmations
Downside imp support is placed around 450
whereas upside hurde is at 495/495 zone
Learn and P ractice Price Action Setups

1.5 years long bullish Inverted Head & Shoulder Breakout A Bullish Breakout of Inverted Head and Shoulder pattern is visible on the Daily chart of NSE:WIPRO
The shoulder is exactly at 0.236 fib retracement level. and the target is nearly at 0.50 fib level.
MACD gave Positive crossover on Daily, Weekly and Monthly chart. So, expecting the momentum to continue.
One can create a fresh position in the scrip as per the levels mentioned on the chart.
Risk Disclaimer:
The information provided in this analysis is based on my personal interpretation of market conditions and the available data at the time of writing. It is advisable to seek advice from a qualified financial professional and to conduct your own research before making any investment decisions.

Wipro - Buy for target of 650Wipro is seen taking support at key area and several Buy calls for target of 650 to 700 in 1 yr looks good value buying now before its run up any time.

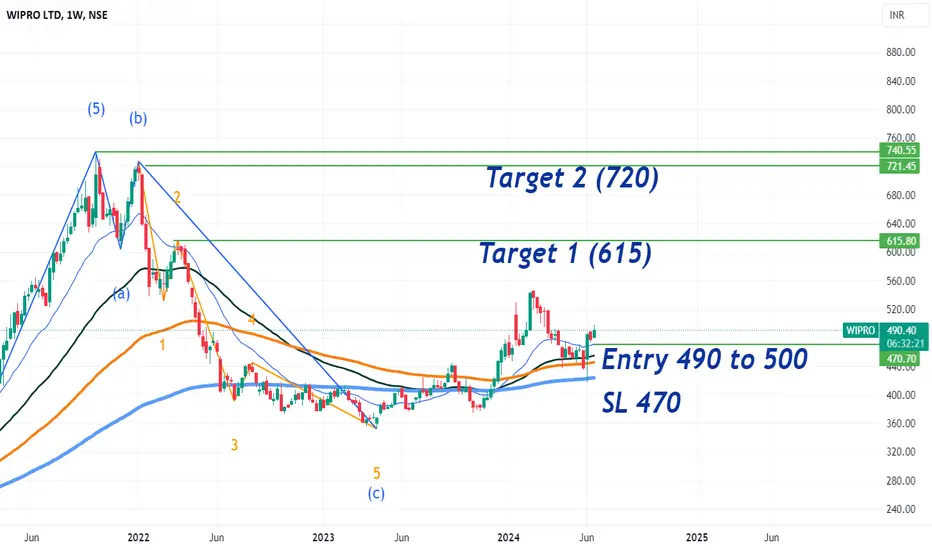
Cup and Handle Pattern in WiproNow Wipro is create Cup and Handle Pattern in Longer timeframe .
Take enter after break the trendline i have draw in chart .
entry level : 501.90-510
StopLoss level : 479-470
Target :
First Target 540
Second Target 625

Wipro within the purchasing range.Wipro appears to be within my budget for purchasing, so I've begun investing a portion of my funds. I anticipate a profit of approximately 150%. My initial goal is to reach the 720 range.
I am not SEBI registered. The information provided here is for education purposes only. I will not be responsible for any of your profit/loss with this suggestions. Consult your financial advisor before taking any decisions.

WIPRO AnalysisThe recent change in the management of WIPRO Ltd has brought a nice 56 Inch wide smile on Veterans who've been tracking the stock.
The CEO under whom, the profitability had reduced, has resigns and in exchange for him, we're finally getting someone who understands the Business and the Company.
I'm anticipating good moves in the stock from CMP.
Here are the details-
CMP- 486
Targets- 500, 520
Stoplsos- 476
Duration- 1-2 weeks
Let me know what you think about it.

Wipro: Bull Ride Long consolidation with huge sell spike in downtrend took sufficient time to recover, recent overall market bullish and some political factor influenced the investor to invest in Indian market. #Wipro looks like one of the hanging fruit for the investor. Recent, investment plan of investing in AI and new projects approvals will attract investors.
My Key support and resistance
* Overall support : 380
* Resistance : 525

Wipro showing bullish strength.Wipro for the intraday trade is looking bullish and has closed around the resistance zone.
The stock after the fall has given a bullish engulfing candle on the daily charts.
It has been respecting the resistance trend line. Even the RSI indicator is showing a bullish divergence in the stock.
If the stock starts trading above 520 levels and sustain above it, a bullish trade can be entered with a target of 525 for intraday.
Target levels :- 525, 533
Entry:- Above 520
If there is a gap up opening in the stock and it comes to retest the break out levels. A bullish trade can be entered after confirming the price action.
Double break out will be there in the stock. Positional/swing trade can also be created, if the stock closed above the levels on the daily front.
Wait for the price action near the levels before entering the market.

WIPRO - SWING TRADE - 23rd December #stocksWIPRO (1W TF)
Swing Trade Analysis given on 23rd December, 2023 (Saturday)
Pattern: RECTANGLE BOX BREAKOUT
- Breakout of Resistance - Done ✓
- Volume Spike near Breakout - Done ✓
- Retracement & Consolidation - In Progress
#stocks #swingtrade #chartanalysis #priceaction #traderyte #wipro
