Trade with Volume: The Hidden Power Behind Price (In-Depth)1. What Is Volume in Trading?
Volume represents the number of shares, contracts, or lots traded during a specific time period. In equities, it is the number of shares exchanged; in futures and forex, it reflects contracts or tick volume. Every trade requires both a buyer and a seller, but volume measures how active and aggressive that interaction is.
High volume means strong interest and participation. Low volume means lack of commitment. Price can move on low volume, but such moves are fragile and often reverse. Sustainable trends almost always require expanding volume.
In simple terms:
Price shows direction
Volume shows strength
2. Why Volume Is More Important Than Indicators
Most indicators—RSI, MACD, moving averages—are derived from price. Volume, however, is raw market data, not a derivative. Institutions, hedge funds, and smart money cannot hide their volume. They may disguise orders, but accumulation and distribution leave volume footprints.
Retail traders often get trapped because they trade patterns without volume confirmation. A breakout without volume is usually a false breakout. A reversal without volume is often a temporary pullback. Volume filters noise and exposes real intent.
3. Volume Confirms Trends
A healthy trend must be supported by volume.
In an uptrend, volume should increase during upward moves and decrease during pullbacks.
In a downtrend, volume should expand on declines and contract on rallies.
If price makes higher highs but volume declines, it signals weak participation—a warning of trend exhaustion. This phenomenon is known as volume divergence, and it often appears near major tops and bottoms.
Trend traders use volume to decide whether to hold, add, or exit positions. When volume confirms trend direction, staying in the trade becomes statistically favorable.
4. Volume and Breakouts
Breakouts are one of the most traded setups, but also one of the most failed—mainly because traders ignore volume.
A true breakout requires:
Expansion in volume
Wide-range candles
Acceptance above resistance or below support
If price breaks resistance on low volume, it suggests lack of institutional interest. Such breakouts are often stop-hunts designed to trap retail traders. High-volume breakouts, on the other hand, indicate fresh money entering the market, increasing the probability of follow-through.
Professional traders often wait for volume confirmation before entering, even if it means missing the first few points.
5. Volume at Support and Resistance
Support and resistance levels gain significance when combined with volume. When price approaches support:
Rising volume suggests strong buying interest
Falling volume suggests buyers are weak
At resistance:
High volume with rejection indicates distribution
High volume with breakout indicates absorption of supply
Institutions accumulate positions quietly near support with moderate volume, then push price higher with explosive volume. Similarly, they distribute near resistance before major declines. Observing volume behavior at key levels reveals who is in control—buyers or sellers.
6. Accumulation and Distribution
One of the most powerful uses of volume is identifying accumulation and distribution phases.
Accumulation occurs when large players buy gradually without moving price much. Volume increases, but price stays in a range.
Distribution occurs when institutions sell into retail buying enthusiasm. Volume remains high, but upside progress stalls.
These phases often precede major moves. Traders who recognize accumulation early can enter before breakouts. Those who spot distribution can exit before crashes. Volume is the only reliable tool to detect these silent transitions.
7. Volume Indicators and Tools
While raw volume itself is powerful, several indicators help interpret it:
Volume Moving Average: Compares current volume to historical norms.
On-Balance Volume (OBV): Tracks cumulative buying and selling pressure.
Volume Profile: Shows where trading activity is concentrated across price levels.
VWAP (Volume Weighted Average Price): Used heavily by institutions for intraday bias.
Accumulation/Distribution Line: Measures whether volume favors buyers or sellers.
These tools don’t replace price action—they enhance it. The best traders combine volume analysis with structure, not indicators alone.
8. Volume in Intraday Trading
In intraday trading, volume is even more critical. The first hour of trading often sets the tone for the day. High volume during opening range breakouts signals institutional participation. Low volume midday moves are often fake and best avoided.
Scalpers use volume spikes to enter momentum trades. Intraday reversals are most reliable when they occur with climactic volume, indicating exhaustion. Without volume, intraday setups lack edge.
9. Volume in Different Markets
Volume behaves differently across markets:
Equities: Actual traded volume is transparent and highly reliable.
Futures: Centralized volume makes it ideal for volume analysis.
Forex: Uses tick volume, which still correlates strongly with real activity.
Crypto: Volume is crucial due to manipulation; fake moves often occur on thin volume.
Regardless of market, the principle remains the same: strong moves require strong participation.
10. Common Mistakes Traders Make with Volume
Many traders misunderstand volume by:
Using volume alone without context
Ignoring volume at key levels
Overtrading low-volume markets
Assuming high volume is always bullish or bearish
Volume must always be read relative to price action and market structure. It is not directional by itself—it explains why price is moving.
11. Volume and Risk Management
Volume also helps with risk management. Trades entered on high volume have better liquidity, tighter spreads, and smoother execution. Low-volume trades increase slippage and false signals. Professionals prefer trading instruments with consistent, healthy volume.
Stop-loss placement improves when volume is considered. Stops placed beyond high-volume nodes are less likely to be hunted.
12. The Institutional Perspective
Institutions think in terms of liquidity, not indicators. Volume tells them where liquidity exists. Retail traders who learn volume analysis begin to think like institutions—waiting for confirmation, avoiding thin markets, and aligning with dominant flows.
Volume is the bridge between retail charts and institutional reality.
Conclusion
Trading with volume transforms how you see the market. It shifts your focus from prediction to confirmation, from hope to evidence. Price can lie, patterns can fail, and indicators can lag—but volume reveals participation, strength, and intent.
If price is the story, volume is the truth behind it.
Traders who master volume stop chasing moves and start positioning alongside smart money. In the long run, volume is not just an indicator—it is a strategic edge that separates consistent traders from emotional gamblers.
X-indicator

Smart Money Secrets: How Institutions Really Control the Markets1. Smart Money Thinks in Liquidity, Not Indicators
Retail traders focus on indicators like RSI, MACD, or moving averages. Smart money focuses on liquidity—where orders are resting.
Liquidity exists at:
Previous highs and lows
Trendline breaks
Obvious support and resistance
Round numbers (100, 500, 1000)
Stop-loss clusters
Institutions need large volumes to enter or exit positions. They cannot buy or sell all at once without moving price against themselves. So instead, they hunt liquidity, pushing price toward areas where retail stops and pending orders sit.
That’s why price often:
Breaks resistance, then reverses
Sweeps a low before rallying
Triggers stop-losses before the real move
These are not random moves. They are liquidity grabs.
2. Accumulation and Distribution Are the Core Game
Smart money operates in phases, not single trades.
Accumulation Phase
Institutions accumulate positions when:
Price is moving sideways
Volatility is low
Sentiment is negative or boring
Retail interest is minimal
This phase often looks like a “range” or “consolidation.” Retail traders get chopped, frustrated, and exit—while smart money quietly builds positions.
Expansion (Markup or Markdown)
Once enough positions are accumulated:
Price breaks out aggressively
Volume expands
News suddenly turns positive (or negative)
Retail traders chase the move
Distribution Phase
At the top or bottom:
Price again moves sideways
Volatility compresses
Retail believes the trend will continue forever
This is where institutions offload positions to emotional traders.
Smart money buys boredom and sells excitement.
3. Smart Money Uses Time as a Weapon
Retail traders want quick profits. Smart money uses time to exhaust them.
Institutions are patient. They can hold positions for weeks or months. During this time:
Price may move slowly or erratically
Fake breakouts trap traders
Multiple stop hunts occur
Most retail traders quit right before the real move begins.
Time-based manipulation is why:
Breakouts fail repeatedly before succeeding
Strong moves come after long consolidation
Trends feel “obvious” only after they’ve already run
4. News Follows Smart Money, Not the Other Way Around
A major secret is this: smart money positions itself before news becomes public.
Institutions don’t wait for:
Earnings announcements
Rate decisions
Economic data
Instead, they anticipate outcomes and use news as a liquidity event.
That’s why you often see:
Price moving before news
“Good news” causing a market drop
“Bad news” triggering rallies
News gives smart money an excuse to:
Trigger stops
Exit positions
Reverse trends
Retail traders react to headlines. Smart money uses them.
5. False Breakouts Are a Feature, Not a Bug
One of the most painful experiences for retail traders is the false breakout. For smart money, false breakouts are essential tools.
They serve three purposes:
Trigger stop-losses
Induce breakout traders to enter
Provide liquidity for institutional entries
When price breaks a key level and quickly returns, it often signals:
Smart money has completed accumulation
Liquidity has been collected
The real move is coming in the opposite direction
This is why experienced traders wait for confirmation after the trap, not the breakout itself.
6. Smart Money Respects Market Structure
Institutions operate within market structure, not random entries.
Key structure concepts include:
Higher highs and higher lows (bullish control)
Lower highs and lower lows (bearish control)
Break of structure (trend shift)
Change of character (early reversal signal)
When structure breaks:
Smart money adapts
Positions are reduced, hedged, or reversed
Retail traders often hold losing positions hoping structure will “come back.” Institutions exit without emotion.
7. Risk Management Is the Ultimate Edge
Smart money does not aim for perfection—it aims for survival and consistency.
Core principles:
Small risk per trade
Asymmetric reward (small risk, large upside)
Accepting losses as business expenses
Never being emotionally attached to a bias
Institutions win not because they predict every move, but because their losers are controlled and their winners are allowed to run.
Retail traders often do the opposite.
8. Smart Money Thinks in Probabilities, Not Certainty
There is no “sure shot” trade in smart money thinking.
Instead:
Every trade is a probability bet
Bias is adjusted as new data appears
Flexibility is valued over ego
Institutions are comfortable being wrong quickly. Retail traders try to be right at all costs.
9. Retail Sentiment Is a Contrarian Indicator
One of the oldest smart money secrets is this:
When the majority is confident, risk is highest.
Institutions monitor:
Retail positioning
Social media sentiment
Option flows
Crowd behavior
Extreme optimism or pessimism often marks:
Market tops
Market bottoms
Smart money doesn’t follow the crowd—it feeds on it.
10. The Real Secret: Discipline Over Intelligence
The final truth is uncomfortable: smart money is not always smarter—it is more disciplined.
They have:
Rules they don’t break
Systems they trust
Emotions removed from execution
Most retail traders fail not because of lack of knowledge, but because of:
Overtrading
Revenge trading
Ignoring risk
Emotional decision-making
Smart money wins because it treats trading as a process, not a thrill.
Conclusion
Smart money secrets are not hidden in complex indicators or secret formulas. They are visible in price behavior, liquidity, structure, and human psychology. Institutions exploit impatience, emotion, and predictability. Retail traders who learn to think like smart money—waiting, observing, managing risk, and respecting structure—move from being liquidity providers to informed participants.
The market is not against you—but it rewards those who stop reacting and start thinking like capital, not crowds.

BTC 4H Update
Price still trapped in a descending structure.
Lower highs intact, trendline resistance holding.
🔻 Rejection near 71.6k
🧱 Major supply: 85.9k – 90.4k
🛡 Key support: 59.9k
As long as BTC stays below the trendline, rallies look like relief bounces.
Break above = momentum shift.
Lose 60k = next leg down.

Short to Swing Investment Stock - GMR POWER**GMR POWER - Fibonacci Retracement Play | Weekly Setup**
📊 **Long-Term Accumulation Zone with Multiple Entry Strategies**
**Technical Setup:**
✅ Trading in Fibonacci retracement zone (0.382-0.618)
✅ Consolidating after strong base formation from 60-70 levels
✅ Weekly timeframe showing accumulation pattern
✅ RSI neutral with room for upside momentum
**Current Price:** 109.58
**Entry Strategies:**
**Aggressive Buy:** Current levels (109-115)
- For momentum traders
- Quick move possible to 126+
**Conservative Buy:** Above 126.60 breakout
- Confirmation entry
- Lower risk, higher conviction
**Fibonacci Levels:**
- 0.382: 119.54 (minor resistance)
- 0.5: 128.87 (key breakout level)
- 0.618: 138.19 (major resistance)
- 0.786: 151.46 (swing target)
**Targets:**
- **Grand Swing Target:** 158.70
- **Short to Long-Term:** 189-217 zone
**Support/SL:** Below 98.71 (weekly candle close basis)
**Strategy:** Ideal for patient investors. Accumulate in current zone or wait for 126+ breakout. Weekly structure suggests strong upside potential once consolidation completes.
**Disclaimer:** This is for educational purposes only and not financial advice. Do your own research and consult a financial advisor before investing. Trade at your own risk.

Buy on Dips - SCHNEIDER Analysis**SCHNEIDER - Buy on Dips | Strong Demand Zone + Triple Bottom**
📊 **Strong Price Action at Key Demand Zone**
Triple bottom formation at critical support - classic accumulation pattern:
**Why Buy on Dips:**
✅ Triple bottom shows institutional accumulation - **Demand Zone:** 561-600 (tested 3x since May 2025)
✅ Price defending demand zone with conviction
✅ Strong bounce from support - buyers stepping in
✅ All major MAs trending upward
**Targets:**
- **Tgt 1:** 862 (+12%) / - **Tgt 2:** 920 (+20%) / - **Tgt 3:** 1,000 (+30%)
**Strategy:**
Accumulate on any dip towards 730-750 zone. Strong hands at support making this a low-risk, high-reward setup.
**SL:** Below 730 (weekly close)
**Disclaimer:** This is for educational purposes only and not financial advice.
Always do your own research and consult with a financial advisor before making any investment decisions.
Trade at your own risk.

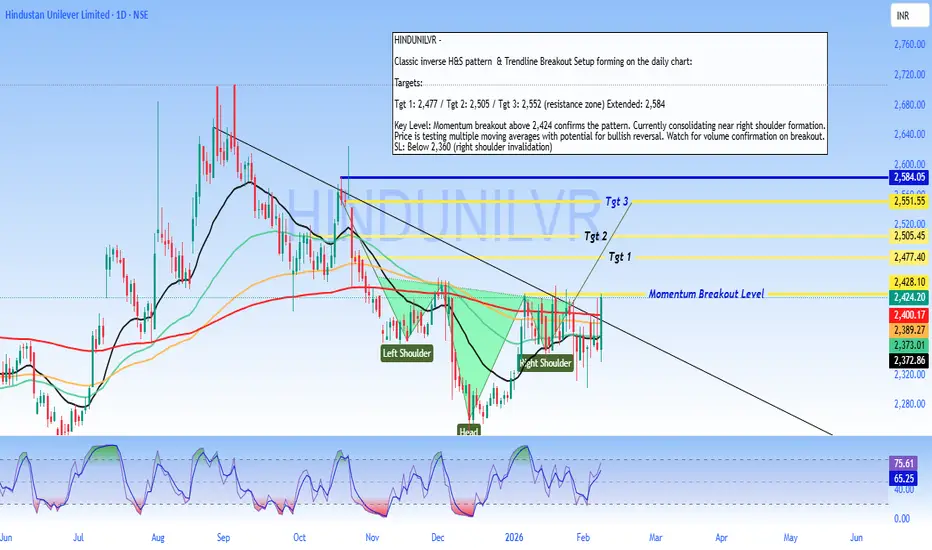
HINDUNILVR - Inverse Head & Shoulders & Trendline Breakout Setup**HINDUNILVR - Inverse Head & Shoulders & Trendline Breakout Setup**
Classic inverse H&S pattern forming on the daily chart:
- **Head:** ~2,280 (Dec-Jan bottom)
- **Shoulders:** Left shoulder at ~2,370 (Nov), Right shoulder at ~2,373 (current)
- **Neckline/Breakout Level:** 2,424
**Targets:**
- **Tgt 1:** 2,477
- **Tgt 2:** 2,505
- **Tgt 3:** 2,552 (resistance zone)
- **Extended:** 2,584
**Key Level:** Momentum breakout above 2,424 confirms the pattern. Currently consolidating near right shoulder formation.
Price is testing multiple moving averages with potential for bullish reversal. Watch for volume confirmation on breakout.
**SL:** Below 2,360 (right shoulder invalidation)
Feel free to adjust the stop-loss or add your own risk management preferences!
Disclaimer: This is for educational purposes only and not financial advice. Always do your own research and consult with a financial advisor before making any investment decisions. Trade at your own risk.
I think chart is telling somethingUnderline asset is above 50,100,200 days MA.
Supertrend is active.
RSI is above 50
MACD is above zero line.
Volume breakout at 50 days MA.

ETH/USD Daily — Support Bounce Setup in a Strong Downtrend
Chart Analysis:
Market Structure:
ETH is clearly in a bearish trend on the daily timeframe. Lower highs and lower lows are intact after a sharp rejection from the major supply zone around 3,300–3,400 (yellow zone).
Impulsive Sell-Off:
The recent move down is strong and aggressive, suggesting capitulation-style selling rather than a slow grind. This often precedes at least a technical relief bounce.
Key Support Zone (Red): ~1,900–2,000
Price has tapped into a well-defined demand/support area, where buyers previously stepped in. The long lower wicks here hint at buying interest and absorption.
Proposed Entry:
The marked entry is based on a support reaction, not a trend reversal. This is a counter-trend long, so it’s tactical, not positional.
Target Zone (Green): ~2,450–2,550
This zone aligns with:
Prior structure support → resistance flip
Likely liquidity resting above
Mean reversion after an extended drop
Bias & Expectations:
Short-term: Bullish relief bounce toward the green zone
Medium-term: Still bearish unless ETH reclaims and holds above ~2,600–2,700
Expect high volatility—clean V-shaped recoveries are rare in this context
Risk Note:
If price loses the 1,900 support decisively, the setup is invalidated and opens the door for continuation toward lower psychological levels.
📌 Summary:
This chart shows a high-risk, counter-trend bounce play off major daily support, targeting a logical resistance zone above. Good for disciplined traders, not for blind bottom-catching.

Bearish Continuation Setup After Dead-Cat Bounce (1H)
What the chart is saying:
Clear bearish trend: Price has been making lower highs and lower lows. The broader structure is decisively bearish.
Range breakdown: The blue box shows a consolidation range that broke to the downside, confirming continuation rather than accumulation.
Strong sell-off into demand: Price aggressively dropped into the red support zone (~62k–64k), where buyers stepped in hard, creating a sharp bounce.
Relief rally, not reversal: The current move up is a retracement, not a trend change. Momentum looks corrective, not impulsive.
Key resistance zone (~71k–72k):
This green area is previous support turned resistance
It aligns with the breakdown level → classic short opportunity
Planned trade idea (as drawn):
Entry: Into resistance (green zone)
Invalidation: Clean acceptance above resistance
Target: Prior support / liquidity pool around 63k
R:R: Favorable if rejection confirms
Bias:
📉 Bearish below resistance
Only a strong breakout + hold above 72k would weaken the short thesis
What to watch next:
Rejection wicks, bearish engulfing, or momentum divergence at resistance
Volume drying up on the push into the green zone
Failure to reclaim broken structure
⚠️ This setup assumes trend continuation, not a bottom. Until structure flips, rallies are sell-the-rip candidates.

BTCUSD Daily – Bearish Breakdown & Sell-the-Retests Setup
Here’s what the chart is saying, clean and to the point:
Market Structure
Clear distribution → breakdown sequence on the daily.
Price topped near the mid-90Ks, rolled over, and lost the 83–84K demand zone (former support marked in blue).
That loss flipped market structure firmly bearish.
Key Levels
Major breakdown level: ~83–84K (prior demand → resistance)
Supply / entry zone: ~72–74K (blue zone labeled “entry”)
Current support: ~67.4K (thin blue line)
Primary target: ~60–62K (grey demand zone)
Price Action Logic
The vertical sell-off into ~67K suggests impulsive bearish strength, not exhaustion.
The projected path shows a dead-cat bounce / consolidation into ~72–74K.
That zone aligns with:
Prior consolidation
Bearish retest logic
Likely supply from trapped longs
Trade Thesis (as illustrated)
Bias: Short
Entry idea: Sell a rejection in the 72–74K zone
Invalidation: Strong daily close back above ~75K
Target: 60–62K demand (first meaningful higher-timeframe support)
Big Picture
Unless BTC reclaims the 80K+ region quickly, this chart favors continuation lower, not a V-shaped recovery. The structure says rallies are for selling, not buying.

POWERGRID: Trend Reversal Indicators & Key LevelsThe stock of POWERGRID is showing signs of a potential trend reversal after an extended downtrend. Several technical factors across multiple timeframes support this shift in momentum.
The stock has recently managed to close above the 200-day EMA, a level widely monitored for assessing long‑term trend shifts. A golden crossover—where a shorter‑term moving average crosses above a longer‑term one—has also taken place.
This movement has been supported by strong trading volume, adding weight to the possibility of a positive structural change.
A triangle breakout has been observed on the chart, indicating that price has moved decisively out of a prolonged consolidation pattern.
Breakouts supported by volume are often interpreted as signals of improving momentum.
On the weekly timeframe, a bullish MACD crossover has been confirmed.
Weekly MACD signals tend to carry stronger implications for medium‑term momentum, suggesting sustained upward interest.
The RSI has approached the upper band, reflecting strong momentum.
However, this positioning also indicates the possibility of a short‑term pullback or cooling phase.
A potential supply zone around ₹318 may act as an area of temporary resistance.
Key Levels to Monitor:
Possible Supply / Resistance Zone: ₹318
Major Resistance Level: ₹354 (may be tested after consolidation or a short‑term pullback)
Support Zone: Around ₹250 (critical reference level for this setup)
Disclaimer: This analysis is intended solely for educational and informational purposes. It does not constitute financial advice or a recommendation to buy, sell, or hold any security. Investors should conduct their own research and consult a licensed financial advisor before making investment decisions.

XAUUSD (H2) – Liam's AnalysisXAUUSD (H2) – Liam View
Rally into supply | Volatility risk rising
Gold is rebounding from the 4550–4600 demand base, but the broader H2 structure still points to a selling environment. The current move higher looks corrective, driven by short covering and liquidity rotation rather than a confirmed trend reversal.
From the chart, price is rotating back toward 4900–5030, a zone where previous distribution and liquidity rest. Unless price can accept above this area, rallies should be treated as selling opportunities, not breakout confirmation.
Key technical zones
Major selling zone: 5536 – 5580 (HTF supply)
Near-term reaction zone: 5000 – 5030
Key demand / base: 4550 – 4600
Intraday support: ~4730
Market context
Recent US political headlines and institutional reviews add another layer of headline-driven volatility, increasing the risk of sharp swings and liquidity sweeps. In such conditions, gold often reacts erratically intraday, but higher-timeframe structure tends to reassert itself once the noise fades.
Outlook
As long as price stays below 5030, the bias remains sell-side dominant.
Failure to hold above 4730 would reopen downside risk toward the demand base.
Only a clean H2 acceptance above 5030 → 5100 would neutralize the bearish structure.
Execution note
Avoid chasing momentum in news-driven sessions.
Let price come to levels. Trade the reaction, not the headlines.
— Liam

Part 2 Intraday Institutional Trading What Moves Option Premium?
Premium depends on:
Underlying price movement
Time left to expiry
Volatility (IV)
Interest rates
Demand & supply
If markets move aggressively, option premiums rise quickly.

Part 1 Intraday Institutional Trading ITM, ATM, OTM Options
These describe where the current price is compared to strike price.
a) ITM – In The Money
Call: Current price > Strike
Put: Current price < Strike
ITM options cost more.
b) ATM – At The Money
Current price ≈ Strike price
Most volatile and liquid.
c) OTM – Out of The Money
Call: Current price < Strike
Put: Current price > Strike
OTM is cheaper but risky; goes to zero quickly on expiry.

ETH BearishWhile the market is currently in a strong bearish phase and sentiment is driven by fear, price action suggests a long-term recovery ahead. I expect 2026 to form a macro bottom, 2027 to be a consolidation year, and 2028 to initiate the next major bullish cycle in crypto.

Part 5 Advance Trading Strategies Why Do Options Have Time Decay? (Theta)
Options lose value as expiry approaches.
This is called Theta Decay.
Example:
Monday premium: ₹100
Thursday premium: ₹20
Expiry day: ₹0
This happens because time is part of the option’s value. If market doesn’t move, buyer loses money; seller gains.

Part 4 Technical Analysis Vs. Institutional Option TradingPut Options (PE) Explained
Put = Right to sell
You buy a put when you expect the price to go down.
Loss is limited to premium paid.
Profit can rise significantly in sharp downtrends.
Example:
If Nifty is at 22,000 and you buy 21,900 PE, you are expecting Nifty to fall below 21,900.

RELIANCE 1 Month Time Frame 📌 Latest Trading Price (market close Feb 6 2026): ₹1,450.85 on NSE/BSE.
📈 Key Resistance Zones (Upside)
₹1,455–₹1,460 — immediate technical resistance (pivot cluster)
₹1,470–₹1,480 — next barrier above recent highs seen in early Feb price swings
~₹1,500 — psychological resistance (round number) — watch if momentum sustains
Bullish scenario: Break and hold above ~₹1,460–₹1,470 with decent volume could point toward ₹1,480–₹1,500 next.
📉 Key Support Levels (Downside)
₹1,440–₹1,442 — first support cluster from pivots
₹1,430–₹1,435 — deeper near-term support if current level breaks
₹1,380–₹1,390 — broader monthly lower support (recent swing lows)
Bearish risk: A sustained close below ₹1,430 may shift bias lower toward ₹1,380.
📌 Quick Practical Summary
Levels to watch this month (chart/time-frame sensitive):
• Buy/Support:
₹1,440–₹1,442 (first line)
₹1,430–₹1,435 (next support)
₹1,380–₹1,390 (deeper zone)
• Sell/Resistance:
₹1,455–₹1,460 (initial resistance)
₹1,470–₹1,480 (secondary area)
₹1,500+ if strong break above

Bitcoin - Rising Wedge - Go Short!Bitcoin seems to be breaking down from this rising wedge that it has been trading in the past few hours. Once it get's broken, expecting it to flush to the downside pretty quickly.

Part 3 Technical Analysis Vs. Institutional Option TradingCall Options (CE) Explained
Call = Right to buy
You buy a call when you expect the price to go up.
Your loss is limited to premium paid.
Your profit can be unlimited (theoretically).
Example:
If Nifty is at 22,000 and you buy a 22,100 CE, you are expecting Nifty to rise above 22,100 before expiry.
Profit if market rises → premium increases.
Loss if market falls → premium decreases.

MUTHOOTFIN 1 Week Time Frame 📊 📍 Current Weekly Price Context
• Current price (recent trade close) is around ₹3,704.20.
🔹 KEY WEEKLY LEVELS (Support & Resistance)
📈 Weekly Resistance Levels — possible upside barriers where selling pressure could appear:
R1: ~₹3,805–₹3,810 — first major resistance zone.
R2: ~₹3,830–₹3,880 — next higher resistance.
R3: ~₹3,900+ — extended resistance from recent highs.
📉 Weekly Support Levels — zones that can act as buyers on dips:
S1: ~₹3,740–₹3,750 — first support.
S2: ~₹3,690–₹3,700 — secondary support.
S3: ~₹3,650–₹3,670 — deeper buyer interest area.
📌 Weekly Pivot (Mid-Point): ~₹3,770–₹3,775 — key pivot that often acts as dynamic support/resistance on weekly TFs.
📅 HOW TO USE THESE WEEKLY LEVELS
Bullish Scenario:
A weekly close above ₹3,805–₹3,810 increases the probability of an extension toward the higher resistance zones around ₹3,830–₹3,880+.
Neutral / Range:
Price oscillation between ₹3,740–₹3,830 suggests consolidation on the weekly chart — until breakout or breakdown volume confirms direction.
Bearish Scenario:
A sustained break below ₹3,740 could expose deeper supports around ₹3,690–₹3,670 on the weekly view.
📌 Note: These are purely technical reference levels from common weekly pivot/resistance frameworks on Indian stock charts — not investment advice. Always combine with volume, trend indicators (e.g., RSI/MACD) and risk management for your strategy.

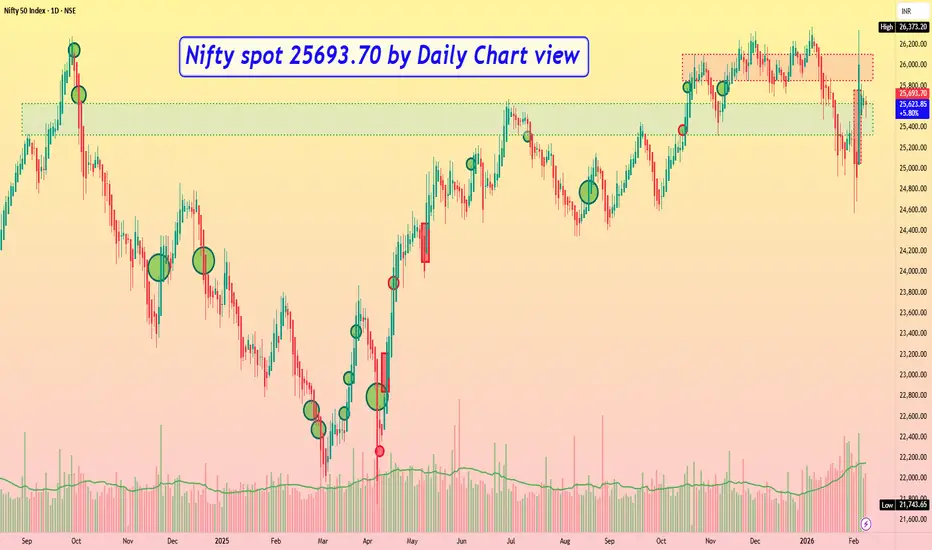
Nifty spot 25693.70 by Daily Chart view - Weekly UpdateNifty spot 25693.70 by Daily Chart view - Weekly Update
- Support Zone 25325 to 25625 for Nifty Index
- Resistance Zone 25850 to 26105 then upwards at ATH 26373.20 for Nifty Index
- Nifty fell short by tad bit of 32 points to create a New ATH on 03rd February, 2026
- Nifty Gap Up Opening of 533 pts on 03-Feb-2026 would need be filled, sooner or later
XAUUSD – H1 Outlook: Buying InterestXAUUSD – H1 Outlook: Liquidity Build While Risk Premium Supports Gold | Lana ✨
Gold is holding firm after a clean rebound from the sell-side liquidity sweep, and the current price action suggests the market is now building structure rather than trending aggressively.
📌 Technical picture (SMC/flow-based)
Price has transitioned from the sell-side sweep into a steady climb, now respecting the upper trendline.
The 4,940–4,970 region is acting as a short-term balance / re-accumulation zone where price is pausing and collecting liquidity.
Above the current range, buyside liquidity is visible near the recent highs, with a key magnet around 5,015.
A healthy pullback into 4,920–4,940 would still keep the bullish intraday structure intact and often provides a better re-entry opportunity than chasing highs.
🎯 Scenarios to watch
Bullish continuation: Hold above 4,940–4,970 → reclaim highs → seek liquidity toward 5,015, then extension higher if the price accepts.
Corrective dip first: A brief sweep below the range toward 4,920–4,940 → bounce back into the trendline → continuation to highs.
🌍 Macro backdrop (short & relevant)
ETF inflows into oil are rising sharply as US–Iran tensions increase, which typically lifts the geopolitical risk premium. When risk sentiment tightens, gold often benefits as a defensive hedge — supporting the idea that pullbacks may remain corrective, not reversal-driven.
✨ Stay patient, trade the levels, and let liquidity guide the next expansion. Follow Lana for more intraday updates and share your view in the comments.
