JK TYREJK TYRE is consolidating near the previous Swing High Supply zone around 500–510 after a strong uptrend from lower levels. Instead of a sharp rejection, price is holding near resistance and contracting, while sustaining above the weekly 9 EMA. This price behaviour often points to supply absorption rather than distribution.
The stock continues to show leadership strength, with a high RS Rating (92 on the daily chart), indicating strong relative performance versus the broader market.
From a probability perspective:
> Sustained acceptance above the supply zone with expansion could support trend continuation.
> Failure to hold above key EMAs and acceptance below the range would suggest supply is still active.
On the fundamental side , the company has outlined a ₹5,000 crore capex plan over the next few years, focused on capacity expansion and long-term growth, which adds supportive context to the technical structure.
Keep it in your watchlist.
✅ If you like my analysis, please follow me here as a token of appreciation :) in.tradingview.com/u/SatpalS/
📌 For learning and educational purposes only, not a recommendation. Please consult your financial advisor before investing.
X-indicator

Part 2 Institutional Option Trading VS. Technical AnalysisWhy Option Prices Move
Option pricing is driven by four major forces:
1. Price Action (Directional Movement)
If the underlying goes up, call premiums rise.
If the underlying goes down, put premiums rise.
2. Time Decay (Theta)
Options lose value as they approach expiry.
Time decay accelerates sharply in the last week.
3. Volatility (Vega)
When implied volatility (IV) increases, option premiums rise.
When IV falls, option premiums drop.
4. Interest Rates & Dividends
Small effect for index options, more for stock options.

XAUUSD (H2–H4) – Liam Market AnalysisXAUUSD (H2–H4) – Liam Market View
Gold at a critical decision zone as macro pressure builds
Gold is currently trading inside a broad corrective range, with price struggling to reclaim key supply after the previous impulsive sell-off. The recent rebound remains technical in nature, driven by short-term liquidity rotation rather than a confirmed trend reversal.
🔍 Technical Structure (from the chart)
Price is capped below the mid-range resistance around 5000–5050, showing weak acceptance.
The 5386 – 5580 zone remains the dominant sell-side supply, aligned with higher-timeframe distribution.
Downside liquidity is clearly defined near 4730 – 4760, acting as the primary demand base.
As long as gold trades below 5386, the structure continues to favour selling on rallies rather than breakout continuation.
This keeps the market in a range-to-bearish rotation, where rallies are corrective unless proven otherwise.
🌍 Macro & Cross-Market Context (Today)
Rising expectations of faster BOJ rate hikes are supporting JPY and adding pressure across USD pairs.
At the same time, USD strength remains a headwind for gold, limiting upside expansion.
Ongoing warnings about JPY volatility intervention add uncertainty to FX markets, increasing the probability of liquidity-driven swings across risk assets and commodities.
With global central banks shifting toward tighter policy paths, gold is struggling to sustain upside momentum despite its safe-haven role.
🎯 Scenarios to Watch
Primary bias – Sell the rally
Rejections into 5000 → 5386 favour rotation back toward 4730 liquidity.
Alternative scenario – Range continuation
Price may oscillate between 4730 and 5050 as markets wait for clearer macro catalysts.
Bullish invalidation
Only a clean acceptance above 5386 would shift the bias and reopen upside toward higher supply.
🧠 Liam’s Take
This is a market of levels, not emotions.
Gold is reacting to macro pressure and liquidity mechanics, not trending freely. Until price proves acceptance above supply, patience and level-based execution remain key.
Trade the structure.
Let liquidity show intent.
— Liam

XAUUSD (Gold) – 1H Chart Analysis & Trade Idea
Gold has completed a strong corrective phase after the sharp bearish impulse and is now showing signs of trend reversal and bullish continuation. Price respected the recent swing low (marked with the circle), forming a higher low, which confirms improving market structure.
After the rebound, price pushed above the short-term moving average and successfully retested a key demand zone, which now acts as support. This area aligns with previous consolidation, increasing the probability of bullish continuation.
Trade Idea
Entry: Buy from the highlighted green support / entry zone
Stop Loss: Below the red support zone (below recent higher low)
Target: Upper green resistance zone (prior supply area)
Technical Confluence
Higher low formation (bullish structure shift)
Strong rejection from demand zone
Moving average support holding
Previous resistance turned support
Favorable risk-to-reward setup
Conclusion
As long as price holds above the stop-loss zone, the bullish bias remains valid. A sustained move toward the marked target zone is expected. A break below support would invalidate this setup.
This analysis is for educational purposes only. Always manage risk properly.
If you want, I can also:
Rewrite this in short TradingView post style
Translate it into German, French, Spanish, Italian, Turkish, or Polish
Create a title-only version for quick posting

Breakout with volume | upside moveIFCI is currently exhibiting a highly constructive technical setup that signals a significant shift in long-term momentum. After a period of healthy consolidation, the stock successfully reclaimed its 200-day Daily Moving Average (DMA), a critical barometer for the long-term trend. What makes this setup particularly compelling is the subsequent price action: rather than a "fakeout," the stock returned to the 200 DMA to retest it as support. This successful retest and the stock's ability to sustain levels above this moving average confirm that the floor has shifted higher and buyers are aggressively defending the zone.
Building on this base, the price action has now delivered a beautiful descending trendline breakout on the daily chart. This breakout is accompanied by a noticeable uptick in volume, indicating that the period of sideways "cooling off" is likely over. With the RSI shifting into the bullish zone and price structure forming higher highs and higher lows, the stock has neutralized its previous corrective phase. Given the confluence of the 200 DMA support and the fresh trendline breach, the stock looks exceptionally well-positioned to be looked at for a strong upside move as it continues its primary bullish cycle.

Part 2 Intraday Institutional Trading StrategiesOption Buyer
Pays premium
Limited loss (only premium)
Unlimited profit potential
Needs movement quickly
Time decay works against them
Option Seller
Receives premium
Limited profit (premium only)
High probability of profit
Time decay works in their favor
Must manage risk properly (because losses can be large)

BRITANNIA 1 Month Time Frame 📍 Current Price & Range (approx)
Current share price around ₹5,800–₹5,900 (varies intraday) as of early Feb 2026.
1-month price action has seen modest pullbacks and minor swings around this zone.
📊 Key Levels to Watch (1-Month Timeframe)
🧱 Support Levels
These are price zones that may act as a floor if the stock corrects further:
Support 1: ~₹5,838 – immediate support region.
Support 2: ~₹5,790–₹5,800 — lower support cluster.
Support 3: ~₹5,720–₹5,760 — deeper short-term floor.
💡 If price dips below ₹5,720 with strong volume, it could signal a deeper correction.
🚧 Resistance Levels
These are upside barriers that may hold unless bullish momentum continues:
Resistance 1: ~₹5,944–₹5,950 — first upside hurdle.
Resistance 2: ~₹6,000–₹6,010 — psychological barrier near round number.
Resistance 3: ~₹6,050–₹6,060 — higher resistance level.
📈 Short-Term Trend Notes
Price has shown neutral/weak trend signals recently (mixed technical indicators around weekly charts).
Over last 1 month, price range has mostly stayed between ~₹5,780 and ~₹6,050 — a useful intraday/trading range.
🗓️ How to Use These Levels
Intraday traders: Watch pivot points around ₹5,880–₹5,900 with quick trades around support/resistance.
Swing traders: A breakout above ₹6,000 may signal bullish continuation; a break below ₹5,750 could mean short-term weakness.
Always pair key levels with volume and momentum indicators before placing trades.

XAUUSD cmp 5034 Key Levels to WatchGold (Spot) – Key Levels to Watch
Gold is facing strong supply in the 5040–5110 USD resistance zone. Repeated rejection from this area keeps the near term structure cautious.
Failure to sustain above 5110 USD may open downside towards 4650-4790 USD in short term.
On the upside, a decisive break and sustain above 5110 USD is required to resume bullish momentum towards 5383 USD
Volatility remains elevated due to global macro and rate expectations.
Best approach is to stick with levels, manage risk tightly and avoid emotional positioning.
This idea valid until the said levels.

CRUDE MCX FUTURE CRUDE POSSIBLE MOVE
RESISTANCE 6100, 6320
SUPPORT 5515, 5360
5515 below sustain or close invalidation
View is for education purpose only , we are not recommend any trade or investment
Always do your own analysis

Hidden Bearish Divergence appears on 30m Time frameI have marked a red resistance line on RSI on 30m time frame. Which is looks like a class B Bearish Divergence. If it loses the support box expect a swift drop toward $68K.

SBICARD 1 Month Time Frame 📌 Latest Price Context:
• Stock is trading around the mid ₹750-₹760 zone.
• It has recently tested 52-week lows near ₹725 and remains below key moving averages — a bearish technical structure in the very short term.
📊 1-Month Timeframe Key Levels (Support & Resistance)
🔻 Support Levels (Buy Zones)
S1: ~₹745–₹747 — immediate support zone for dips.
S2: ~₹735–₹738 — stronger support beneath the first fold.
S3: ~₹725–₹729 — major support near 52-week low; breaking below risks extra downside.
➡ A breakdown below ₹725 on monthly closes would be bearish.
📈 Resistance Levels (Targets / Sell Zones)
R1: ~₹762–₹763 — near the pivot/resistance in current 1-month profile.
R2: ~₹769–₹770 — resistance zone at recent short term swing highs.
R3: ~₹778–₹780+ — higher resistance – breakout above helps bullish recovery.
➡ Sustained closes above ~₹770–₹780 can shift short-term bias to neutral/bullish.
🔍 Trading Bias Guidance
📉 Bearish to Neutral if price stays below ₹762–₹770
📈 Bullish structure if breaks and holds above ₹770–₹780

Price Acceptance & Volume Distribution Study (PWL | 1H)Intraday Market Structure & Volume Profile Study (1H)
This idea presents an intraday market structure study of
PhysicsWallah Ltd. on the 1-hour timeframe, using Volume Profile
to analyze price acceptance and participation.
A Fixed Range Volume Profile has been applied from the onset of the
impulsive decline to the most recent hourly price action, allowing
observation of how value has evolved over time.
Key Observations:
1) A clearly defined value area (VAH–VAL) is visible, indicating
where the majority of intraday participation has occurred.
2) Price has repeatedly rotated within this value area across
multiple sessions, suggesting a balance phase rather than a
directional trend.
3) The Point of Control (POC) highlights the price level where the
highest concentration of trading activity took place, serving as
a reference for accepted value.
4) Attempts to move above the value area have shown limited
continuation, implying that supply remains active at higher
prices.
5) Recent price action is interacting with a previously tested
demand zone below value, where intraday risk becomes more clearly
defined.
Critical Structural Shift:
Price is currently trading below the Value Area Low (VAL).
This is not a neutral condition.
Trading outside value indicates rejection of previously accepted
prices and a shift from balance to imbalance.
As long as price remains below VAL, the market is not accepting
higher value and is actively exploring lower prices.
Any bullish assumption without re-acceptance back into value
remains structurally weak.

SHREECEM 1 Day Time Frame 📊 Daily Pivot & Key Levels (Most Accurate Today)
🔹 Pivot (Daily): ₹27,290 — central bias level (above = bullish, below = bearish)
🟢 Resistance Levels (Upside Targets)
R1: ₹27,480 — 1st resistance
R2: ₹27,735 — 2nd resistance
R3: ₹27,925 — 3rd resistance
If price breaks above R2/R3 with volume, look for continuation toward higher zones in short term.
🔴 Support Levels (Downside Safety Zones)
S1: ₹27,035 — 1st support
S2: ₹26,845 — 2nd support
S3: ₹26,590 — 3rd support
A break below S2/S3 could signal stronger bearish movement for the day.
📈 How to Use These Levels (1-Day View)
✔ Bullish daily bias: Price holds above pivot (₹27,290) and breaks R1 → R2 cleanly.
✔ Bearish daily bias: Price trades below pivot and breaks S1 → S2/S3 with momentum.
✔ Range condition: Price choppy between S1 ↔ R1 signifies consolidation.
🧠 Technical Context
Price is near short-term SMA/EMA levels — this adds confluence to the pivot and S/R ranges mentioned.
RSI/stochastic indicators are currently not extremely overbought/oversold, suggesting ranges or breakout plays are likely.

ELECTCAST – Consolidation Range - LongDisclaimer: This analysis is for educational purposes only. I am not a SEBI-registered advisor. Please consult your financial advisor before making investment decisions.
ELECTCAST – Consolidation Range
🎯 Targets
Target 1: ₹110+
Target 2: ₹130+
Target 3: ₹164+
Target 4: ₹194+
Target 5: ₹236+
Target 6: ₹300+
⚖️ Risk-Reward
Entry: ₹97-98
Stop Loss: ₹85 (Closing Basis)
Risk–Reward Ratio ≈ 1:16+
📌 Summary:
1. What is Consolidation?
On a daily time frame, consolidation happens when the price moves sideways in a range without clear direction.
Candles have relatively small bodies.
Price respects a support (bottom) and resistance (top) level.
Traders often call this a “box,” “range,” or “accumulation/distribution phase.”
👉 Example: A stock trades between ₹100 and ₹110 for several days or weeks.
Why it happens:
Buyers and sellers are in balance.
Market is “waiting” for new information before choosing a direction.
2. What is a Breakout?
A breakout occurs when price moves strongly outside the consolidation range with higher-than-normal volume.
Upside breakout: Price closes above resistance → potential bullish trend.
Downside breakout: Price closes below support → potential bearish trend.
👉 Example: After consolidating between ₹100–₹110, the stock closes at ₹112 with strong volume → breakout to the upside.
3. How Traders Use It
Entry signals: Traders often enter after a confirmed breakout.
Stop-loss placement: Below resistance (for upside breakout) or above support (for downside breakout).
Targets: Often measured using the height of the consolidation range.

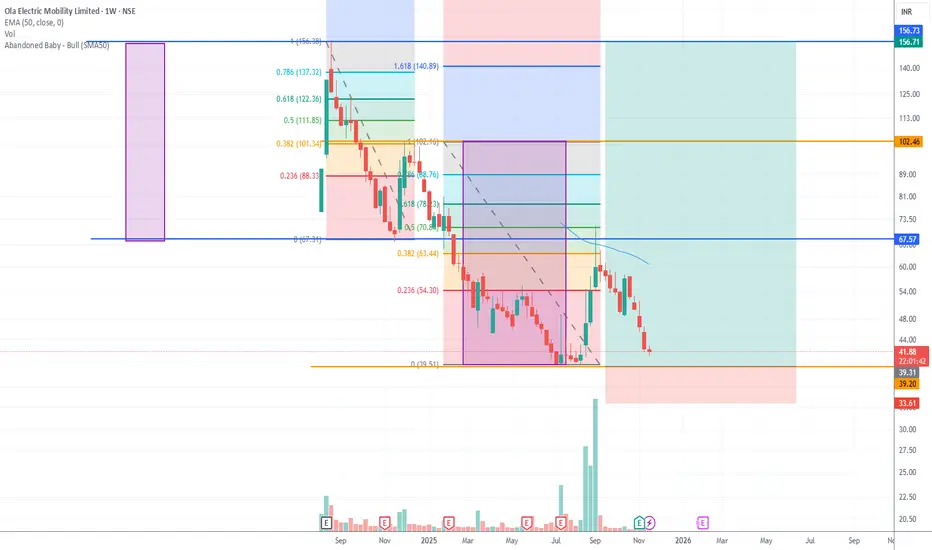
OLA ELEC – Weekly Analysis | Possible Double Bottom + Fibonacci Price Zone of Interest: ₹39–₹41
Stop-Loss (Weekly Close Basis): ₹34
Timeframe: Weekly
Bias: Potential Long Setup (High Risk, Technically Driven)
Entry / SL / Targets
🟢 Entry Zone (Accumulation Zone):
✔ ₹39–₹41
🔴 Stop-Loss (Strict Weekly Close):
✔ ₹34
Below this, the double-bottom pattern fails.
🎯 Potential Upside Targets:
T1: ₹54
T2: ₹63–64
T3: ₹70
T4: ₹78
Upside targets depend on weekly momentum and volume confirmation.
------------------------------
Key Technical Observations
1. Double Bottom Structure Forming
Price has returned to the strong demand zone around ₹39–₹41, which previously acted as a key swing low.
A double bottom is possible if the stock holds this level on a weekly closing basis.
A confirmed weekly reversal candle here increases the probability of a bounce.
------------------------------
Fibonacci Behavior (Weekly) – Pattern Repeating
When applying Fibonacci retracements on the previous weekly downswings:
1st Downtrend Retracement: Price reversed at the 0.382 level
2nd Downtrend Retracement: Price reversed at the 0.50 level
This shows that the stock has been respecting mid-Fibonacci retracements during corrective moves.
If a bounce starts from the same zone again, the next fib levels act as natural upside targets.
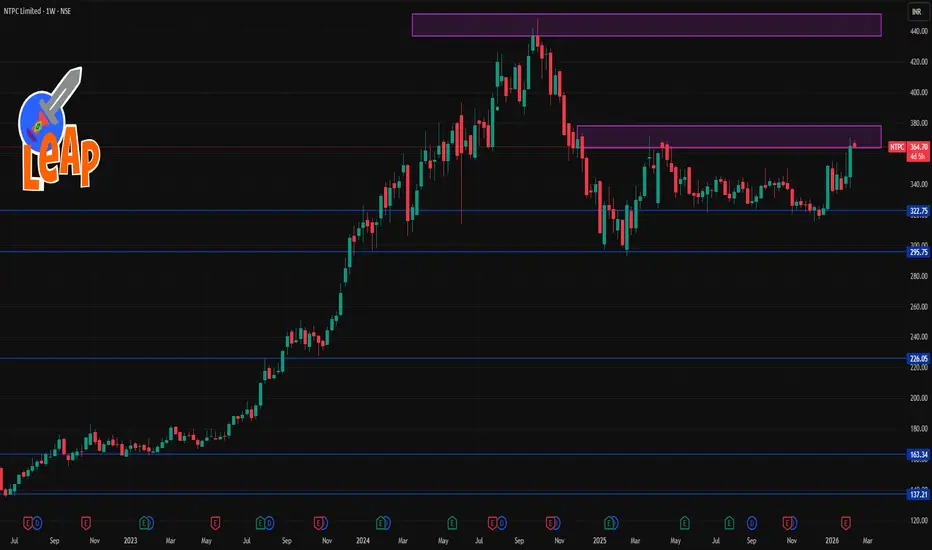
NTPC 1 Week Time Frame 📊 Current Approx Price Range
• Trading near ₹365–₹370 on the NSE this week.
📈 Weekly Resistance Levels (Upside)
• R1: ~₹378 – first reaction resistance this week
• R2: ~₹390 – secondary hurdle before fresh upside
• R3: ~₹410 – extended resistance if bulls dominate
• Fibonacci/Weekly Pivot R2–R3: ~₹390–₹411 area
📉 Weekly Support Levels (Downside)
• S1: ~₹345 – first major weekly support zone
• S2: ~₹325 – deeper support if S1 breaks
• S3: ~₹312 – last weekly structure support
• Weekly Pivot/Fib S1 area: ~₹324–₹345
📌 Weekly Pivot Approx Levels (from pivot calculations)
• Standard weekly pivots place pivot ~₹357–₹358, with support/resistance branching around it.
📊 Technical Signals (Weekly)
• Some platforms show a bullish/“strong buy” bias based on weekly indicators (moving averages & oscillators) — suggesting the trend is currently positive if the price holds above key supports.
Quick summary:
➡️ Bullish week if NTPC holds above ₹345 and breaks above ₹378–₹390.
➡️ Bearish pressure if weekly close slips below ₹345 → ₹325 → ₹312.
Oil India Ltd cmp 488 by Daily Chart viewOil India Ltd cmp 488 by Daily Chart view
- Support Zone 465 to 487 Price Band
- Resistance Zone 52 to 545 Price Band
- Support Zone tested retested for probable reversal
- Volumes spiking intermittently above average traded quantity
- Breakout from 1st Falling Resistance Trendline, 2nd Breakout anticipated
- Bullish Rounding Bottoms around Support Zone and by Resistance Zone neckline

De-Dollarization and Currency WarsA Global Power Shift in Motion
For more than seven decades, the US dollar has sat at the center of the global financial system. It dominates international trade, commodity pricing, foreign exchange reserves, cross-border lending, and global capital markets. This dominance has given the United States unmatched financial power—and the rest of the world a shared dependence. Today, however, that system is being challenged. Two closely linked phenomena are reshaping the monetary landscape: de-dollarization and currency wars. Together, they reflect rising geopolitical tension, shifting economic power, and a growing struggle for monetary sovereignty.
Understanding De-Dollarization
De-dollarization refers to the gradual reduction of reliance on the US dollar in global trade, reserves, finance, and payments. It does not mean the dollar will disappear overnight. Instead, it signals a slow, strategic effort by countries to diversify away from dollar dependence.
Historically, nations adopted the dollar because it was stable, liquid, trusted, and backed by deep US capital markets. Oil was priced in dollars, international debt was issued in dollars, and central banks held dollars as their primary reserve asset. Over time, this created a feedback loop: the more the dollar was used, the more powerful and indispensable it became.
However, this same system created vulnerabilities. Countries holding dollar reserves are exposed to US monetary policy, sanctions, interest-rate cycles, and financial regulations. As geopolitical risks rise, these vulnerabilities are no longer theoretical—they are strategic concerns.
Why De-Dollarization Is Accelerating
Several forces are driving the current push toward de-dollarization.
First is geopolitical weaponization of finance. US-led sanctions, asset freezes, and restrictions on dollar-based payment systems have shown that access to the dollar is not politically neutral. When nations see foreign reserves frozen or trade disrupted, the incentive to reduce exposure becomes urgent.
Second is shifting global economic power. Emerging economies—especially in Asia, the Middle East, and parts of Africa—now contribute a larger share of global growth. These countries want financial systems that reflect their economic weight rather than relying on a Western-centric monetary order.
Third is domestic monetary autonomy. Heavy dollar dependence can weaken local currencies and limit central bank flexibility. Countries facing dollar shortages during crises experience inflation spikes, capital flight, and financial instability.
Finally, technological change has lowered barriers. Digital payment systems, bilateral currency swap lines, local-currency trade agreements, and central bank digital currencies (CBDCs) are making alternatives to the dollar more viable.
How De-Dollarization Is Happening in Practice
De-dollarization is not a single action but a collection of gradual shifts.
Countries are settling bilateral trade in local currencies, bypassing the dollar. Energy, commodities, and manufactured goods are increasingly priced in non-dollar terms between willing partners.
Central banks are diversifying reserves, increasing allocations to gold, regional currencies, and non-US assets. Gold, in particular, has regained importance as a politically neutral reserve.
Regional payment systems are expanding to reduce reliance on dollar-based infrastructure. Currency swap agreements between central banks provide liquidity without touching the dollar.
Importantly, these changes are incremental, not revolutionary. The dollar remains dominant—but its monopoly is slowly eroding.
What Are Currency Wars?
A currency war occurs when countries deliberately weaken their currencies to gain economic advantages—usually to boost exports, attract capital, or manage debt burdens. Unlike traditional wars, currency wars are fought through interest rates, quantitative easing, capital controls, and verbal guidance rather than weapons.
Currency wars often emerge during periods of global economic stress, slow growth, or uneven recoveries. When one country weakens its currency, others feel pressured to respond to avoid losing competitiveness. This creates a cycle of retaliatory devaluations.
Tools Used in Currency Wars
Central banks have several tools to influence currency values.
Interest rate adjustments are the most direct. Lower rates reduce returns on assets, weakening the currency. Higher rates attract capital, strengthening it.
Quantitative easing increases money supply, often leading to currency depreciation.
Foreign exchange intervention involves direct buying or selling of currencies in the market.
Capital controls restrict money flows to manage volatility.
Even verbal signaling—statements by central bankers or finance ministers—can move currencies sharply.
These tools blur the line between domestic economic policy and international competition.
The Link Between De-Dollarization and Currency Wars
De-dollarization and currency wars are deeply interconnected.
As countries move away from the dollar, exchange rate management becomes more complex. Without the stabilizing anchor of dollar dominance, currencies become more sensitive to capital flows, trade balances, and policy divergence.
At the same time, de-dollarization reduces the effectiveness of US monetary transmission. This weakens the global role of the Federal Reserve and encourages regional monetary blocs—each managing its own currency priorities.
The result is a more fragmented monetary system, where competitive devaluations and policy conflicts become more frequent.
Implications for the Global Economy
For the global economy, these trends bring both opportunity and risk.
On the positive side, reduced dollar dependence can increase financial resilience, especially for emerging markets. It encourages regional cooperation and diversified trade relationships.
On the negative side, fragmentation reduces efficiency. Multiple settlement currencies increase transaction costs, reduce liquidity, and complicate risk management. Currency volatility rises, making global trade and investment more uncertain.
For commodities, pricing diversification weakens the traditional dollar-commodity inverse relationship. For debt markets, borrowing costs become more sensitive to local currency credibility.
Impact on Investors and Traders
For investors and traders, de-dollarization and currency wars reshape market dynamics.
Currency volatility increases, creating both risk and opportunity. Capital flows become more selective, rewarding countries with credible policy frameworks and punishing those with weak fundamentals.
Safe-haven assets evolve. Gold, select currencies, and real assets gain prominence alongside the dollar rather than beneath it.
Macro-driven trades—interest rate differentials, yield curves, and capital flow signals—become more important than pure technical patterns.
In short, macro awareness becomes edge, not optional knowledge.
The Future: Decline or Transformation?
The dollar is not collapsing. Its depth, liquidity, legal framework, and network effects remain unmatched. However, its absolute dominance is fading.
The future is likely a multipolar currency system, where the dollar remains the primary reserve but shares influence with regional and functional alternatives. Currency wars will not disappear; they will evolve into more subtle, policy-driven contests.
De-dollarization is not about replacing the dollar—it is about reducing vulnerability. Currency wars are not accidents—they are symptoms of a world adjusting to new power realities.
Bottom Line
De-dollarization and currency wars reflect a world in transition. They reveal the tension between global integration and national sovereignty, between stability and control. For policymakers, the challenge is balance. For investors and traders, the opportunity lies in understanding these shifts early—because money, ultimately, follows power.

Global Economy Fluctuation Effects1. Impact on Economic Growth and Output
One of the most direct effects of global economic fluctuations is on overall economic growth. During global expansions, increased demand, investment, and trade boost production across countries. Firms expand capacity, governments collect higher tax revenues, and consumers enjoy rising incomes.
Conversely, during global downturns or recessions, growth slows or turns negative. Reduced consumer spending, declining investments, and falling exports cause output contractions. Since economies are interconnected through trade and finance, a slowdown in major economies like the United States, China, or the European Union can quickly drag down growth in emerging and developing countries.
Fluctuations also affect long-term growth potential. Prolonged downturns may lead to underinvestment in infrastructure, education, and technology, reducing future productivity and economic resilience.
2. Employment and Labor Markets
Global economic fluctuations significantly influence employment levels and labor market conditions. In periods of global growth, businesses hire more workers to meet rising demand. Wages may rise, job security improves, and informal employment often declines.
However, during global economic contractions, unemployment increases. Companies reduce costs through layoffs, hiring freezes, or wage cuts. Export-oriented sectors such as manufacturing, tourism, and logistics are particularly vulnerable. Developing economies often experience sharper job losses due to limited social safety nets and higher dependence on global demand.
Additionally, fluctuations can alter labor migration patterns. Economic downturns in host countries reduce opportunities for migrant workers, affecting remittances that many developing nations rely on for income stability.
3. Trade and Supply Chain Disruptions
Global economic fluctuations strongly affect international trade. During economic expansions, higher consumption and investment increase demand for imports and exports, strengthening global trade flows. Countries specializing in commodities, manufacturing, or services benefit from higher volumes and better prices.
In contrast, economic downturns reduce trade volumes as demand weakens. Protectionist measures may increase as governments attempt to shield domestic industries, further disrupting global trade. Supply chains, especially those spread across multiple countries, become vulnerable to demand shocks, currency volatility, and logistical bottlenecks.
Recent global events have shown how economic uncertainty can accelerate shifts toward supply chain diversification, near-shoring, and regionalization, reshaping global trade dynamics.
4. Financial Markets and Capital Flows
Financial markets are highly sensitive to global economic fluctuations. During periods of optimism and growth, capital flows freely across borders in search of higher returns. Equity markets rise, bond yields stabilize, and currencies of emerging markets often strengthen due to foreign investment inflows.
During periods of global uncertainty or recession, financial markets tend to become volatile. Investors shift toward safe-haven assets such as gold, U.S. Treasury bonds, or stable currencies. Capital often flows out of emerging markets, leading to currency depreciation, higher borrowing costs, and financial instability.
These fluctuations can trigger banking stress, liquidity shortages, and debt crises, particularly in countries with high external debt or weak financial systems.
5. Inflation, Deflation, and Price Stability
Global economic fluctuations also affect inflation dynamics. During strong global growth, increased demand for goods, services, and commodities can push prices higher, leading to inflationary pressures. Energy and food prices are especially sensitive to global demand cycles.
On the other hand, during economic slowdowns, weak demand may lead to deflation or disinflation. Falling prices can discourage spending and investment, further deepening economic contractions. Deflation is particularly dangerous as it increases the real value of debt and can trap economies in prolonged stagnation.
Central banks play a critical role in managing these effects through interest rate adjustments, liquidity measures, and monetary policy interventions.
6. Government Finances and Public Policy
Global economic fluctuations have major implications for government finances. During expansions, higher tax revenues and lower unemployment benefits improve fiscal balances. Governments have more room to invest in infrastructure, healthcare, and social programs.
During downturns, fiscal pressures intensify. Tax revenues decline while public spending on welfare, subsidies, and stimulus programs increases. This often leads to higher budget deficits and rising public debt.
Policymakers must balance short-term stabilization measures with long-term fiscal sustainability. Poorly managed responses can worsen economic instability, while timely and targeted policies can reduce the severity of downturns.
7. Effects on Developing and Emerging Economies
Developing and emerging economies are often more vulnerable to global economic fluctuations. Many depend heavily on commodity exports, foreign investment, and external financing. When global demand weakens, commodity prices fall, export revenues decline, and currencies depreciate.
These economies may also face reduced access to global capital during crises, forcing them to cut spending or seek external assistance. Social consequences such as poverty, inequality, and food insecurity tend to worsen during global downturns.
However, some emerging economies benefit during global recoveries by attracting investment, expanding exports, and integrating further into global value chains.
8. Social and Inequality Effects
Economic fluctuations have profound social consequences. Global downturns disproportionately affect low-income groups, informal workers, and small businesses. Job losses, reduced incomes, and rising living costs can increase inequality within and between countries.
Access to education, healthcare, and nutrition often deteriorates during economic crises, particularly in developing nations. Over time, repeated economic shocks can weaken social cohesion and trust in institutions.
In contrast, sustained global growth can improve living standards, reduce poverty, and expand opportunities—provided growth is inclusive and well-managed.
9. Geopolitical and Strategic Implications
Global economic fluctuations can reshape geopolitical dynamics. Economic stress may fuel political instability, nationalism, and trade disputes. Countries facing prolonged downturns may reassess alliances, economic models, and strategic priorities.
Economic power shifts during periods of growth or stagnation can alter global influence, leading to changes in leadership within international institutions and global governance structures.
Conclusion
Global economic fluctuations are inevitable, but their effects are far-reaching and multifaceted. They influence growth, employment, trade, financial stability, government finances, and social well-being across nations. In an interconnected world, no country is fully insulated from global economic shifts.
Effective policy coordination, diversified economies, resilient financial systems, and inclusive growth strategies are essential to managing these fluctuations. By understanding the effects of global economic cycles, nations and stakeholders can better prepare for risks, seize opportunities, and promote long-term economic stability in an ever-changing global landscape.

Global Market Meltdown CrisisWhat Is a Global Market Meltdown?
A global market meltdown occurs when multiple asset classes—equities, bonds, commodities, currencies, and derivatives—decline simultaneously across major economies. Unlike normal corrections or bear markets, a meltdown is characterized by panic selling, forced liquidations, and contagion effects that spread rapidly from one market or region to another.
Key features include:
Sudden and steep fall in stock indices worldwide
Freezing of credit and money markets
Sharp rise in volatility indicators
Collapse in investor and consumer confidence
Emergency intervention by central banks and governments
Root Causes of Global Market Meltdowns
1. Excessive Leverage and Debt
One of the most common drivers of market crises is excessive leverage. When corporations, households, banks, or governments take on too much debt during boom periods, the system becomes fragile. Even a small shock—rising interest rates, slowing growth, or asset price decline—can trigger widespread defaults and forced selling.
The 2008 global financial crisis is a classic example, where high leverage in housing finance and derivatives magnified losses across the system.
2. Asset Bubbles
Prolonged periods of easy money and optimism often lead to asset bubbles. Stocks, real estate, cryptocurrencies, or commodities become detached from their fundamental value. When reality sets in—through earnings disappointments, tighter monetary policy, or external shocks—the bubble bursts, leading to violent market corrections.
3. Monetary Policy Shocks
Aggressive interest rate hikes, sudden withdrawal of liquidity, or miscommunication by central banks can destabilize markets. When markets are addicted to low interest rates and cheap liquidity, policy tightening can expose hidden weaknesses in financial structures.
4. Geopolitical and Global Shocks
Wars, trade conflicts, pandemics, and geopolitical tensions can instantly disrupt supply chains, capital flows, and investor sentiment. The COVID-19 pandemic triggered one of the fastest global market crashes in history, as uncertainty overwhelmed all risk models.
5. Financial System Fragility
Weak banking systems, poorly regulated shadow banking, and opaque derivatives markets amplify crises. When trust in financial institutions erodes, liquidity dries up and markets seize.
How a Global Market Meltdown Unfolds
Phase 1: Complacency and Euphoria
Markets rise steadily, volatility stays low, and risk-taking increases. Investors assume central banks or governments will always step in to prevent major losses. Warning signs—rising debt, overvaluation, narrowing market breadth—are ignored.
Phase 2: Trigger Event
A catalyst appears: an interest rate shock, corporate default, geopolitical conflict, or unexpected economic data. Initially, markets react mildly, but cracks begin to show.
Phase 3: Panic and Contagion
Selling accelerates as leveraged players are forced to liquidate positions. Margin calls amplify losses. What begins in one asset class spreads to others. Correlations rise, diversification fails, and “safe assets” are sold to raise cash.
Phase 4: Liquidity Crisis
Bid-ask spreads widen, trading halts occur, and even high-quality assets become difficult to sell. Credit markets freeze as lenders lose confidence. This phase is the most dangerous because it threatens the functioning of the financial system itself.
Phase 5: Policy Intervention
Central banks inject liquidity, cut interest rates, restart quantitative easing, and act as lenders of last resort. Governments announce stimulus packages, guarantees, and bailouts. Markets may stabilize, but confidence takes time to recover.
Economic and Social Impact
Impact on Economies
A global market meltdown often leads to recessions or depressions. Investment slows, unemployment rises, consumer spending falls, and global trade contracts. Emerging markets suffer capital outflows and currency depreciation, making debt repayment harder.
Impact on Corporations
Companies face higher borrowing costs, declining revenues, and restricted access to capital. Weak firms go bankrupt, while even strong firms delay expansion and hiring.
Impact on Households
Household wealth declines due to falling stock and property prices. Pension funds and retirement savings take hits. Job insecurity and inflationary pressures can erode living standards.
Impact on Governments
Tax revenues fall while social spending rises, worsening fiscal deficits. Governments may be forced to borrow heavily, increasing long-term debt burdens.
Role of Central Banks and Governments
During a meltdown, policymakers play a critical role in preventing systemic collapse. Central banks provide emergency liquidity, stabilize currency markets, and reassure investors. Governments implement fiscal stimulus, support vulnerable sectors, and protect employment.
However, these interventions come with long-term costs: higher public debt, moral hazard, and potential inflation. Repeated rescues can encourage excessive risk-taking in future cycles.
Lessons from Past Global Market Crises
Markets Are Cyclical
Booms and busts are inherent to financial systems. Ignoring risk during good times makes crises worse.
Leverage Is the Real Enemy
High leverage turns normal downturns into systemic disasters.
Liquidity Is an Illusion
Liquidity disappears when it is needed most. Risk management must account for extreme scenarios.
Diversification Has Limits
In global crises, correlations rise and traditional diversification strategies can fail.
Confidence Matters More Than Valuation
During meltdowns, fear overrides fundamentals. Markets can remain irrational longer than expected.
Conclusion
A global market meltdown crisis is not just a financial event—it is a stress test for the entire global economic and political system. While triggers may vary, the underlying causes often remain the same: excessive debt, mispriced risk, policy missteps, and human psychology driven by greed and fear. Understanding how such crises develop and propagate is essential for investors, policymakers, and institutions alike. While market meltdowns cannot be eliminated, their impact can be reduced through prudent risk management, stronger regulation, disciplined policy frameworks, and a clear recognition that stability during booms is just as important as rescue during busts.

Currency Pegs and Exchange RatesHow Nations Control Their Money’s Value
Currencies are not just pieces of paper or digital numbers—they are tools of economic power. Every country must decide how much control it wants over its currency’s value, and that decision shapes inflation, trade competitiveness, capital flows, and financial stability. At the heart of this choice lies the concept of exchange rate regimes, with currency pegs being one of the most important and controversial systems.
What Is an Exchange Rate?
An exchange rate is the price of one country’s currency expressed in another currency. For example, if 1 USD equals 83 INR, that is the exchange rate between the US dollar and the Indian rupee. Exchange rates affect imports, exports, foreign investment, debt servicing, and even domestic inflation.
Countries manage exchange rates in different ways depending on their economic goals, institutional strength, and exposure to global markets.
Types of Exchange Rate Regimes
Broadly, exchange rate systems fall into three categories:
Floating exchange rate
Fixed exchange rate (currency peg)
Managed float (hybrid system)
Among these, currency pegs represent the strongest form of control.
What Is a Currency Peg?
A currency peg is a system where a country fixes its currency’s value to another currency (or a basket of currencies). The most common anchor currencies are the US dollar, euro, or gold (historically).
For example:
Hong Kong dollar is pegged to the US dollar
Saudi riyal is pegged to the US dollar
Danish krone is pegged to the euro
In a peg system, the central bank commits to maintaining a fixed exchange rate—say, 1 local currency = 0.27 USD—and intervenes in foreign exchange markets to defend that level.
How a Currency Peg Works
To maintain a peg, a central bank must be ready to buy or sell foreign currency reserves at any time.
If the local currency weakens, the central bank sells foreign reserves (like USD) and buys its own currency.
If the local currency strengthens too much, the central bank prints local currency and buys foreign assets.
This constant intervention requires large foreign exchange reserves, strong credibility, and disciplined monetary policy.
Types of Currency Pegs
1. Hard Peg
A hard peg allows almost no fluctuation. Examples include:
Currency boards
Dollarized economies (e.g., Panama using USD)
Hard pegs offer stability but eliminate independent monetary policy.
2. Soft Peg
A soft peg allows limited movement within a narrow band. The currency may fluctuate ±1–2% around the target rate.
3. Basket Peg
Instead of pegging to a single currency, the currency is linked to a basket of major currencies (USD, EUR, JPY, etc.). This reduces dependence on one economy.
Why Countries Choose Currency Pegs
1. Exchange Rate Stability
Pegged currencies reduce volatility, making trade and investment more predictable. This is especially useful for small, open economies dependent on imports or exports.
2. Inflation Control
By pegging to a low-inflation currency like the US dollar, a country can import monetary discipline and anchor inflation expectations.
3. Trade Promotion
A stable exchange rate lowers currency risk for exporters and importers, boosting cross-border trade.
4. Financial Credibility
For developing economies, a peg can signal commitment to stability and attract foreign capital.
Costs and Risks of Currency Pegs
While pegs offer stability, they come with serious trade-offs.
1. Loss of Monetary Policy Independence
The central bank cannot freely set interest rates. It must align policy with the anchor currency, even if domestic conditions differ.
2. Vulnerability to Speculative Attacks
If markets believe the peg is unsustainable, speculators may bet against it, forcing massive reserve losses. Famous examples include:
UK pound crisis (1992)
Thai baht collapse (1997)
3. Reserve Drain
Defending a peg during capital outflows can rapidly deplete foreign exchange reserves.
4. Misaligned Currency Value
If the peg is set too high, exports suffer. If too low, inflation rises. Over time, economic fundamentals may diverge from the peg.
Pegs vs Floating Exchange Rates
Floating Exchange Rates
In a floating system, currency value is determined by market forces—supply and demand. Countries like the US, Japan, and India follow this approach.
Advantages:
Independent monetary policy
Automatic adjustment to shocks
No need for large reserves
Disadvantages:
Higher volatility
Exchange rate uncertainty
Potential for sharp depreciations
Managed Float: The Middle Path
Many countries operate a managed float, also called a dirty float. Here, the currency mostly floats but the central bank intervenes occasionally to prevent extreme volatility.
India is a classic example. The Reserve Bank of India does not fix the rupee but actively intervenes to smooth excessive movements.
This system offers:
Flexibility
Partial stability
Policy autonomy
Currency Pegs in the Modern Global Economy
In today’s interconnected world, currency pegs are under constant pressure from:
Capital mobility
Algorithmic trading
Global interest rate cycles
Geopolitical shocks
Strong pegs survive only when supported by:
Massive reserves
Fiscal discipline
Political stability
Credible institutions
Countries without these foundations often abandon pegs during crises.
Lessons from History
History shows that currency pegs work best in calm times and break during stress. Pegs are not permanent guarantees; they are policy choices that must evolve with economic reality.
Successful pegs require:
Economic alignment with the anchor country
Willingness to accept policy constraints
Readiness to absorb external shocks
Conclusion
Currency pegs and exchange rate regimes are not just technical monetary choices—they are reflections of a country’s economic philosophy and risk tolerance. Pegs offer stability, discipline, and predictability, but at the cost of flexibility and independence. Floating systems offer freedom but demand strong institutions and market confidence.
For traders, investors, and policymakers, understanding currency pegs is essential because when pegs hold, markets are calm—but when pegs break, financial history is made.

Gold Breaks Falling Resistance– Structure Shift Signals PossibleGold has finally broken above the falling resistance trendline, and more importantly, the market structure has flipped. This is the key reason why breakout trades start working better after long corrections.
Earlier, price was respecting the falling trendline, but once sellers failed to push it lower, buyers stepped in with strength. The breakout candle shows a clear momentum shift, and price is now holding above the previous resistance area.
This zone is important. As long as price stays above it, the bias remains bullish, and the upside continuation zone becomes active. Pullbacks into this area are not weakness, they are retests.
However, if price fails to hold below the marked risk zone, the breakout idea gets invalidated. Until then, the structure favors buyers.
Strong trends don’t reverse instantly, they pause, flip structure, and then continue.
What I’m Watching now on chart:
Breakout Level: Falling resistance trendline
Bullish Sign: Strong close and hold above breakout
Upside Zone: Green highlighted area
Risk Area: Below the red zone
Rahul’s Insight:
Most traders chase breakouts too early. The real edge comes when structure flips and holds, not just when a line breaks.
Disclaimer :This analysis is for educational purposes only and should not be considered financial advice. Markets involve risk. Please do your own analysis and manage risk properly before taking any trade.

mcx gold update weekly forecastmcx gold eyes on 161000 if market sustain above or close above than will see 167--171000 or above 173000 see 185000++++ soon where support find 154000--154500 if hold below than down side 152--151000 possible rock hard hurdle 147--146000 if close below than down side 141--139--135000++. that's wide range of gold
