Bank Nifty Target 69000 for upcoming Year 69000 Namaskaram Investor
This is a long Term forecast, in which we will discuss about the furture for bank nifty in upcoming months. Off course all the explanation will be give in the video, So kindly watch that to understand my view. It will be available after an hour.
X-indicator

BBTC - Strong Bullish Momentum Breakout
💹 Bombay Burmah Trading Corp. Ltd (NSE: BBTC)
Sector: Diversified Holdings | CMP: 2022.70 | View: Strong Bullish Momentum Breakout
Chart Pattern: Falling Channel Breakout
Candlestick Pattern: Three Inside Up
Swing High: 2074
Swing Low: 1740
STWP Trade Analysis:
Breakout Entry: 2048
Stop Loss: 1816
Momentum: Very Strong
Volume: Exceptional institutional surge
The candle shows dominance from bulls with a surge above recent range, supported by fresh volume expansion and a clear shift in trend behaviour.
Resistances:
2099.47 | 2176.23 | 2304.47
Supports:
1894.47 | 1766.23 | 1689.47
STWP Stock Analysis:
Final Outlook:
Momentum: Strong | Trend: Bullish Developing | Risk: Moderate | Volume: Very High
BBTC has delivered a high-conviction breakout, with an explosive volume spike that clearly signals institutional participation. The strong bullish candle has invalidated prior downside pressure and pushed the stock above its short-term resistance band. The price action has reclaimed short-term averages and is moving away from the lower accumulation zone, supported by RSI stabilizing near the balanced zone, MACD attempting a recovery crossover, and Stochastic signalling early momentum buildup.
The VCP dashboard shows no active contractions but confirms volume dry-up previously, suggesting that the breakout candle represents the first expansion leg after consolidation. Volume today is unusually high, indicating ignition strength and potential start of a trend reversal from the recent downtrend.
Multiple confluences — 52-week volume breakout, EMA compression easing, Bullish Supertrend trigger, RSI rebound, and strong volume footprint — reinforce the improving momentum structure. Sustaining above 1894–1900 keeps the bullish bias intact and opens the path toward upper resistance zones at 2099 → 2176 → 2304.
Overall, BBTC now stands in a bullish reversal phase, driven by strong volume, improving indicators, and a clean breakout structure that favours continuation if the stock holds above its demand supports.
⚠️ Disclosure & Disclaimer – Please Read Carefully
The information shared here is purely for learning and educational purposes. It is not investment advice or a recommendation.
I am not a SEBI-registered advisor. All observations are based on charts, technical structures, and publicly available data.
Market trading involves significant risk. Please consult a SEBI-registered financial advisor before acting on any idea.
Position Status: No active position in BBTC at the time of analysis.
Data Source: TradingView & NSE India (Past Chart Reference).
💬 Found this useful?
🔼 Boost this post to support structured learning
✍️ Drop your thoughts or questions in the comments
🔁 Share with traders who benefit from clean technical studies
👉 Follow for disciplined, structured, STWP-style analysis.
🚀 Stay Calm. Stay Clean. Trade With Patience.
Trade Smart | Learn Zones | Be Self-Reliant 📊

Carysil Weekly TA analysisTechnical Chart Update (For Educational Purpose Only)
Disclaimer: This is not investment advice or a buy/sell recommendation. Please consult your SEBI-registered advisor before making any financial decisions.
Observation :
• Formed Inverted Head & Shoulders pattern
• Trendline breakout observed
• Momentum buildup is possible if price sustains above breakout levels
Market conditions may change; trade with caution.

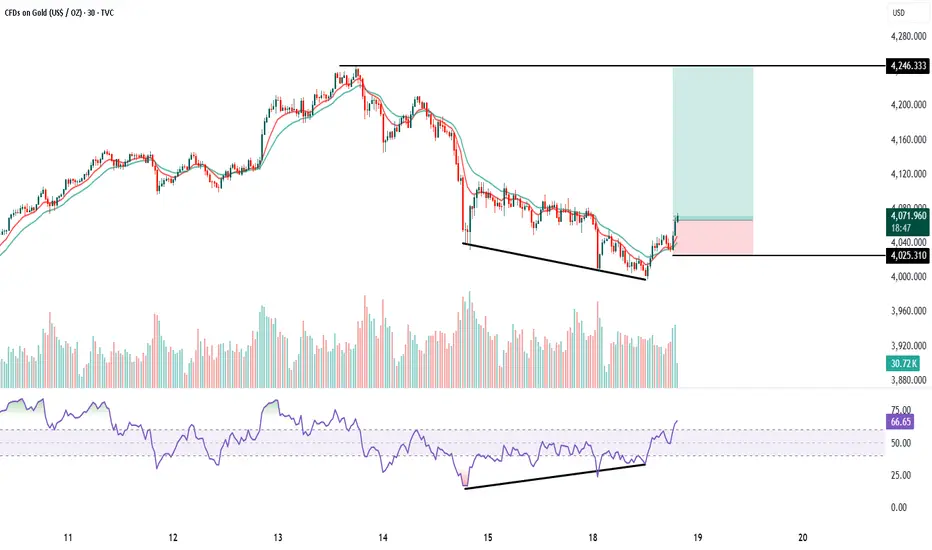
GOLD 30 Min chart analysis1. Trend : Price was in a downtrend with continuous lower highs and lower lows. Now the chart is showing a falling wedge pattern, which is a bullish reversal pattern. Breakout candle is visible with strength, indicating trend reversal from bearish to bullish on the 30-minute timeframe.
2. Volumes: Volumes remained average during the fall.
At the breakout zone, you can see volume expansion, which confirms buyers are stepping in.
This supports a valid bullish breakout.
3. Momentum (Price Action + EMAs): Price is crossing above the 10 EMA and 20 EMA, and both EMAs are starting to turn upward. This shows momentum shift from sellers to buyers. Momentum candles at breakout confirm the start of an upward move.
4. RSI Divergence: Price made lower lows, but RSI made higher lows.
This is a classic bullish divergence, indicating selling pressure is weakening. RSI has now moved above 60, confirming momentum is picking up strongly.
Buy above 4075 after the breakout candle closes above falling wedge.
This ensures confirmation and avoids a false breakout.
Keep SL just below wedge support: SL = 4025
Target : The major horizontal resistance shown on the chart is:
Target = 4246 This is also the measured move of the wedge, matching the resistance zone.
Risk–Reward: RR is approximately 1:3 to 1:3.5, which is ideal for breakout trades. This is a high-probability trend-reversal breakout setup with a clear target and safe stop loss.
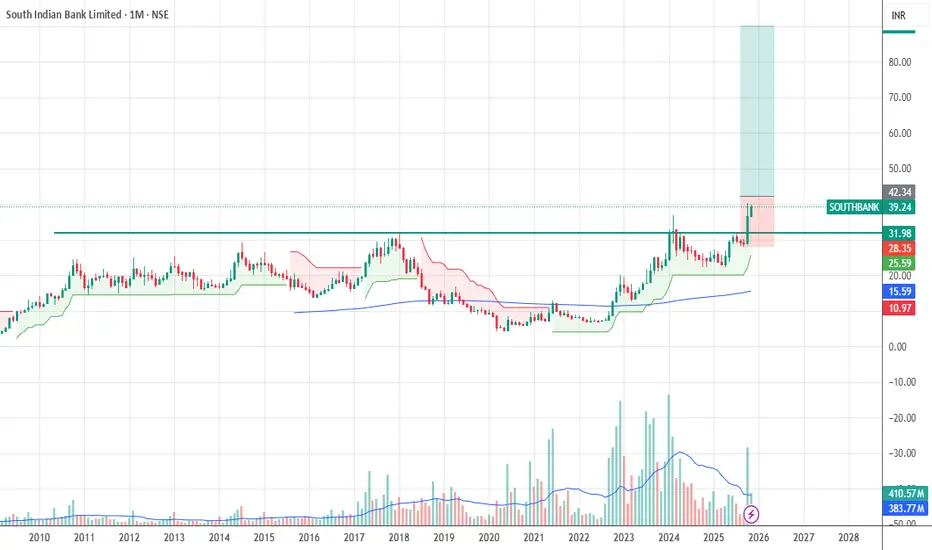
TECHNICAL VIEW: SOUTH INDIAN BANK MULTIYEAR BREAKOUT South Indian bank broke 1-1-2018 high on 1-10-25 weekly charts. Banks sector are outperforming nifty. And bank sector is also performing good.
FII and DII participation increased in September quarter.
Current Market Structure & Key Observations Previous Trend: The Current Market Structure & Key Observations
Previous Trend: The chart shows a strong uptrend from late October, peaking around November 14th at approximately $4,400. This peak marked a significant reversal.
Correction/Reversal: Since the peak, the price has undergone a sharp downward correction or potential reversal.
Trendline Interaction: The price has recently fallen to and is currently interacting with a major long-term ascending trendline (the solid black line).
Current Price: The price is hovering right at the trendline, indicated by the dashed pink line at approximately $4,034.
Analysis of the Projected Path (Red Lines)
The red lines drawn on the chart suggest a specific bearish scenario:
Trendline Break and Retest: The price is shown to break below the ascending trendline. This is a critical technical signal, often indicating the end of the uptrend and the start of a downtrend.
Pullback/Retest: The price then executes a pullback back up to the broken trendline (now acting as a resistance level). The projected high for this pullback is around $4,060.
Bearish Continuation: After failing to break back above the trendline, the price is projected to continue its decline, heading towards the area of $3,900 and then possibly $3,850 in the following days.
Potential Scenarios (Alternative View)
While the red lines illustrate a clear bearish path, it's important to consider an alternative:
Scenario 1: Bearish Continuation (As Projected)
Action: If the price confirms a breakout below the trendline (closes below it on multiple candles), the trendline turns into resistance.
Target: The focus shifts to lower support levels, with initial targets around $3,900 - $3,850. This confirms the end of the recent uptrend.
Scenario 2: Trendline Hold/Bounce
Action: If the trendline acts as strong support and the price fails to close significantly below it, it could lead to a bounce.
Target: A bounce would target the previous swing high before the major drop, potentially aiming back toward $4,150. This would maintain the longer-term bullish structure.

Gold direction today November 17📊 Support – Resistance – Fibonacci Analysis
1. Trend Overview
Price has broken below the ascending channel, signaling a shift into a corrective downtrend phase.
2. Key Resistance Zone
4,215 – 4,230
Confluence of Fibonacci retracement 0.5 – 0.618
Overlaps with a supply zone + EMA89
→ Strong resistance, high probability of selling pressure.
This is also the expected pullback/retest area before the next bearish leg.
3. Key Support Levels
Support 1 – 4,000
Fibonacci extension 0.5
Horizontal support
→ Likely to generate a short-term reaction.
Support 2 – 3,890
Major downside target if the structure fully breaks
→ Primary bearish target for a deeper continuation.
4. Price Scenario
Price may pull back toward 4,215 – 4,230.
BUY GOLD : 4000 - 3997
Stoploss : 3987
Take Profit : 100-300-500pips
SELL GOLD : 4212 - 4215
Stoploss : 4225
Take Profit : 100-300-500pips

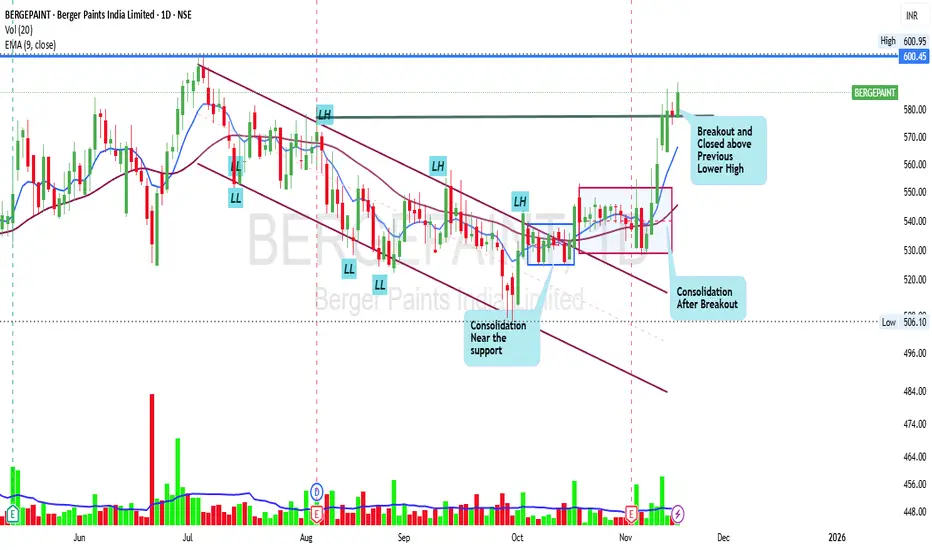
BERGER PAINTS – Technical Breakout UpdateBERGER PAINTS – Technical Breakout Update
Pattern: Falling Wedge + Consolidation near support
Breakout: Price closed above previous Lower High (trend reversal confirmed)
Conviction:
Structure shift (CHoCH)
EMAs turned bullish
Strong breakout candle with volume
Consolidation after breakout shows strength
Target Setup
Entry: CMP / Retest near ₹548–552
Stop Loss: ₹532
Targets: ₹578 / ₹600 / ₹612
Risk–Reward: 1 : 3
Disclaimer:
For educational purpose only. Not a buy/sell recommendation. Trade with proper risk management.
Banknifty Successful Breakout ?While the index seems to have given a breakout above the resistnce (hurlde trendline) but the volume breakout seems to be missing for now. Also there was a fakeout earlier in the month of June 2025, so a fear of it's repitition of the same can't be ignored.

BUY AGAIN BREAKOUT TREND LINE🕯SELL GOLD: 4018- 4015
⚠️ SL: 4015
✔️ TP: 4024→ 4030→3934( 60- 170 pips)
The 4018–4015 zone has just been broken, and with the temporary bearish structure on M15 also violated, there is a high probability that price will pull back and retest this zone.
If that happens, we’ll have a beautiful and technically clean BUY pullback opportunity aligned with the post-breakout structure.
📌 Notes:
This is a BUY pullback setup based on the M15 break of structure
Only BUY with clear candle confirmation
Small lot size + tight SL for safety
I’ll update again when price approaches the retest zone. 🔔🔥

Part 1 Ride The Big Moves Smart Practices for Successful Option Traders
Trade with a plan and proper risk management.
Avoid overtrading and gambling behaviour.
Understand Greeks and volatility.
Prefer spreads over naked buying.
For sellers, always hedge positions.
Gradually move to advanced strategies after mastering basics.

PGEL LONGAfter a good PGEL has been consolidating for 5 Months now. It may now come out of consolidation. Check the chart for the breakout level.
Entry- 580-586
Target- 640, 660, 680
SL- 550.
Disclaimer- This is just for educational purpose only.
JAI SHREE RAM.

OVERVIEW FOR TODAY - CHART H1 OVERVIEW
Price is currently sitting inside the POC zone – the area with the highest traded volume → the market usually consolidates here before choosing a direction.
Prior trend: Strong uptrend → distribution → correction.
The ascending trendline has been broken → short-term trend is bearish (downtrend).
Volume Profile shows the VAH above as strong resistance, and VAL below as strong support.
1: Price bounces from POC → moves up toward VAH (medium probability)
Conditions:
Price holds above the POC zone (~4000–4010).
Bullish price action appears (pin bar, engulfing, break of structure on H4).
Targets:
4120–4160 (VAH zone) → this is major resistance.
If VAH breaks → trend may resume upward with a larger target around 4300+.
Assessment:
Possible, but not the highest probability, because recent bearish momentum is still strong.
2: Price breaks below POC → retest → drops to VAL (HIGHEST PROBABILITY)
Current candles show strong rejection from VAH → falling directly into POC → bearish confirmation.
If D1 closes below the POC:
Bearish continuation becomes likely.
Targets:
3920–3950 (VAL zone) → very strong support.
Volume Profile thins out here → price tends to move quickly through this area.
Assessment:
This is the most likely scenario because:
✔ Trendline is broken.
✔ Weak bullish reaction at VAH.
✔ Volume Profile structure favors a move downward into VAL.
3: Price breaks below VAL → deeper drop toward Demand zone (low probability but dangerous)
Conditions:
D1 closes below 3920 (VAL)
Breaks the horizontal support.
Deep Targets:
3550–3600 (major Demand zone).
This is where the longer-term uptrend may recover.
Assessment:
Low probability, but if triggered → gold will make a sharp correction.
FINAL CONCLUSION
Highest probability: BEARISH continuation → drop toward VAL zone (3920–3950)
Because:
Strong rejection from VAH
Price sitting weakly on POC
Short-term structure turning bearish
[bTrading Suggestions
For short setups:
Look to sell on a retest of POC (4000–4010).
SL above VAH (4060–4080).
TP at VAL.
For long setups:
Only buy at VAL zone when clear reversals appear (pin bar, engulfing).
Avoid buying between POC → VAL.
⚠️ Disclaimer
All analyses and insights provided in this content are for informational purposes only and should not be considered financial advice. The financial market carries inherent risks, and every trader is fully responsible for their own decisions. Trade with a plan, discipline, and proper risk management.

Pressured Below 4050$ as Bears Target the 4,000$ Liquidity BreakGold continues to trade under heavy selling pressure, staying capped beneath 4,050$ and hovering just above the major liquidity floor at 4,000$.
With fading expectations for a December Fed cut and cautious global sentiment, buyers remain defensive while sellers maintain structural control.
📊 Technical Outlook (H1)
Price remains inside a tight 4,053$ → 4,000$ distribution zone, with the descending trendline keeping gold suppressed.
The POC around 4,053$ is acting as a firm ceiling; every retest so far has been rejected.
Fibonacci projections from the last drop highlight two major downside liquidity zones:
3,945$ → first liquidity cluster
3,876$ → deeper extension and key demand
Current structure resembles a bear flag, hinting that the market may be preparing for another downside expansion.
🎯 Key Scenarios
1️⃣ Bearish Breakdown (Primary Scenario)
If gold loses 4,000$, expect momentum to accelerate into:
3,945$
3,876$
This remains the most probable path while price holds below 4,053$.
2️⃣ Liquidity Sweep → Short-Covering Bounce
If price sweeps 3,945$ and forms bullish rejection wicks:
A relief bounce could develop back toward 4,000$,
Then 4,053$ (POC)
And possibly 4,098$ if buyers gain traction.
Still a corrective move unless bulls reclaim the upper structure.
❌ Invalidation (Bearish Bias Weakens)
H4 acceptance above 4,098$
→ would shift the narrative and force a reassessment of trend direction.
⚜️ MMFLOW TRADING Insight
Gold is still trading below value and below the trendline — this is not a bullish environment yet.
The market must either break 4,000$ or reclaim 4,053$–4,098$ before any stronger directional conviction returns.
“Let the market show its hand. In a downtrend, weak rallies are opportunities — not reversals.”

BEL 1 Day Time Frame 🔍 Current Context
The last quoted price for BEL was around ₹424.55 on the NSE.
The recent day-range (low to high) is approx ₹424.20 to ₹429.40.
52-week high ₹436.00 and low ~ ₹240.25.
🎯 Key Technical Levels (1-Day Chart)
Here are approximate support/resistance levels for the day, based on the recent range and price action:
Major Resistance: around ₹430 to ₹433 — price has approached this zone recently, so it’s an upper hurdle.
Immediate Resistance: near ₹429 to ₹430 given recent high of ~₹429.40.
Current Price Floor / Near Support: around ₹424 to ₹422 — the region where price is trading now.
Strong Support: around ₹417 to ₹420 — this would act as next key floor if the current support fails.
Lower Support / Risk Zone: ~ ₹410 to ₹412 — if price breaks down further, this zone could become relevant.

LICI 1 Week View 🔢 Current status
The stock is currently trading around ₹ 911 on the NSE.
Day-range recently: approx ₹ 906.60 to ₹ 920.60.
52-week range: approx ₹ 715.30 to ₹ 1,007.80.
📉 Key levels to watch for the coming week
Support zone: Roughly around ₹ 895-₹ 900 — the recent trading floor is around that area.
Resistance zone: Near ₹ 920-₹ 930 — this is where the recent high end of the day‐ranges have been.
If price breaks above ~₹ 930 with strength, that could open a move toward ~₹ 950 in the short term (assuming favourable market context).
If price falls below ~₹ 895, risk of a slip toward ~₹ 880 or lower until a new base is found.
⚠️ What to Watch / Risks
The 1-week gain is modest; there’s no strong breakout yet.
If broader market or sector weakens (insurance/financials), LICI could get caught in the drift.
Watch news / earnings triggers that could suddenly shift sentiment.
📝 Disclaimer
This is not a recommendation to buy or sell. Viewing over just one week is very short‐term and subject to high uncertainty. Please consider your own risk profile and possibly consult a financial advisor.

Indian Stock Market1. What Is the Indian Stock Market?
The Indian stock market is a platform where buyers and sellers trade shares of publicly listed companies. It helps companies raise money for growth and expansion, and it allows investors to participate in the wealth creation generated by businesses.
It consists mainly of two major stock exchanges:
Bombay Stock Exchange (BSE) – Established in 1875, one of the oldest exchanges in Asia.
National Stock Exchange (NSE) – Established in 1992, known for its electronic trading system and higher trading volumes.
Both exchanges operate under strict regulation to maintain transparency, fairness, and investor protection.
2. How the Market Works
The Indian stock market operates through an electronic system where trades are matched using advanced technology. When an investor places a buy or sell order, the system matches the order with the opposite party.
Key Components:
a) Primary Market
This is where companies raise money for the first time through an Initial Public Offering (IPO).
Investors buy shares directly from the company.
After listing, the shares become available for trading in the secondary market.
b) Secondary Market
Here, investors buy and sell shares among themselves.
The company does not receive money from these trades.
This is where most trading activity takes place.
3. Major Indices in India
Stock market indices act like barometers that show the overall direction of the market.
a) Sensex (BSE)
Includes 30 of the largest and most established companies.
Represents the overall performance of the BSE.
b) Nifty 50 (NSE)
Includes 50 leading companies from different sectors.
Most widely used benchmark for Indian markets.
Other popular indices include:
Nifty Bank
Nifty IT
Nifty Midcap 100
Nifty Smallcap 100
Sensex Next 50
These indices help investors gauge market trends, sectoral performance, and economic health.
4. Key Participants in the Indian Stock Market
The Indian market is made up of different types of participants, each playing a unique role.
1. Retail Investors
Ordinary individuals investing through brokers or investment apps. Their participation has surged dramatically in recent years.
2. Domestic Institutional Investors (DIIs)
These include:
Mutual funds
Banks
Insurance companies
Pension funds
DIIs play a big role in stabilizing the market during volatile periods.
3. Foreign Institutional Investors (FIIs/FPI)
These are global investors such as hedge funds, pension funds, and foreign asset managers. They bring huge capital flows that influence market direction.
4. Brokers
SEBI-registered intermediaries who execute buy/sell orders for investors.
5. Regulators
Primarily the Securities and Exchange Board of India (SEBI), which ensures:
Fair trading
Transparent pricing
Investor protection
Prevention of fraud and manipulation
5. Types of Financial Instruments Traded
The Indian stock market offers a variety of financial instruments:
a) Equity Shares
Ownership in a company; investors benefit from price appreciation and dividends.
b) Derivatives
Contracts based on future value of assets:
Index futures
Stock futures
Options trading (very popular)
c) Debt Securities
Bonds, government securities, and corporate bonds.
d) Exchange-Traded Funds (ETFs)
Funds that track indices or commodities, traded like shares.
e) Mutual Funds
Professionally managed investment pools that invest in equities, debt, or hybrid assets.
6. Market Timing and Settlement
Market Timings (NSE & BSE):
Pre-open session: 9:00 AM – 9:15 AM
Regular trading: 9:15 AM – 3:30 PM
Post-market session: 3:40 PM – 4:00 PM
Settlement Cycle:
India follows the modern T+1 settlement cycle, meaning trades are settled one business day after the transaction.
7. Why the Indian Stock Market Is Growing Rapidly
1. Economic Growth
India is one of the fastest-growing major economies, attracting global investment.
2. Digitalization of Brokerage
Low-cost mobile trading apps have made investing accessible to everyone.
3. Rising Financial Literacy
More Indians understand the importance of equity investing over traditional savings.
4. Favorable Demographics
India has a young population with increasing disposable income.
5. Strong Corporate Performance
Large Indian companies—IT, banking, energy, pharma—have shown consistent growth.
6. Government Reforms
GST implementation
Insolvency and Bankruptcy Code (IBC)
Digital India push
Make in India
These reforms have strengthened investor confidence.
8. Factors That Influence the Indian Stock Market
a) Economic Indicators
GDP growth
Inflation
Interest rates
Fiscal deficit
b) Global Market Trends
Indian markets often follow trends in global markets like the US, Europe, and Asia.
c) Corporate Earnings
Quarterly results significantly impact stock prices.
d) FII / DII Flows
Large inflows push markets higher; outflows create pressure.
e) Geopolitical Events
War, trade disputes, and international tensions affect market stability.
9. Risks Involved in the Stock Market
Though the stock market provides high returns, it carries risks:
1. Market Risk
Broad market downturns affect all stocks.
2. Volatility
Prices can move quickly due to global news, economic data, or speculation.
3. Liquidity Risk
Some small-cap stocks may not have enough buyers and sellers.
4. Company-Specific Risk
Poor management decisions or scandals can destroy shareholder value.
5. Regulatory Risk
Policy changes can influence sectors like telecom or banking.
Risk management strategies such as diversification, asset allocation, and long-term investing help reduce these risks.
10. Why Investing in the Indian Stock Market Matters
Stock market investing helps individuals build long-term wealth. Historically, Indian equities have provided higher returns than gold, real estate, or fixed deposits over long periods. For example:
Equity returns (long-term average): 12–15%
Gold: 8–10%
Real estate: 6–9%
Fixed deposits: 5–7%
Participation in the stock market empowers citizens and strengthens the economy as companies receive the funds needed to grow, innovate, and create jobs.
Conclusion
The Indian stock market is a dynamic, rapidly evolving financial ecosystem that mirrors the country’s growth story. It offers immense opportunities for wealth creation, provided investors understand how it works and invest wisely. With strong regulatory oversight, technological advancements, and rising participation, the future of the Indian stock market looks extremely promising. Whether you're a beginner or a seasoned investor, the Indian market offers numerous avenues to grow your wealth and participate in India’s economic success.

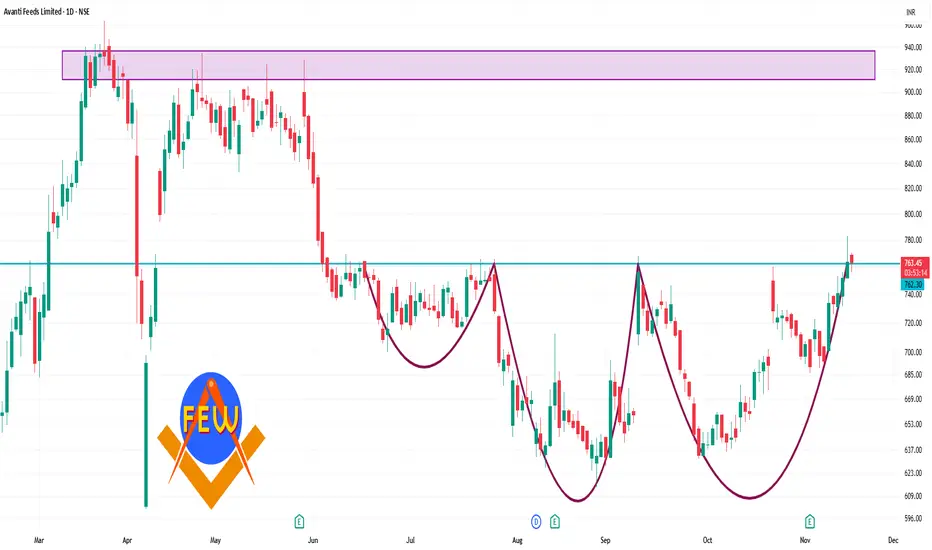
AVANTIFEED 1 Day Time Frame 🔍 Key Levels
Pivot (Daily): ~ ₹ 746.47
Resistance levels:
R1 ~ ₹ 761.48
R2 ~ ₹ 770.92
R3 ~ ₹ 785.93
Support levels:
S1 ~ ₹ 737.03
S2 ~ ₹ 722.02
S3 ~ ₹ 712.58
✅ Interpretation & Use
If price holds above ~₹ 746.47 and shows strength, the next meaningful resistance zone is ~ ₹ 761-771.
If price drops below the pivot, then supports around ~ ₹ 737, and further down ~ ₹ 722 or ~ ₹ 712 become relevant.
The momentum indicators (RSI ~67.6, MACD positive) suggest bullish bias but note: when RSI gets high → risk of pull-back increases.
Usdchf bearish sell
💧USD/CHF – Bearish Bias News Summary
📍SNB cut rates to 0%, signaling more easing ahead → CHF stays fundamentally strong.
📍UBS forecasts USD/CHF lower, expecting continued franc strength.
📍Weak U.S. data increases Fed cut expectations → pressure on USD.
📍Swiss sentiment weak, but SNB still ready to intervene if needed.
🔴🔴🔴Bias: Sell rallies toward premium zones.

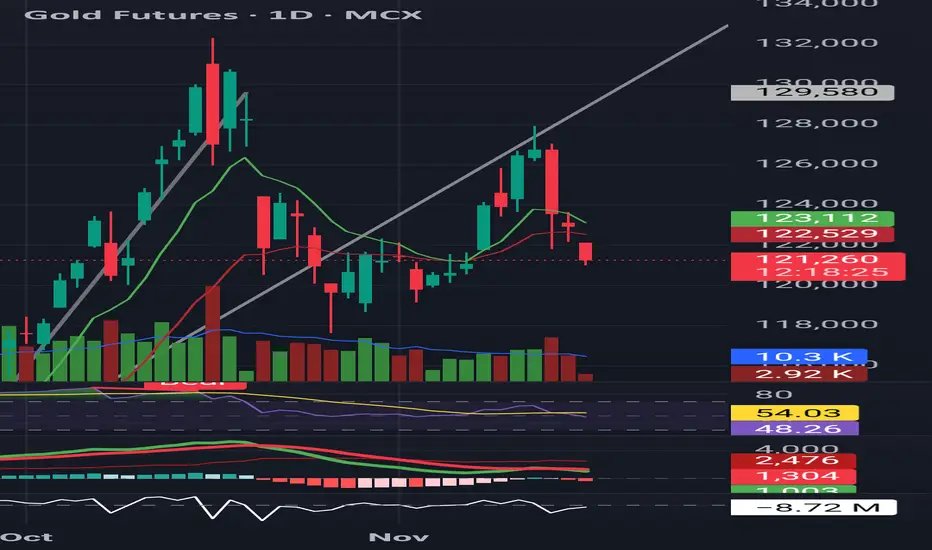
Gold Futures – Bearish Continuation Developing 🟡⬇ Gap-down open = breakdown continuation
Price below 9 EMA and 21 EMA
Evening Star pattern confirmed
RSI falling → momentum weakening
MACD below signal → bearish pressure
📌 Short Setup:
Below 121,800–121,900
🎯 Targets: 117,500 → 116,000
🛑 Stoploss: 123,650
Weak trend until gold closes back above 21 EMA.
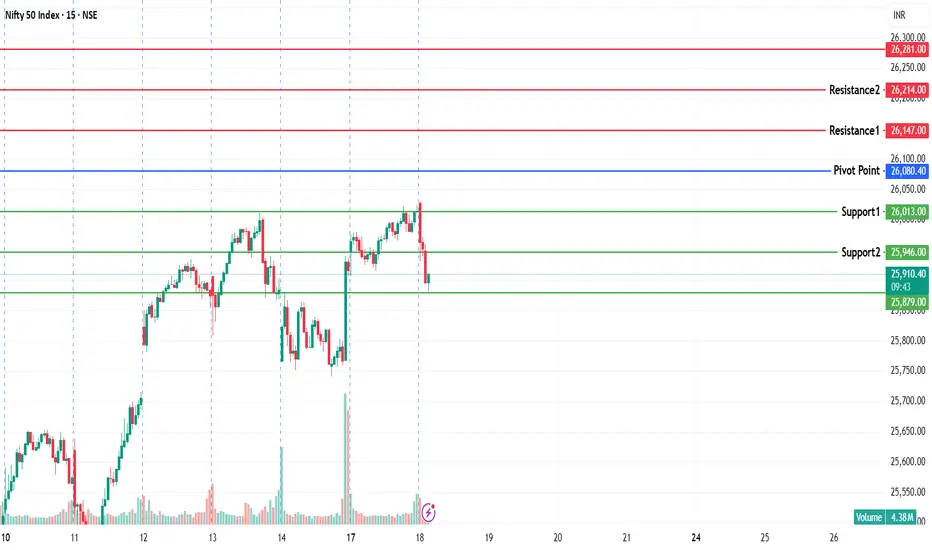
Nifty Breaks Key Support at 25920 — Bears Take the Wheel!Nifty has decisively broken below the crucial support zone at 25920, and price is currently holding under this level—an early sign that bearish momentum may continue. As long as 25975 remains unbroken on the upside, the short-term bias stays negative.
A potential short opportunity may emerge on retests or continued rejection below 25920, with price targets at:
TP1: 25850
TP2: 25800
This setup remains valid unless Nifty reclaims and sustains above 25975.
📌 Disclaimer:
This analysis is for educational purposes only and is not financial advice. Always manage risk and follow your trading plan.
Your feedback drives our content and keeps everyone trading smarter. Let’s make those pips together! 🚀
Happy Trading,
– The InvestPro Team

NIFTY KEY LEVELS FOR 18.11.2025NIFTY KEY LEVELS FOR 18.11.2025
Timeframe: 3 Minutes
Sorry for the delayed post. Delayed due to some technical glitch
If the candle stays above the pivot point, it is considered a bullish bias; if it remains below, it indicates a bearish bias. Price may reverse near Resistance 1 or Support 1. If it moves further, the next potential reversal zone is near Resistance 2 or Support 2. If these levels are also broken, we can expect the trend.
When a support or resistance level is broken, it often reverses its role; a broken resistance becomes the new support, and a broken support becomes the new resistance.
If the range(R2-S2) is narrow, the market may become volatile or trend strongly. If the range is wide, the market is more likely to remain sideways
please like and share my idea if you find it helpful
📢 Disclaimer
I am not a SEBI-registered financial adviser.
The information, views, and ideas shared here are purely for educational and informational purposes only. They are not intended as investment advice or a recommendation to buy, sell, or hold any financial instruments.
Please consult with your SEBI-registered financial advisor before making any trading or investment decisions.
Trading and investing in the stock market involves risk, and you should do your own research and analysis. You are solely responsible for any decisions made based on this research.
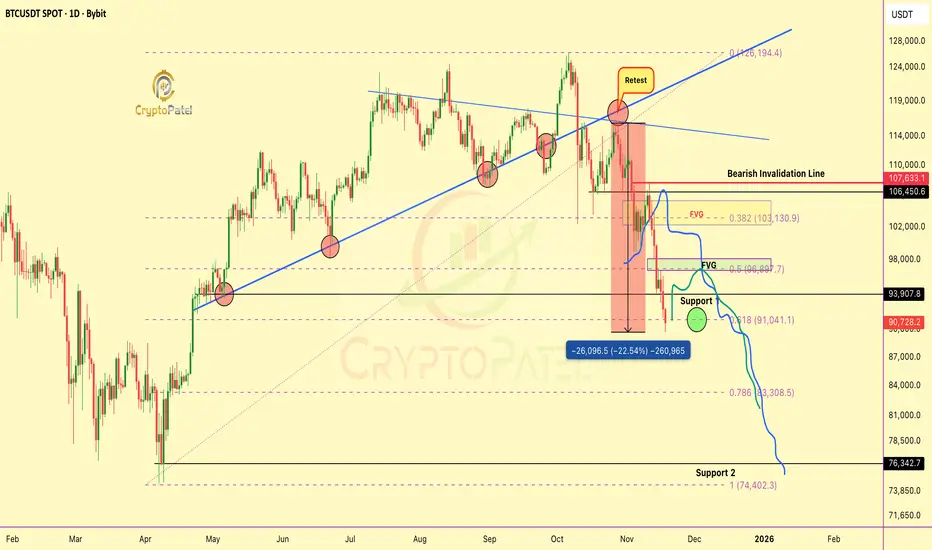
#BITCOIN UPDATE: Structure Still Playing Out Exactly as Mapped#BITCOIN Technical Update: Structure Still Playing Out Exactly as Mapped
CRYPTOCAP:BTC has now broken below the $90K zone, a level not seen since 22 April 2025, Seven months ago.
I told you this when Bitcoin was rejecting $115K, and we’re now ~22% down from that zone.
Price is following the structure with precision.
Key observations:
🔻 BTC currently sits on the 0.618 FIB: High-probability bounce zone.
A relief move into the $98K–$100K region is very possible in the coming days.
🔼 Upside FVG: ~$98,000
If price pushes deeper first, this FVG becomes the ideal tap before the next leg down.
This is why I said: don’t short here, Risk-reward is terrible at the lows.
A sweep toward $98K would offer a clean, low-risk short entry.
🔽 Downside FVG: ~$88,474: This zone can trigger a strong reaction and potential bounce.
Market structure remains intact:
Below $107.5K → macro bearish leg still active
Above $107.5K → invalidation + path toward new ATH reopens
Price continues to respect levels.
Charts > emotions. Structure > noise.
NFA & DYOR