NTPC - Long• Price has moved above the middle Bollinger Band on the weekly chart. This shows the stock is shifting from sideways to bullish.
• The recent weekly candle is strong and moving toward the upper Bollinger Band. This tells us volatility is expanding on the upside, which usually supports further upside movement.
• RSI on the weekly chart is above 60. When RSI stays above 60, it shows strong momentum and confirms that buyers are in control.
• Earlier, when RSI was below 60, the stock remained in a range. The move above 60 indicates a clear momentum shift in favour of bulls.
• Volume has increased during this move. Rising volume along with price moving toward the upper Bollinger Band confirms that the breakout is supported by real buying interest.
• When price is above the middle Bollinger Band, RSI is above 60, and volume is expanding together, it signals a healthy and sustainable uptrend.
Weekly trade plan
• Trend remains positive as long as price stays above the middle Bollinger Band and RSI remains above 60.
• Buying on small weekly pullbacks or near the middle Bollinger Band can be considered.
• Stop loss can be kept below the recent weekly swing low or below the lower Bollinger Band.
• Upside can be trailed toward the upper Bollinger Band as long as momentum stays strong.
X-indicator

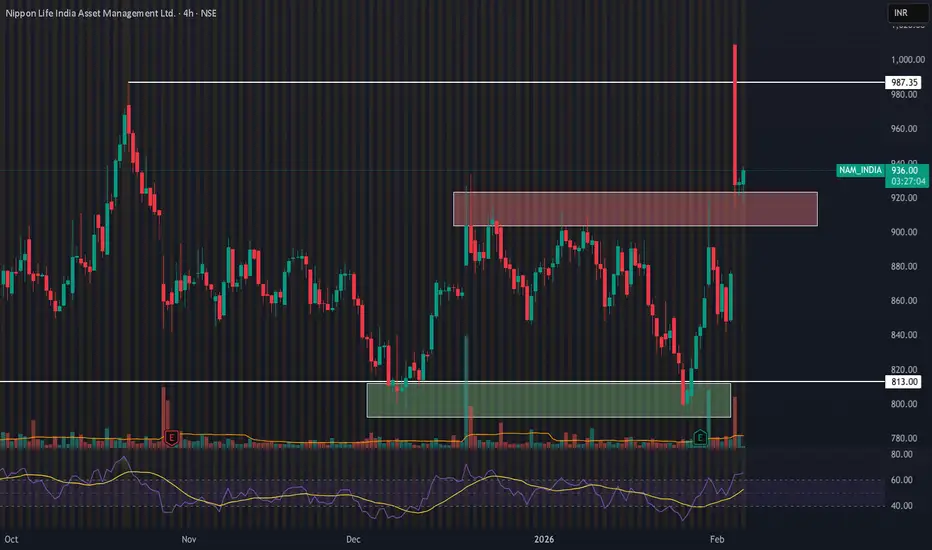
The Nippon Life India Asset Management Ltd. (NSE) 4‑hour chartThe Nippon Life India Asset Management Ltd. (NSE) 4‑hour chart suggests the following swing‑trade analysis:
1. Trend & Structure: The stock has shifted from a downtrend to an upward move after breaking out of the consolidation zone (green box 813–820). The recent bullish candle indicates potential swing‑trade opportunity.
2. Key Levels:
- Support: 920–813 (the lower green box acts as a swing support).
- Resistance: 980–987 (red box); a break above this could target 1,000+.
3. Entry: Consider entering a long swing position on a confirmed pullback to the 920–930 zone or on a break above 940 with strong volume.
4. Target: 980–987 (short‑term target); next target 1,000+ if resistance breaks.
5. Stop‑Loss: Place below the recent swing low around 813–820 to manage risk.
6. Indicators: Monitor the RSI for momentum, currently above 60 , suggesting a fresh start for up move.
NIFTY KEY LEVELS FOR 04.02.2026NIFTY KEY LEVELS FOR 04.02.2026
Timeframe: 3 Minutes
If the candle stays above the pivot point, it is considered a bullish bias; if it remains below, it indicates a bearish bias. Price may reverse near Resistance 1 or Support 1. If it moves further, the next potential reversal zone is near Resistance 2 or Support 2. If these levels are also broken, we can expect the trend.
When a support or resistance level is broken, it often reverses its role; a broken resistance becomes the new support, and a broken support becomes the new resistance.
If the range(R2-S2) is narrow, the market may become volatile or trend strongly. If the range is wide, the market is more likely to remain sideways
please like and share my idea if you find it helpful
📢 Disclaimer
I am not a SEBI-registered financial adviser.
The information, views, and ideas shared here are purely for educational and informational purposes only. They are not intended as investment advice or a recommendation to buy, sell, or hold any financial instruments.
Please consult with your SEBI-registered financial advisor before making any trading or investment decisions.
Trading and investing in the stock market involves risk, and you should do your own research and analysis. You are solely responsible for any decisions made based on this research.

Nifty50 analysis(4/2/2026).CPR: wide + ascending cpr: consolidtion
FII: 5,236.28 bought.
DII: 1,014.24 bought.
Highest OI:
CALL OI: 25800, 26000
PUT OI: 25700
Resistance: - 26000
Support : - 25500
conclusion:.
My pov:
1.today price consolidate towards 25250. because it is the place were huge support is seen.
2.in one hour candle the 200ma line is broken for first time , for 200ma line the price must break many time to get support ,so there is highly possible to go down to find support .
3.in 4hour candle has support of 200ma line at 25650 that itself give support or make market consolidate itself there 25650.
4.keep in mind that market is in bullish the price suddenly gapped up so most active player wait for the right place to entry long .
What IF:
market can go down to 25250 max.
if it 26000 is the high max.
psychology fact:
Trust the process, objectify the market, accept uncertainty.
note:
8moving average ling is blue colour.
20moving average line is green colour
50moving average line is red colour.
200moving average line is black colour.
cpr is for trend analysis.
MA line is for support and resistance.
Disclaimer:
Iam not Sebi registered so i started this as a hobby, please do your own analysis, any profit/loss you gained is not my concern. I can be wrong please do not take it seriously thank you.

BITCOIN at High-Timeframe Demand: Reaction Zone in Play!When I look at this chart, I’m not seeing fear or structural damage.
I’m seeing price doing exactly what it should do after a distribution phase , revisiting demand and slowing down.
Bitcoin has come back into a clearly marked high-timeframe demand / reaction zone . This is not a random level. This is an area where price has previously flipped structure and attracted strong participation.
What stands out to me on the chart:
Price is holding above a major high-timeframe support , not slicing through it. That tells me sellers are no longer aggressive at these levels.
The current zone is labeled as a planned accumulation area (not FOMO) . Price is reacting here instead of accelerating lower, that’s important.
Downside risk is clearly defined with a structure invalidation level below demand. As long as that level holds, structure remains intact.
Upside targets are logical and sequential , starting from a reaction high, followed by range expansion, and then higher-timeframe resistance.
The psychology behind this phase:
This is the part of the market where most people feel uncomfortable.
Price isn’t exciting. It’s not trending fast. It’s just… sitting.
But that’s usually how strong moves begin.
If Bitcoin were truly weak, it wouldn’t pause here, it would break cleanly below demand.
So far, it hasn’t.
That tells me the market is evaluating value , not panicking.
My approach here is simple:
I don’t chase price away from demand.
I don’t panic inside support.
I observe how price behaves at this zone and let the market show its hand.
As long as price holds above the demand zone, reactions from here remain valid.
Only a clean acceptance below the invalidation level would change this view.
Until then, this is a patience zone .
And patience, more often than prediction, is what gets paid in this market.
Disclaimer:
This analysis is for educational purposes only. Not financial advice. Always manage risk and trade according to your own plan.

XAUUSD INTRADAY LEVELS Gold (XAUUSD) – Intraday Analysis (15M)
Gold is currently trading in a short-term bullish structure after forming a higher low and strong impulsive move upward. Price has broken above the recent consolidation zone and is now retesting the demand area, indicating potential continuation to the upside.
Trade Plan:
Bias: Bullish (Daily bias bullish)
Entry: Buy only after clear bullish confirmation from the marked demand zone
Invalidation: Sell positions below the marked support level
Targets:
Target 1: 5,101
Target 2: 5,239
Target 3: 5,312
A healthy pullback into the demand zone followed by bullish price action can provide a high-probability long opportunity. Risk management is crucial; avoid entries without confirmation.

Silver short tradeJust look at the chart of silver and the pattern is called RC or Re pattern and the pullback towards the FVG and start falling from that level indicates that silver is ready for more fall.

Gold Rebounds from the Bottom — Is the Bull Market Restarting?✅ From the 4-hour timeframe, gold has staged a continuous rebound from the 4402 low. Price has moved back above MA10 and the Bollinger middle band, and is gradually approaching the MA20 resistance area. The previous one-sided bearish structure has been broken, and the market is now entering a structural rebuilding phase after trend recovery. The 4950 level stands as a key bullish–bearish transition zone on the 4-hour chart. If price can hold firmly above it, further upside potential may open.
✅ On the 1-hour timeframe, price is forming a step-like upward structure, with MA5 / MA10 / MA20 aligned bullishly and the Bollinger Bands opening upward, indicating strong short-term bullish momentum. However, price is now close to the upper Bollinger band and a previous high-volume trading area, suggesting a need for short-term consolidation and pullback.
✅ Combining both timeframes, the market has shifted from a prior bearish trend into a bullish-led, oscillating upward rhythm. As long as price remains above 4900, pullbacks are more likely to be buying opportunities rather than signals for a renewed decline.
🔴 Resistance: 4980–5050
🟢 Support: 4900–4850
✅ Trading Strategy Reference:
The current approach focuses primarily on buying on pullbacks, with light short positions considered near resistance zones.
🔰 Long Strategy (Buy on Pullback)
👉 Entry Zone: 4850–4920, scale into long positions
🎯 Target 1: 4980
🎯 Target 2: 5050
🎯 Extended Target: 5130
📍 Logic:
This area is a confluence of 1-hour moving average support and the 4-hour middle band support, suitable for trend-following entries.
🔰 Short Strategy (Light Shorts at Resistance)
👉 Entry Zone: 4980–5050, light short positions
🎯 Target 1: 4920
🎯 Target 2: 4850
📍 Logic:
This area aligns with the 4-hour MA20 and previous structural resistance, where short-term technical pullbacks may occur.
✅ Risk Control Reminders
👉 The primary bias is bullish; shorts are for consolidation only
👉 If price holds firmly above 5000, the short bias becomes invalid
👉 As long as pullbacks do not break below 4850, the bullish rhythm remains intact
👉 In a ranging market, focus on scaling positions and strict stop-loss discipline.

Sandhar Technologies cmp 534.05 by Weekly Chart view since listeSandhar Technologies cmp 534.05 by Weekly Chart view since listed
- Support Zone 440 to 480 Price Band
- Resistance Zone 560 to 600 Price Band
- Support Zone acting ground for probable reversal


USDCAD – 15M | Breakout → Retest → Continuation SetupStrong impulsive move delivered a clean break in market structure to the upside.
Price pushed into buy-side liquidity, then paused at prior highs.
Key read:
Bullish displacement confirmed ✔️
Old resistance now acting as support ✔️
Pullback unfolding inside premium with inefficiency below

IM LONG IN XAUUSD: HTF 0.5 Fibonacci Magnet in Play (4950–5000)*Gold is holding trendline support and targeting the 0.5 Fibonacci level of the higher timeframe.
What I Have Mentioned is the Clear HTF bias, defined by zone, defined reaction zone, which shows both bullish & corrective scenarios
****Strongly it educates, not hypes***
XAUUSD Price ( 4950 – 5000 ) remains the key upside zone if support continues to hold.
Market Context:
XAUUSD is currently trading around 4810, holding above a rising yellow trendline support.
Technical Confluence:
• Higher timeframe 0.5 Fibonacci retracement lies between 4950 – 5000
• This zone is marked as a major reaction area (highlighted rectangle)
• Trendline support + structure holding adds bullish probability
Price Expectation:
As long as the price respects the trendline support, gold can continue its move higher towards the 0.5 HTF Fibonacci zone.
The green and red projected paths indicate possible market reactions based on support and resistance behavior — not prediction, but preparation.
Trading Insight:
This is a buy-on-support, sell-into-resistance setup.
Strength near 4950–5000 must be watched closely for either continuation or rejection.
Let price confirm at HTF levels — patience pays more than prediction.

WILL NIFTY REACH ALL TIME HIGHS?Nifty after making a huge gap up of 1200+ points we saw selling from all time highs
now it will come for a retracement till 25550-25470 levels.
from these levels we can see all time highs again.
keep a sl of 25350 for all time highs as TARGETS.

Gold (XAU/USD) Bullish Breakout: Aiming for the $5,120 MilestoneGold is currently exhibiting strong bullish momentum on the hourly timeframe, supported by a well-defined ascending trendline. After a period of consolidation, the price has successfully breached a key resistance zone around the $4,950 - $4,970 level.

#XAUUSD📊 Gold (XAU/USD) Elliott Wave Analysis
Gold is unfolding a corrective structure that highlights the power of Elliott Wave theory:
- Wave A: The decline began with a 5-wave fall. Wave 1 retraced more than 61.8% by Wave 2, forming a zigzag.
- Wave 3: The strongest and largest bearish leg, confirming downside momentum.
- Wave 4: Price is now rising in a corrective move. This rise is part of the ABC pattern within Wave 4, where the current rally represents Wave C.
- Wave 5 (ahead): Once this corrective rise completes, the next bearish leg is expected.
📈 Key Levels to Watch:
- Corrective rise could extend toward 5030 – each rally remains an opportunity to sell.
- Downside target: Price is projected to revisit the 4200 zone as Wave 5 unfolds.
💡 Trading Insight:
Every corrective rally is a chance to align with the larger trend. Staying patient and disciplined in identifying these setups is crucial for risk-managed entries.

GBP/AUD Analysis: Bearish Momentum Accelerates on Hawkish RBAFresh Selling Level_ At CMP
The GBP/AUD currency pair is experiencing significant selling pressure on the 1-hour timeframe as the Australian Dollar strengthens following a hawkish interest rate decision. The pair is currently trading at 1.95423, down approximately 0.58% from the daily open.

XAUUSD ( 1H ) Bullish viewGold holding above key support and forming higher highs.
Sustained move above 4945 confirms buy continuation.
Upside targets: 5000 → 5100+
Momentum favors bulls, dips remain buy opportunities.
#XAUUSD #Gold #Bullish #BuySide #ForexTrading

US100 (Nasdaq) – Structure & BiasPrice is currently trading inside a well-defined consolidation range, capped by a major resistance zone near 25,850–25,900 and supported around 25,230–25,250, which has acted as a strong demand flip multiple times.
The recent price action shows:
A liquidity sweep to the downside, followed by a sharp bullish reaction, indicating smart money absorption.
Price reclaiming the mid-range level, suggesting buyers are regaining short-term control.
Compression near support, often a precursor to expansion.
The projected path indicates a minor pullback or sideways consolidation, followed by a bullish continuation toward the upper resistance band. Structure favors upside as long as price holds above the marked support zone.
Key Levels
Support: 25,230 – 25,250
Mid-range equilibrium: ~25,300
Target / Resistance: 25,850 – 25,900
Bias
🟢 Bullish continuation, provided price maintains above the demand zone.
A clean breakout above consolidation could trigger momentum-driven expansion toward the highs.

Breakout in Garware Hi-tech films Symmetrical Triangle Breakout Setup
RSI near 60 and rising
Trading above EMA50
Volume increasing
13+ months of consolidation
Disc: for study, not a recommendation

KANPRPLA || Long-Term Investment IdeaCurrent Market Price (CMP): 199.90
Breakout Context: Consolidation breakout confirmed today with strong volume, adding conviction.
Trade Plan
Long Entry Range: 180–185
Target: 267.30 (approx. +48.5% from 180)
Stop Loss: 165 on closing basis (risk of about –8.3% from 180)
Key Notes
- A breakout supported by strong volume often signals genuine momentum, though retests of the breakout zone are common.
- If price dips near 180–185 but holds above the stop loss, consider it a healthy retest.
- Trail your stop loss upward as price moves toward the target to secure profits and reduce risk.
Disclaimer:
This content reflects a personal market observation and is not intended as a trade recommendation. Please ensure you conduct your own independent analysis and due diligence before making any investment or trading decisions.

Nifty’s Elevated Volatility: Is Ichimoku Time Failure at Play?Nifty’s Elevated Volatility: Is Ichimoku Time Failure at Play?
Why is NIFTY witnessing unusually elevated volatility?
Are macro headlines such as the Union Budget, trade agreements, and tariff developments the only drivers?
Probably not.
With 38 weeks elapsed since the weekly Kumo breakout , NIFTY has now technically entered Ichimoku’s hard time-failure window — a phase where an unresolved structure often manifests as heightened volatility, accompanied by an increasing urgency for resolution .
Three possible paths of resolution before the 42nd week
1. Bullish scenario:
Price action rallies towards the initial follow-through reference (~27,193.8) and extends further higher.
2. Bearish scenario:
A decisive weekly close below the acceptance boundary (~24,274.8) , followed by further downside.
3. Time-failure scenario:
Price action remains range-bound within the acceptance zone , leading to time-decaying, non-directional moves.
Which of these scenarios appears more likely from here on?
Comments and thoughts are welcome

BEL : High-Quality Setup Despite Market Weakness📊 Technical Catalysts :
This is a perfect VCP structure with a clean breakout supported by strong volume, clearly indicating institutional interest. The stop loss is well placed below the basing formation, keeping risk structurally defined. The 20 EMA crossing above the 50 EMA further confirms a bullish trend shift.
EPS and Sales are continuously increasing for the past few quarter. The only dip was in June and this is not a stock specific event but a market wide scenario.
🏭 Fundamental Catalysts :
Good Results ; EPS and Sales are continuously increasing for the past few quarter. The only dip was in June and this is not a stock specific event but a market wide scenario.
Q3 Beat: Net profit grew 20.4% YoY (₹1,590 Cr), comfortably beating street estimates. Revenue execution is at an all-time high.
The EU FTA Factor: The "Mother of All Deals" signed on Jan 27 opens up a $750B market for Indian defense electronics. BEL is the primary beneficiary as it scales up exports to European nations looking to de-risk from China/Russia.
Budget 2026 Speculation: With the Union Budget on Feb 1, the market is front-running a likely increase in defense capital outlay.
Even though the broader market is showing signs of weakness, the confluence of strong technical structure, volume-backed breakout, moving-average crossover, and improving fundamentals provides enough confidence to take this trade, while still maintaining disciplined risk management with a standard 1% risk per trade.
📢📢📢
If my perspective changes or if I gather additional fundamental data that influences my views, I will provide updates accordingly.
Thank you for following along with this journey, and I remain committed to sharing insights and updates as my trading strategy evolves. As always, please feel free to reach out with any questions or comments.
Other posts related to this particular position and scrip, if any, will be attached underneath. Do check those out too.
Disclaimer : The analysis shared here is for informational purposes only and should not be considered as financial advice. Trading in all markets carries inherent risks, and past performance is not indicative of future results. It’s essential to conduct your own research and assess your risk tolerance before making any investment decisions. The views expressed in this analysis are solely mine. It’s important to note that I am not a SEBI registered analyst, so the analysis provided does not constitute formal investment advice under SEBI regulations.

Part 5 Advance Option Trading Option Chain
Displays strike-wise premiums, open interest, volume, Greeks.
Traders read it to predict support/resistance and market structure.
Open Interest (OI)
Shows number of active contracts.
High call OI → resistance.
High put OI → support.
OI change indicates market sentiment shift.
Volume in Options
Measures trading activity at a price.
High volume = strong interest = better reliability.
Useful for volume profile and market structure analysis.
