XAUUSD – Bearish Reversal Setup With Liquidity Sweep and Sell-OfAnalysis:
The chart shows a bearish setup on XAUUSD where price has tapped into a supply zone (highlighted in red) and is expected to reverse downward.
Key elements visible:
Supply Zone (SL area): Price recently reached a premium area where sellers previously stepped in. This is marked as the stop-loss region.
Distribution Pattern: The zig-zag sketch indicates expected consolidation / distribution before the drop.
Entry Zone: The current level sits just below the supply, suggesting a short opportunity after confirmation.
TP 50% Level: A midpoint partial take-profit level is marked around 4193.439, indicating a measured extension.
Final Target: The dark teal zone at the bottom represents the larger bearish target, aligning with previous demand / liquidity areas.
Overall, the chart expresses a short bias, expecting price to form a top structure and then sell off toward the deeper target zone after taking liquidity above.
X-indicator

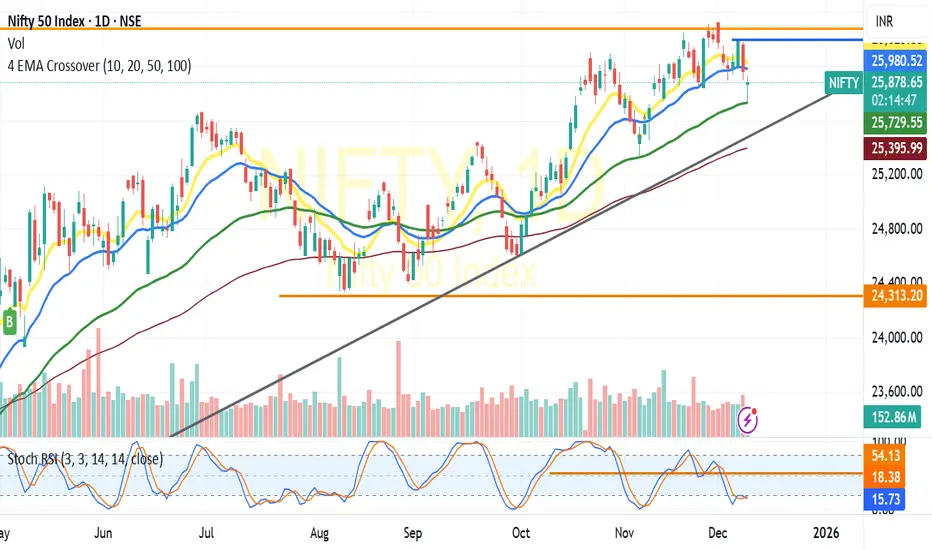
NIFTY -Positional View Buy or SELL?NIFTY :Witnessed giving up all its recent gains and tested 25800 band ,In the process violated all its critical Moving averages viz 10 &20 DEMA.
Though NIFTY showed a strong pull back towards 25900 ,expect the rally to sustain only when it gives a close above its 10 DEMA & 20 DEMA -Lying between 25950-26050.Deceseive close above 26000 is critical for the sustained rally. On the other hand close below 25700 is likely to drag it to 25500 levels,be cautious with the levels and trade accordingly(For educational purpose only)
Gold sell target as per your return you want so im selling this selling gold right away so can get some targets
becuase its pre LDN sell off so taking a 1.5% risk of capital

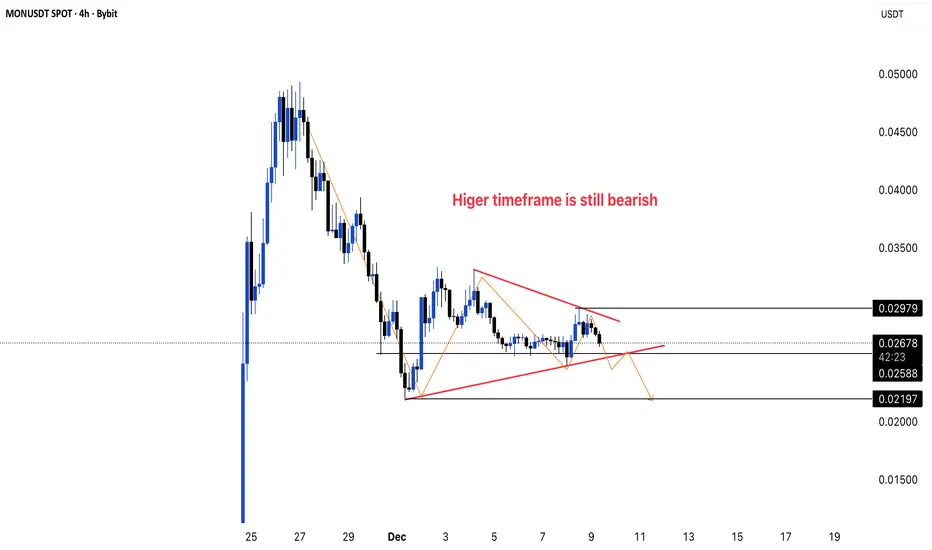
MONUSDT BEARISH FLAG ?🔥 1. Why This Chart Matters Now
MONUSDT 1H is compressing inside a wedge while the higher timeframe remains bearish.
This next break from consolidation could decide whether we get one more leg down or a sharp short-term squeeze.
📌 2. Pattern Overview
Price is trading inside a contracting wedge / triangle after a strong sell-off.
Sellers are defending lower highs, buyers are holding slightly higher lows – classic compression before a larger move.
In a bearish higher-timeframe context, this pattern often acts as a continuation, where liquidity builds on both sides and one strong move clears trapped traders.
📉 3. Key Levels
Support
0.0259–0.0258 – Mid-range support inside the wedge; if lost, consolidation turns into distribution.
0.0220–0.02197 – Major range low / demand. A break here opens room towards the 0.0200 liquidity pocket.
Resistance
0.0275–0.0280 – Wedge resistance and local lower-high zone where sellers have been active.
0.0298–0.0300 – Top of the box / key supply. Reclaiming this would start to challenge the broader bearish structure.
📈 4. Market Outlook
Bias: Tilted bearish while price trades below 0.0298–0.0300 and under wedge resistance.
Momentum shift: A clean 1H close above 0.0298 with follow-through and acceptance would be the first sign that buyers are taking control.
Smart money view: Institutions are likely waiting either for
a stop-hunt above 0.028–0.030 to reload shorts, or
a decisive breakdown below 0.0259 to add to positions in the direction of the higher-timeframe trend.
🧭 5. Trade Scenarios
🟢 Bullish Scenario
Entry trigger: 1H candle close above 0.0298, followed by a successful retest of 0.0298–0.0290 as support.
First target: 0.0320
Second target: 0.0350
Reasoning: A confirmed breakout above wedge resistance and key supply forces shorts to cover and attracts breakout buyers, creating a squeeze higher.
🔻 Bearish Scenario
Breakdown trigger: 1H close below 0.0259 and wedge support, or a retest of 0.0259 from below that gets rejected.
Target: First into 0.0220–0.02197, with possible extension towards 0.0200 if selling accelerates.
Why: A breakdown confirms the wedge as a bearish continuation pattern, with late buyers trapped and exiting into a move aligned with the higher-timeframe downtrend.
⚠️ 6. Final Note
Don’t chase every wick inside this wedge – wait for a clear candle close and retest before committing risk.
If you want more structured chart breakdowns like this, follow me on TradingView for daily, multi-timeframe analysis.
Part 9 Trading Master ClassWhat Are Options?
An option is a financial contract that gives the buyer the right, but not the obligation, to buy or sell an underlying asset (like Nifty, Bank Nifty, or a stock) at a fixed price before a specific time.
There are two types of options:
1. Call Option
A call option gives the buyer the right to buy the underlying asset at a fixed price (called the strike price).
You buy a call when you expect price to go up.
Example: If Nifty is at 22,000 and you buy a 22,000 CE (Call Option), you profit if Nifty goes above 22,000 (after covering premium).
2. Put Option
A put option gives the buyer the right to sell the underlying asset at a fixed price.
You buy a put when you expect price to fall.
Example: If Bank Nifty is at 48,000 and you buy 48,000 PE (Put Option), you profit if the price falls below 48,000.

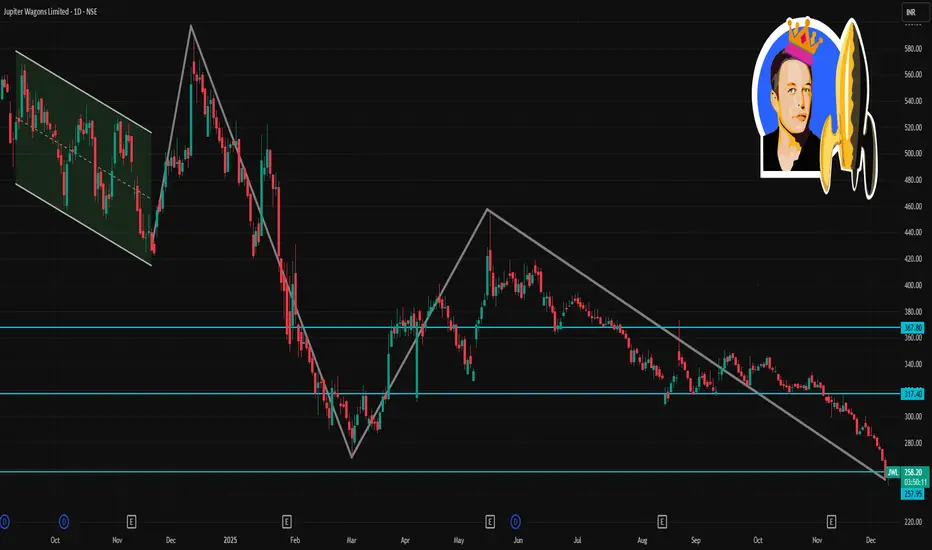
JWL 1 Day Time Frame 📌 Key recent price and context
Recent quoted share price of JWL is ~ ₹254–267 (on NSE/BSE, depending on source/time).
The 52‑week high / low range for JWL has been roughly ₹588 (high) and ₹266 (low).
🔧 Key 1‑Day Support / Resistance / Pivot Levels
Based on most recent public pivot‑point / support‑resistance breakdowns:
Level Approximate Price / Range
Immediate Support (S1) ~ ₹263.6
Lower Support (S2 / S3) ~ ₹260.2 and ~ ₹254.3
Pivot / Intra‑day Reference ~ ₹269.5
First Resistance (R1) ~ ₹272.9
Second Resistance (R2) ~ ₹278.9
Third / Upper Resistance (R3) ~ ₹282.3
Interpretation (for 1‑day horizon):
On a decline, watch ₹263.5–₹260 as first support zone — a drop below ₹254–₹255 could open up downside risk.
On a bounce/recovery, ₹272–273 may act as first resistance zone; ₹278–282 as the key target or supply zone.
If price trades near the pivot (~₹269), price action and volume around that will decide intraday bias (whether sellers or buyers dominate).
Components of a Candle (Body, Wick, High, Low)Types of Candlestick Patterns
Candlestick patterns are broadly divided into:
A. Single Candlestick Patterns
Formed by just one candle.
B. Double Candlestick Patterns
Formed by two-candle combinations.
C. Triple Candlestick Patterns
Formed by three-candle combinations.
Let’s dive into each category in detail.

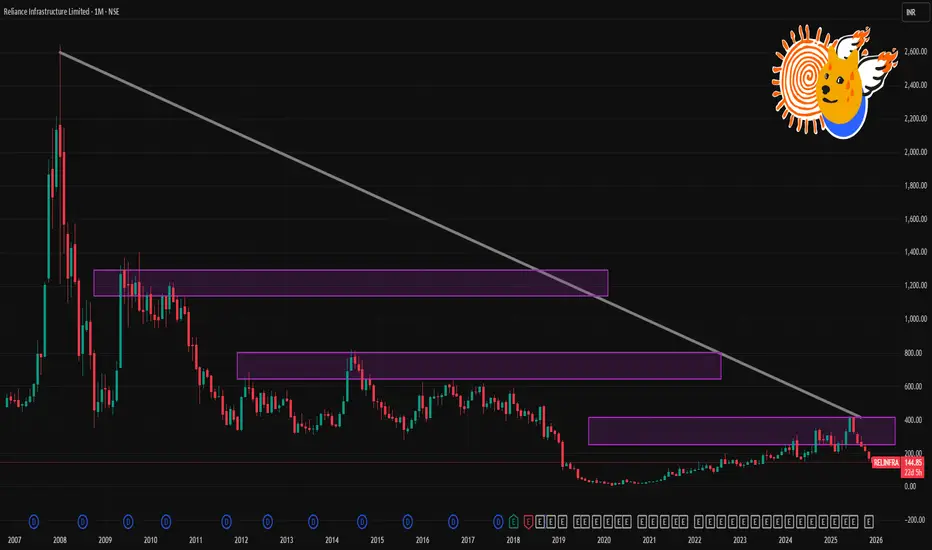
RELINFRA 1 Month Time Frame 📉 What’s Happening Now
As of 8–9 December 2025, Reliance Infrastructure is trading near ₹ 146–147 — its 52‑week low.
Over the past month the stock has seen a sharp drop of ~15–20%.
On 9 Dec it hit a fresh intraday low of ~₹ 139.6‑140, triggering lower‑circuit (i.e. trading halt for the day) — indicating heavy selling pressure.
🔎 Why the Weakness
The recent decline reflects broad selling pressure, partly driven by negative sentiment in its sector and possibly concerns over group‑level regulatory/legal issues.
While the company has been in distress compared with its earlier 52‑week high (~₹ 425), volatility remains high, with the share trading well below major moving averages.
Premium PatternsFinal Tips to Master Premium Chart Patterns
Patterns don't work alone—context is everything.
Look for liquidity sweeps before pattern confirmation.
Avoid trading patterns in the middle of trends.
Volume is the key filter to avoid false breakouts.
Journal each pattern you trade and review monthly.
Use pattern + order block confluence for top accuracy.
Never chase the breakout—wait for retest.

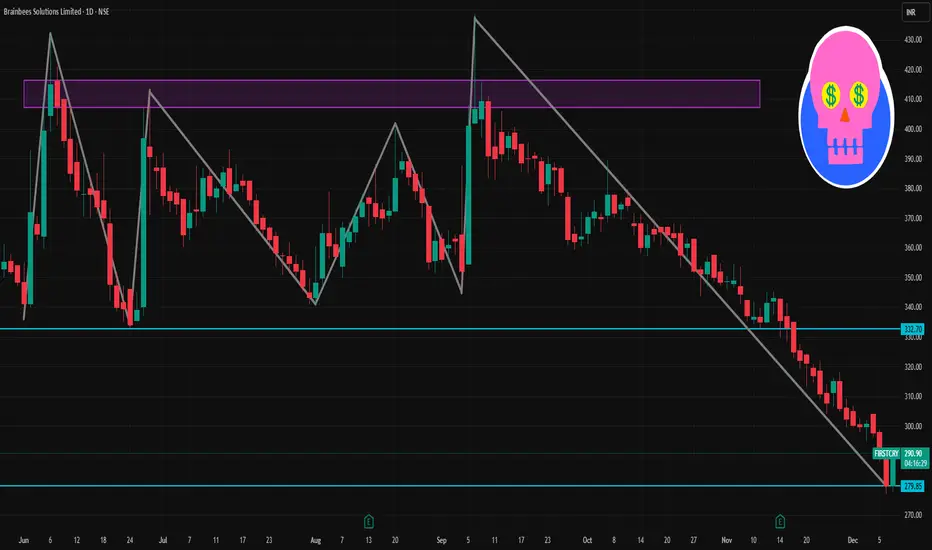
FIRSTCRY 1 Day Time Frame 📊 What the 1‑day chart for Brainbees Solutions currently shows
As of recent trading, the share price of Brainbees Solutions is around ₹ 279–290 on NSE.
The 52‑week high and low band shows a high near ~₹ 664–665 and a low around ~₹ 277–286.
That means at current ~₹ 280–290, the stock is very close to its 52‑week low — which may make the “day‑timeframe level” important for traders looking for a bounce or reversal.
Some technical‑analysis data (on certain days) show bearish momentum: for example, on a recent day the stock hit an all‑time low of ₹ 287, continuing a downtrend.
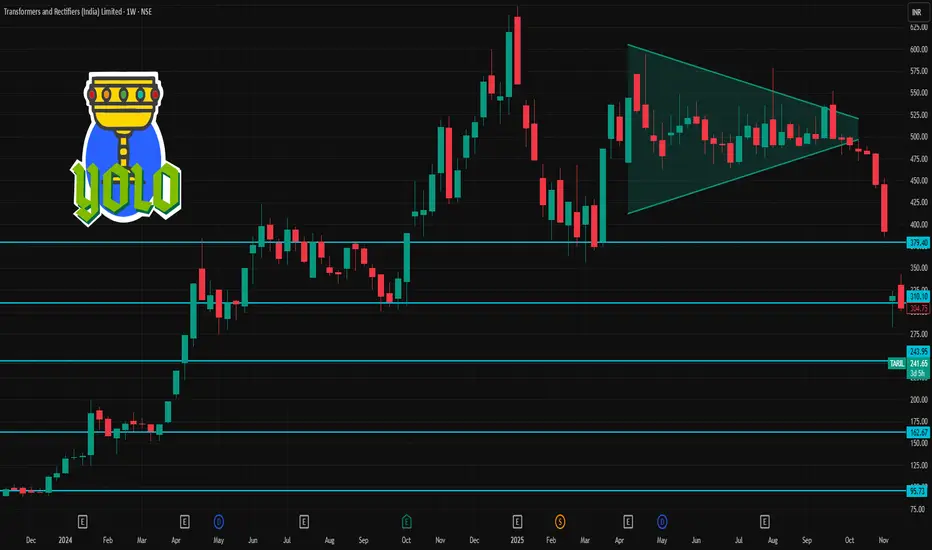
TRIL 1 Week Time Frame 📌 Latest Price & 1‑Week Snapshot
The stock is trading around ₹240–₹241 per share (NSE/BSE).
According to a recent summary, over the last 1 week the stock has moved approximately –7% to –7.4%.
52‑week range: Low ≈ ₹232–₹236, High ≈ ₹648–₹650.
Thus the stock is very near its 52‑week low — down roughly 63% from 52‑week high.
What this suggests (short‑term)
The share is currently at deep discount territory, close to 52‑week bottom — so for traders, this could mean limited downside (barring new negative news), but also that upside is large — albeit requiring major positive triggers.
Given weak near‑term momentum (recent dip, down ‑7% in a week), the stock may consolidate around current levels — ₹230–₹250 zone — unless there’s a strong catalyst.
🎯 What This Means for Short-Term Traders vs Long-Term Investors
Short-term traders: The ₹232–₹240 zone can be considered as a near-term support base. If the stock holds above ~₹235, a bounce is possible — but sharp volatility remains likely. Risk/reward is skewed toward a bounce — but with high uncertainty.
Medium/Long-term investors: The deep discount vs 52‑week high may look attractive — but fundamentals (earnings weakness, recent volatility, sanction overhang) suggest caution. The stock could recover substantially — if the company stabilizes business, wins new orders, and global/sector sentiment improves.
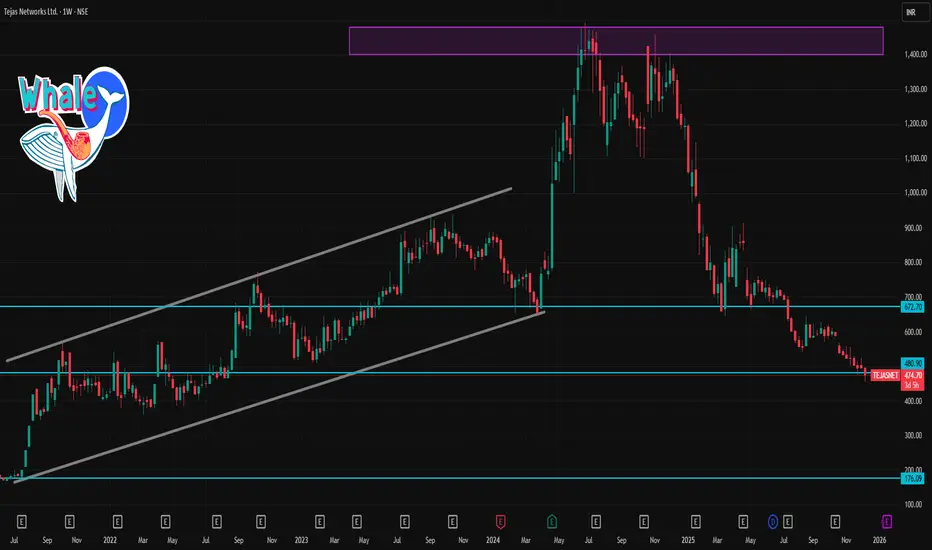
TEJASNET 1 Day Time Frame 📌 Recent Price & Context
According to a live quote on 9 Dec 2025, Tejas Networks is trading around ₹471–₹476.
Recent technical‑indicator feeds (on daily chart) show oversold conditions: e.g. RSI ~ 20 (oversold), MACD negative, ADX high — indicating downward momentum + volatility.
On weekly‑timeframe classification, some aggregator sources rate the trend as “strong sell.”
So at this moment, the bias is bearish to neutral, unless a reversal catalyst emerges.
🎯 Weekly Pivot / Key Levels (Support & Resistance)
Using the most recent weekly pivot analysis:
Level Price (Approx)
Weekly Pivot (central) ₹503.7
Support Zone 1 (S1) ~ ₹482.5
Support Zone 2 (S2) ~ ₹470.9
Resistance 1 (R1) ~ ₹515.3
Resistance 2 (R2) ~ ₹536.5
Resistance 3 (R3) ~ ₹548.0–₹550+
Interpretation
The pivot at ₹503.7 marks the “line of neutrality.” Weekly closes above this level would shift bias more bullish.
As of now, with price ~ ₹472–₹476, the stock is well below weekly pivot → bearish / consolidation regime.
Downside buffer / support lies around ₹470–₹482; a breakdown below that could open further downside risk (unless long‑term support zones hold).
Upside resistance cluster lies at ₹515 → ₹536 → ₹548. To regain bullish momentum, price needs to first clear ₹503–₹515 zone, then aim higher.
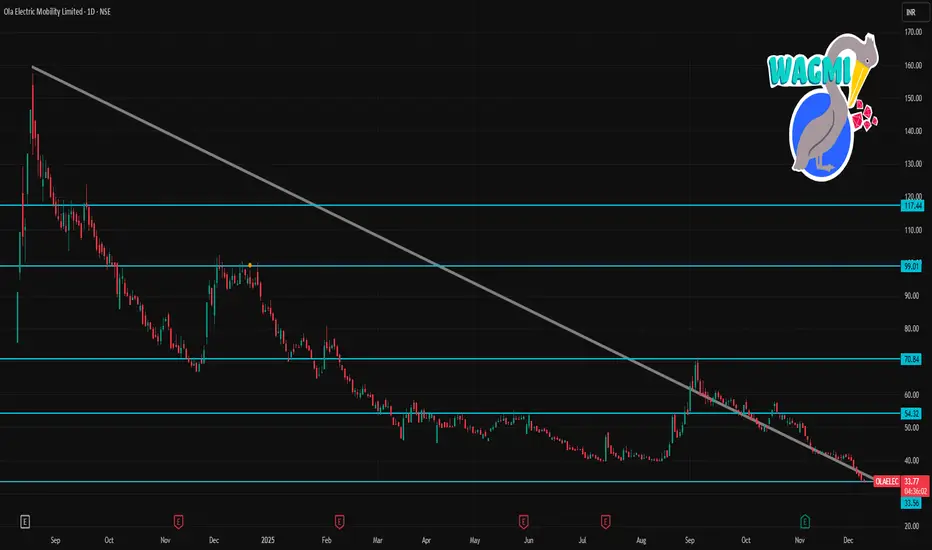
OLAELEC 1 Day Time Frame 📊 Key Daily Levels (Support & Resistance)
From pivot analysis & live technical indicators (today’s data):
Pivot: ~₹34.72
Resistance Levels:
• R1 ~ ₹35.83
• R2 ~ ₹37.56
• R3 ~ ₹38.67
Support Levels:
• S1 ~ ₹32.99
• S2 ~ ₹31.88
• S3 ~ ₹30.15
These are the real-time intraday/daily pivot support & resistance levels traders watch for short term moves.
Alternative pivot data from recent technical sites (slightly different levels):
Pivot: ~₹41.34
Resistance: ~₹41.8 / ₹42.4 / ₹42.9
Support: ~₹40.7 / ₹40.3 / ₹39.7
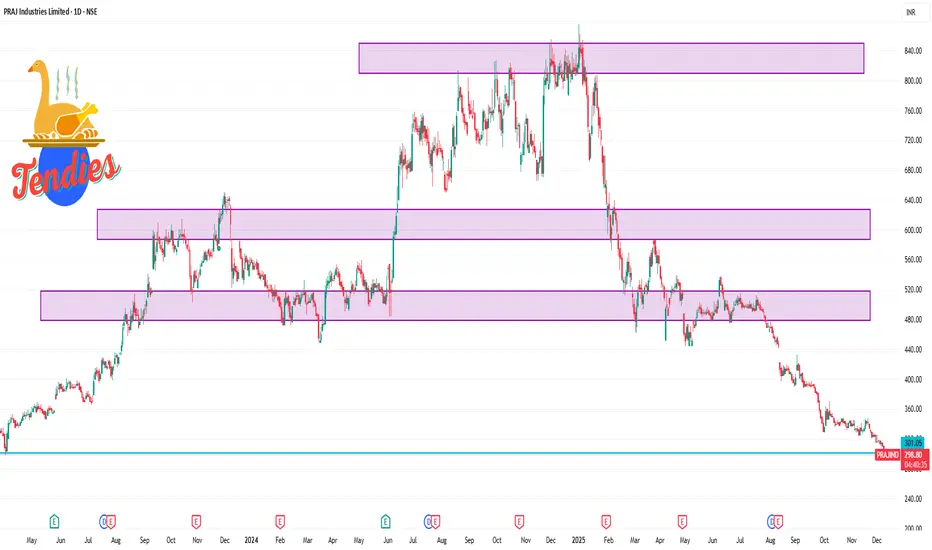
PRAJIND 1 Day Time Frame 📌 Current Live Price & Trend
✅ PRAJIND is trading around ₹300–₹302 on the NSE today (down ~2–3%).
✅ The stock recently hit a new 52-week low, showing a strong bearish trend and weakness.
Market Context (Short-Term Trend):
Price is trading below key moving averages (5D, 20D, 50D, etc.).
This suggests bearish pressure on the 1-day and short-term charts.
📊 1-Day Intraday Levels (Approximate)
🟥 Resistance (Upside Barriers):
R1: ~₹308 – initial resistance near short-term bounce area
R2: ~₹315 – psychological resistance zone
R3: ~₹322 – higher resistance from recent intra-week levels
🟩 Support (Downside Levels):
S1: ~₹297 – immediate intraday support
S2: ~₹290 – lower support from recent swing lows
S3: ~₹280 – significant downside support zone
Options Strategies: Spreads, Straddles, and Iron Condor1. Option Spreads
An option spread involves buying one option and simultaneously selling another option of the same type (call or put) but with different strike prices or expiries. Spreads are primarily used to limit risk, reduce premium cost, or target specific price zones.
Types of Option Spreads
a) Vertical Spreads
A vertical spread uses options with the same expiration date but different strike prices.
There are two kinds:
• Bull Call Spread
Used when the trader is moderately bullish.
Buy a lower-strike call, sell a higher-strike call.
Limits both profit and loss.
Example: Buy 100 CE @ ₹10 → Sell 110 CE @ ₹5 → Net cost ₹5.
• Bear Put Spread
Used when the trader is moderately bearish.
Buy higher-strike put, sell lower-strike put.
Limited profit and limited loss.
Example: Buy 100 PE @ ₹12 → Sell 90 PE @ ₹6 → Net cost ₹6.
• Bear Call Spread
A credit spread for bearish to neutral outlook.
Sell lower-strike call, buy higher-strike call.
Net credit received.
• Bull Put Spread
A credit spread for bullish to neutral outlook.
Sell higher-strike put, buy lower-strike put.
Popular due to high probability of profits.
b) Horizontal (Calendar) Spreads
Calendar spreads use the same strike price but different expiry dates.
When is it used?
When the trader expects low near-term volatility but higher long-term volatility.
It benefits from time decay differences (theta) between near and far expiries.
c) Diagonal Spreads
Diagonal spreads combine both different strikes and different expiries.
Why use them?
To take advantage of both direction and time decay.
More flexible but more complex.
Why Traders Use Spreads
Lower capital requirement.
Defined maximum loss.
Can be structured for any market condition.
Reduce the impact of volatility swings and time decay.
Spreads are ideal for traders who aim for risk-controlled trading instead of outright long or short options.
2. Straddles
A straddle is a highly popular volatility strategy where the trader buys or sells both a call and a put option with the same strike price and same expiry.
a) Long Straddle
Buy 1 Call + Buy 1 Put (ATM).
Used when the trader expects big movement but doesn’t know the direction.
This is a volatility-buying strategy.
Maximum loss = total premium paid.
Profit = unlimited on upside, substantial on downside.
Ideal Conditions
Earnings announcements.
RBI policy decisions.
Major news (mergers, litigation, global events).
Low IV (implied volatility) before expected spike.
Example
NIFTY at 22,000:
Buy 22000 CE @ 120
Buy 22000 PE @ 130
Total cost = ₹250.
If NIFTY moves sharply to either:
22,500 (big CE profit), or
21,500 (big PE profit),
the long straddle gains.
Key Greeks
Vega positive → benefits from IV increase.
Theta negative → loses money from time decay.
b) Short Straddle
Sell 1 Call + Sell 1 Put (ATM).
Used when market is expected to be range-bound with very low volatility.
High risk; unlimited loss potential.
Maximum profit = premiums received.
Why use it?
Only experienced traders use short straddles when:
IV is extremely high.
Market is unlikely to move drastically.
Time decay is expected to be fast.
Short Straddle Risks
Sharp moves can cause heavy losses.
Requires strong risk management and hedge understanding.
3. Iron Condor
An Iron Condor is a neutral, limited-risk, limited-reward option strategy. It combines a Bull Put Spread and a Bear Call Spread.
Structure
Sell OTM Put
Buy further OTM Put
Sell OTM Call
Buy further OTM Call
This creates a structure where the trader profits if the price stays within a range.
Why Traders Love Iron Condors
Designed for markets with low volatility and consolidation.
High probability of winning.
Controlled risk.
Takes advantage of time decay (theta positive).
Payoff Characteristics
Maximum profit occurs when the underlying price stays between the sold call and sold put.
Maximum loss is limited to the width of either spread minus net premium received.
Works best in sideways markets.
Example: NIFTY Iron Condor
Assume NIFTY = 22,000.
Sell 22500 CE
Buy 22700 CE
Sell 21500 PE
Buy 21300 PE
Net credit = Suppose ₹60.
Possible Outcomes
If NIFTY expires between 21,500 and 22,500 → Full profit = ₹60.
If it goes beyond either side → Loss limited to defined spread width.
Ideal Conditions
Market expected to remain in a range.
IV is high before selling, expecting it to fall.
Greeks
Delta neutral
Theta positive (time decay benefits)
Vega negative (falling IV helps)
Comparing the Key Strategies
Strategy Market View Risk Reward Volatility Impact
Vertical Spread Mild bullish/bearish Limited Limited Moderate
Long Straddle High volatility expected Limited Unlimited Needs IV rise
Short Straddle Low volatility expected Unlimited Limited Benefits from IV drop
Iron Condor Sideways / range-bound Limited Limited Benefits from IV drop & theta
How to Choose the Right Strategy
Choosing a strategy depends on:
1. Market Direction
Trending markets → vertical spreads
Unknown direction → straddles
Sideways markets → iron condor
2. Volatility Expectations
IV high? Use credit strategies (short straddle, iron condor).
IV low? Use debit strategies (long straddle, debit spreads).
3. Risk Appetite
Conservative traders: spreads, iron condors.
High-risk traders: short straddles.
Speculators expecting big moves: long straddles.
4. Time Horizon
Short-term: spreads and straddles.
Medium-term: calendar and iron condor.
Conclusion
Spreads, Straddles, and Iron Condors are essential strategies for building an effective options trading system. Each offers unique advantages:
Spreads help control risk and reduce costs.
Straddles capitalize on directional uncertainty and volatility spikes.
Iron Condors profit from sideways markets with predictable risk.
A trader who understands when to apply each strategy based on market behavior, volatility, and risk preference can dramatically improve long-term consistency. Mastering these strategies allows traders to navigate all phases of market conditions—trending, volatile, or stable—using a systematic and well-risk-managed approach.

Building a Trader’s Mindset: Patience, Consistency, Adaptability1. Patience – The Foundation of Professional Trading
Patience is not simply “waiting.” It is disciplined inaction until the right opportunity forms. Impatient traders overtrade, chase moves, react emotionally, and burn capital. Patient traders act only when their edge is present.
Why Patience Matters
Markets are mostly noise. True high-probability setups appear occasionally. A patient trader understands that success comes from waiting for conditions that match their plan. The goal is not to trade more, but to trade better.
Forms of Patience in Trading
Waiting for the right setup
You may scan 50 charts and take only one trade. Professional traders understand that most days are not meant for big profits.
Patience in entry execution
Many traders jump early due to fear of missing out (FOMO). But waiting for confirmation, retests, or volatility cooling often determines whether a trade becomes a winner.
Patience in holding a winning trade
Most traders cut winners early. Patience helps you let the trend unfold and ride profits instead of booking small gains.
Patience during drawdowns
A losing streak is temporary, but the emotional urge to “make back losses fast” destroys accounts. Patience helps you reset mentally.
How to Develop Patience
Trade fewer setups but master them deeply.
Use alerts, so you don’t watch charts constantly.
Define your conditions clearly: “I enter only if X, Y, and Z align.”
Practice delayed gratification—a psychological muscle built over time.
Reward process, not outcome—celebrate discipline, not luck.
Patience builds emotional stability, which becomes the core of all other trading skills.
2. Consistency – The Engine That Drives Growth
Consistency is the ability to follow your process repeatedly—same logic, same rules, same risk control—every single day. A consistent trader becomes predictable to themselves, which makes performance measurable and improvable.
Most traders fail not because their strategy is bad but because they apply it inconsistently.
Why Consistency Matters
Markets produce random short-term outcomes. A strategy may win today and lose tomorrow. Consistency ensures that over time your edge plays out. Without consistency:
Risk fluctuates and results become unpredictable.
Emotions dominate decision-making.
You cannot improve because you don’t know what you did right or wrong.
Your trading becomes luck-based rather than skill-based.
Pillars of Consistency
1. A Clear Trading Plan
A plan defines:
Entry rules
Exit rules
Stop-loss and target criteria
Position size
Market conditions you trade
Without a plan, consistency is impossible.
2. Risk Management Discipline
Risk per trade should remain consistent—usually 1–2% of capital. Changing risk based on emotion leads to uneven results.
3. Time and Routine Consistency
Professional traders have fixed routines:
Pre-market preparation
Chart review
Journaling
Performance tracking
Routine eliminates randomness in behavior.
4. Consistent Emotional Regulation
Traders must behave consistently regardless of:
A big win
A big loss
A news event
A volatile session
This detaches performance from temporary emotional states.
How to Build Consistency
Journal every trade—entry, reason, emotions, outcome.
Review weekly—identify patterns of mistakes.
Automate repetitive tasks—alerts, screeners, watchlists.
Reduce strategy hopping—stick to one system for a long enough sample size.
Focus on incremental improvement, not perfection.
Consistency turns trading into a process-driven profession instead of a gambling activity.
3. Adaptability – Surviving and Thriving in Changing Markets
Markets evolve constantly. What worked in a trending market may fail in a sideways one. Adaptability enables a trader to evolve with conditions, update strategies, and stay relevant.
Why Adaptability Matters
Volatility changes.
Liquidity shifts.
Macro events impact trends.
Algo trading affects speed and structure.
Investor psychology evolves over time.
Rigid traders get left behind. Flexible traders stay profitable.
Traits of Adaptable Traders
Open-Mindedness
They are willing to test new ideas, adjust position sizes, or explore different timeframes when conditions shift.
Awareness of Market Context
Instead of forcing trades, they ask:
“Is the market trending, ranging, reversing, or consolidating?”
Ability to Evolve Strategies
Adaptable traders update systems using data, not emotion.
Emotional Flexibility
They accept being wrong quickly—cutting losses, not defending ego.
How to Develop Adaptability
Study multiple market environments: trending, range-bound, high/low volatility.
Maintain multiple tools (trend-following, mean-reversion, breakout strategies).
Regularly backtest and forward-test strategies.
Observe global macro events and their impact.
Keep a growth mindset—stay curious and upgrade skills.
Avoid rigid beliefs like “this stock must go up” or “this pattern always works.”
Adaptability is about changing when necessary while staying disciplined to core principles.
How These Three Traits Work Together
Patience + Consistency
Patience helps you avoid bad trades.
Consistency ensures you execute your good trades properly.
Together they create stable performance.
Patience + Adaptability
Patience lets you wait for the market to show its conditions.
Adaptability allows you to adjust once those conditions shift.
Consistency + Adaptability
Consistency provides structure.
Adaptability keeps the structure flexible enough to survive changing environments.
All Three Combined
A trader who masters patience, consistency, and adaptability:
Takes fewer but high-quality trades
Controls emotions
Stays calm during volatility
Maintains steady profits
Learns continuously
Avoids catastrophic losses
Improves year after year
This mindset separates professionals from amateurs.
Practical Daily Exercises to Build This Mindset
1. Pre-Market Exercise
Write down:
What setups you will trade today
What you will avoid
Maximum loss allowed
This reinforces patience and consistency.
2. Mid-Day Emotion Check
Ask:
Am I following my plan?
Am I trading emotionally?
Am I forcing trades?
This keeps behavior aligned.
3. Post-Market Review
Journal:
Trades taken
Mistakes
Improvements
Market conditions
This builds adaptability.
4. Weekly Reset
Analyze:
Win rate
Risk-to-reward
Emotional patterns
Strategy performance in current conditions
This helps you evolve with the market.
Conclusion
Building a trader’s mindset takes time. It requires unlearning impulsive habits, developing emotional intelligence, and aligning your behavior with long-term goals. Patience keeps you selective. Consistency keeps you disciplined. Adaptability keeps you relevant.
Trading is not about predicting the market—it is about managing yourself. When your mindset is strong, your strategy becomes powerful. When your emotions are controlled, your results become stable. Master these three mindset pillars, and your journey shifts from random outcomes to structured, repeatable success.

Order Blocks & Smart Money Concepts (SMC)1. Understanding Smart Money vs. Retail Money
Retail traders usually trade based on indicators—RSI, MACD, moving averages—and often enter late or exit early. But institutions (smart money) cannot enter the market with huge volume suddenly. They need liquidity to fill their orders. So smart money:
Creates liquidity pools
Traps retail traders
Pushes price into zones where their orders are waiting
SMC tries to decode this behavior and trade with institutional flow.
The core belief of SMC is:
Price moves from liquidity to liquidity and respects institutional footprints like Order Blocks.
2. What Are Order Blocks?
Order Blocks (OBs) are the final candles where institutional buying or selling took place before a major price move. These candles reflect zones where big players opened positions.
Types of Order Blocks
Bullish Order Block
The last down candle before an impulsive up move (break of structure).
It shows smart money was buying.
Bearish Order Block
The last up candle before an impulsive down move.
It shows smart money was selling.
Why Order Blocks Matter
They represent areas where institutions left unfilled orders.
Price often returns (mitigation) to these areas before continuing in the original direction.
They provide high-probability entry zones with low stop-loss.
Characteristics of a Good Order Block
Strong displacement afterwards (fast, impulsive move)
Break of key market structure
Alignment with liquidity (e.g., sweep before displacement)
Imbalance or Fair Value Gap nearby
Higher timeframe confluence
3. Market Structure in SMC
SMC is heavily based on market structure: identifying the direction of the trend using swing highs and swing lows.
3.1 BOS – Break of Structure
A BOS occurs when price breaks a previous major swing high/low. It confirms trend continuation.
3.2 CHoCH – Change of Character
A CHoCH signals a trend reversal.
Example: In an uptrend, price forms a lower low → CHoCH → possible new downtrend.
Why Structure Matters
Order Blocks are validated only when a BOS or CHoCH occurs after them.
This proves smart money was indeed behind the move.
4. Liquidity in SMC
Liquidity is fuel for price movement. Smart money seeks liquidity to enter and exit positions.
Types of Liquidity
Equal Highs / Equal Lows (Double Tops/Bottoms)
Retail traders place stop orders here → liquidity pools.
Trendline Liquidity
Too-perfect trendlines attract breakout traders.
Buy/Sell Stops
Stops placed above highs or below lows are markets for institutional orders.
Imbalance / FVG Liquidity
Price returns to fill gaps to balance orders.
Liquidity Principle
“Price takes liquidity before reversing.”
This is where Order Blocks come into play—after grabbing liquidity, price mitigates an OB and then continues.
5. Fair Value Gaps (FVG) and Imbalances
An imbalance occurs when price moves so fast that there is insufficient trading between three candles (Candle A, B, C).
These gaps often get filled because smart money needs balanced positions.
FVGs often appear near:
Valid Order Blocks
Breaker Blocks
Mitigation Blocks
When price returns to these gaps, it becomes a high-probability entry.
6. Inducement: Retail Traps Before Real Move
Inducement is a clever liquidity trick used by institutions.
Example:
Price forms a small high near a bigger liquidity zone.
Retail traders enter early.
Smart money uses these small highs/lows as liquidity to tap, then moves to the real target.
Inducements typically appear:
Just before hitting an Order Block
Above equal highs
Below recent swing points
Understanding inducement helps avoid premature entries.
7. Mitigation: Why Price Revisits Order Blocks
After smart money enters the market with heavy orders, not all positions fill immediately.
So they bring price back to the order block to fill remaining orders.
This return is called mitigation.
Mitigation Concepts
Price taps the OB, grabs liquidity, and continues in the main direction.
It removes institutional drawdown.
It confirms OB validity.
A successful mitigation is one of the strongest signals for trend continuation setups.
8. How to Trade With Order Blocks (SMC Strategy)
Below is a simplified but effective approach:
Step 1: Determine Market Direction
Use BOS and CHoCH to identify trend or reversal.
Uptrend → focus on Bullish Order Blocks
Downtrend → focus on Bearish Order Blocks
Step 2: Mark High-Probability Order Blocks
Select Order Blocks that have:
Strong displacement
BOS confirmation
Nearby liquidity sweep (e.g., equal highs taken)
Nearby FVG (imbalance)
Step 3: Wait for Price to Return
Patience is key. Price almost always returns to OB for mitigation.
Place Buy Limit at Bullish OB
Place Sell Limit at Bearish OB
Step 4: Stop-Loss and Take-Profit
SL: Below OB (for bullish), Above OB (for bearish)
TP Levels:
Next liquidity pool
Opposite OB
FVG fill
This ensures positive risk-reward ratios (1:3 or higher).
9. Example: Bullish Order Block Workflow
Price sweeps liquidity below equal lows.
A strong bullish move creates displacement.
A BOS confirms institutional strength.
Identify the last down candle (bullish OB).
Price returns and mitigates OB.
Enter long position.
Target next liquidity pool above.
This is considered a textbook SMC setup.
10. Limitations of SMC
Although powerful, SMC requires practice.
Challenges
Order Blocks appear frequently; choosing the wrong one is common.
Market structure can be subjective for beginners.
Liquidity grabs may fake out traders.
News events disrupt SMC setups.
SMC should always be combined with:
Timeframe confluence
Session timing (London/NY sessions are best)
Risk management rules
11. Why SMC Works
SMC aligns with institutional behavior, making it uniquely accurate for:
Understanding market manipulation
Identifying highly precise entries
Reducing drawdown
Avoiding false breakouts
Trading with low risk, high return
Institutions leave traces—Order Blocks, FVGs, BOS, inducements.
SMC helps retail traders read these footprints.
Conclusion
Order Blocks & Smart Money Concepts (SMC) form a powerful trading framework focused on understanding institutional behavior. By studying liquidity, market structure, BOS, CHoCH, FVG, and mitigation, traders can read the true intention behind major price movements. Order Blocks act as the foundation of SMC, giving precise, low-risk entries aligned with smart money flow. With discipline, patience, and multi-timeframe confluence, SMC becomes one of the most effective and accurate price-action trading methods available today.
Multi-Timeframe Analysis (MTFA)1. Why Multi-Timeframe Analysis Matters
Markets are fractal in nature—meaning price moves in repeating patterns across all timeframes. A trend visible on the 1-hour chart may simply be a pullback on the daily chart. A breakout on the 5-minute chart may be irrelevant when the weekly trend is sideways.
Relying only on one timeframe creates three common issues:
False breakouts: Lower timeframes give misleading breakouts during higher-timeframe consolidations.
Confusion about trend: The trend on a small timeframe often conflicts with the major trend.
Entries without context: Traders enter without understanding key support/resistance or institutional zones.
MTFA solves all these problems by combining macro and micro views to form decisions rooted in context.
2. The Top-Down Approach (The Standard MTFA Process)
Most traders follow a 3-step method:
Step 1: Identify the Main Trend (Higher Timeframe – HTF)
Use Weekly, Daily, or 4H depending on your style.
Here you look for:
Overall trend direction (uptrend / downtrend / range)
Major support and resistance
Market structure (HH, HL, LH, LL)
Long-term supply and demand zones
HTF gives you the “big picture”—the dominant force of the market.
Step 2: Refine the Setup Zone (Middle Timeframe – MTF)
Use Daily-4H, 4H-1H, or 1H-15M depending on the trade.
This timeframe helps confirm:
Trend alignment
Pullbacks
Break of structure
Chart patterns (flags, triangles, channels)
Key levels where entries may occur
MTF filters out low-probability setups and identifies accurate zones.
Step 3: Execute With Precision (Lower Timeframe – LTF)
Use 1H, 15M, 5M, or 1M for exact entries.
This timeframe helps you:
Time entries
Catch liquidity grabs
Place tight stop-losses
Monitor candle patterns (pin bars, engulfing, doji)
Confirm momentum using volume/RSI/stochastic
This is where the actual trade triggers happen.
3. Choosing the Right Timeframes (Based on Trading Style)
Different trading styles require different combinations.
1. Scalpers
HTF: 1H
MTF: 15M
LTF: 1M–5M
Goal: Quick moves, tight SL, small targets.
2. Intraday Traders
HTF: Daily
MTF: 1H
LTF: 5M–15M
Goal: Catch day moves with strong accuracy.
3. Swing Traders
HTF: Weekly
MTF: Daily
LTF: 4H
Goal: Hold trades for days to weeks.
4. Position Traders
HTF: Monthly
MTF: Weekly
LTF: Daily
Goal: Capture major multi-month trends.
The key rule:
The larger timeframe decides trend direction; the smaller timeframe decides entry timing.
4. How MTFA Improves Trading Accuracy
1. Identifying True Trend Direction
A rise on the 15-minute chart may look bullish, but on the daily chart it may be a simple retracement in a strong downtrend. MTFA prevents trading against the dominant direction.
2. Avoiding Market Noise
Lower timeframes contain lots of fake moves (whipsaws). MTFA filters them out by relying on higher-timeframe structure.
3. Improved Entry and Exit
You can wait for precise structure breaks or candle confirmations on smaller timeframes while holding the higher-timeframe bias.
4. Better Risk Management
Since entries become more accurate, stop-loss distance reduces while keeping the same reward potential, thus improving risk-to-reward ratio (RRR).
5. Practical MTFA Example (Bullish Scenario)
Let’s say you are analyzing a stock or index.
Weekly Chart
Showing a clear uptrend (higher highs and higher lows).
Price currently retracing toward a major support zone.
Bias: Long (buy).
Daily Chart
Shows a bullish reversal pattern—like a double bottom or bullish engulfing candle.
Market structure shifts from lower lows to higher lows.
Bias strengthened: Prepare for long entries.
1-Hour Chart
Shows break of a short-term downward trendline.
A pullback retests a demand zone.
Entry triggers form: pin bar, engulfing, volume spike.
Execution: Enter long with confidence.
Here:
HTF gave direction.
MTF confirmed reversal.
LTF gave precision timing.
6. Understanding Conflicts Between Timeframes
Sometimes timeframes disagree:
Daily is bullish, but 1H is bearish.
4H shows consolidation, but 15M shows breakouts.
This is normal.
Rule:
The higher timeframe always overrides the lower timeframe.
If the HTF is bullish and LTF is bearish, the bearish move is likely a retracement—not a reversal.
Only when HTF breaks its structure should you consider changing bias.
7. Tools and Indicators Used in MTFA
MTFA does not depend on indicators, but indicators can support analysis.
Useful Tools
Price Action & Candlestick Patterns
Market Structure (HH, HL, LH, LL)
Support & Resistance Levels
Trendlines & Channels
Supply and Demand Zones
Helpful Indicators
Moving Averages (20/50/200) – for trend confirmation
RSI or Stochastic – for momentum and overbought/oversold
Volume – confirms strength of breakouts
MACD – for trend shifts
Key rule:
Indicators can support, but higher timeframe structure must lead the analysis.
8. Common MTFA Mistakes to Avoid
1. Overusing Too Many Timeframes
Using more than 3–4 creates confusion.
Stick to a simple framework: HTF + MTF + LTF.
2. Taking Trades Against the Higher-Timeframe Trend
This results in low-probability trades.
3. Forcing Breakouts on Small Timeframes
A breakout on 5M may be meaningless if the daily timeframe is in a strong range.
4. Not Waiting for Alignment
All timeframes must agree before entering.
5. Ignoring Key Levels
Higher-timeframe S/R zones are where major institutions trade.
9. Benefits of Mastering MTFA
Increases trade accuracy
Reduces emotional trades
Provides clear market structure
Helps catch major moves
Improves reward-to-risk
Builds professional-level discipline
Works in any market (stocks, forex, crypto, commodities, indices)
10. Summary of Multi-Timeframe Analysis
MTFA combines higher, middle, and lower timeframe views.
Higher timeframe shows trend and major levels.
Lower timeframe shows entry and precision.
MTFA avoids noise, false breakouts, and misleading signals.
It enhances risk management and trade quality.
All successful traders use MTFA, from scalpers to swing traders.
Bank Nifty – Head & Shoulders Breakdown AnalysisPattern: Head & Shoulders
Status: Neckline breakdown confirmed
Elliott Wave Position: End of Wave 5, beginning corrective wave.
Indicators: Bearish RSI + MACD divergence
Indicators Supporting the Breakdown
🟣 RSI Divergence
Clear bearish divergence between price (higher highs) and RSI (lower highs).
RSI now breaking mid-level (50), confirming shift from bullish → neutral → bearish momentum.
🔵 MACD Structure
MACD shows multiple negative divergences during right shoulder formation.
Bearish crossover already done.
Histogram contracting further indicates strengthening downside momentum.
Expected corrective move → ABC decline to at least Wave 4 price territory.
Wave 4 region sits around 57,500 – 58,000, matching H&S target
Trend Bias: Short-term bearish until retest of neckline or completion of A-wave drop.

Market Participants: Retail, FII, DII, HNI & Market Makers1. Retail Investors
Retail investors are individual, non-professional participants who invest their personal capital in stocks, mutual funds, derivatives, or other financial instruments. They are the largest group in terms of numbers but typically hold small portions of total market capitalization.
Key Characteristics
Invest smaller amounts compared to institutions
Use brokers, mobile apps, and trading platforms
Often influenced by news, trends, macro events, and market sentiment
Tend to have shorter time horizons, especially in intraday and swing trading
Behaviour sometimes driven by emotions like fear and greed
Role in the Market
Retail participation adds diversification and liquidity, especially in mid-cap and small-cap stocks. During bull markets, retail traders often amplify momentum, while in bear markets, panic selling from retail segments may accelerate declines.
Strengths
Agile and quick to enter or exit
Access to vast free learning materials and trading tools
Ability to participate in IPOs, ETFs, and systematic investment plans (SIPs)
Weaknesses
Limited capital
High risk of emotional decision-making
Often lack deep research or institutional-grade analytics
Despite limitations, retail participation has dramatically increased due to digital broking, lower costs, and financial awareness.
2. Foreign Institutional Investors (FIIs)
Foreign Institutional Investors include global funds, hedge funds, pension funds, sovereign wealth funds, and international asset managers who invest in Indian markets. They trade large volumes and are among the most influential market movers.
Key Characteristics
Very large capital base
Data-driven, research-driven, algorithmic, and sophisticated
Focus on long-term macro trends—GDP growth, interest rates, inflation, and currency movement
Their inflows/outflows cause significant swings in index levels
Impact on Markets
FIIs play a dominant role in Indian equity and debt markets. When FIIs buy heavily, markets usually rise due to high liquidity infusion. When they sell, markets often see corrections.
What Influences FIIs?
Global interest rates (especially US Fed)
Geopolitical stability
Exchange rate (INR vs USD)
Corporate earnings in emerging markets
Global risk appetite (risk-on vs risk-off sentiment)
Strengths
Access to advanced models, research, and analytics
Ability to influence sectors like banking, IT, and large-cap indices
Long-term disciplined investing strategies
Risks
FIIs can pull money suddenly, causing sharp volatility
Their decisions often depend on global—not domestic—factors
Heavy dependence on currency fluctuations
FIIs bring credibility and stability but also volatility when exiting in large quantities.
3. Domestic Institutional Investors (DIIs)
Domestic Institutional Investors include Indian mutual funds, insurance companies, banks, pension funds, and other local financial institutions. DIIs have grown rapidly in the last decade due to rising SIPs and increased financial literacy.
Key Characteristics
Large domestic capital base
Often counterbalance FII moves
Long-term view aligned with Indian economic growth
Invest systematically through mutual fund inflows
Examples include LIC, SBI Mutual Fund, HDFC Mutual Fund, ICICI Prudential, UTI, etc.
Role in Market Stability
DIIs play a stabilizing role, especially when FIIs sell aggressively. Their consistent inflows help maintain market confidence. For example, during global uncertainty periods, DIIs often cushion sharp falls.
Strengths
Strong understanding of domestic economic conditions
Long-term approach reduces volatility
Backed by consistent retail SIP inflows
Weaknesses
May follow conservative strategies
Sometimes influenced by government or regulatory constraints
Less aggressive compared to FIIs in certain sectors
Overall, DIIs are becoming increasingly powerful and are expected to dominate long-term market behavior in India.
4. High-Net-Worth Individuals (HNIs)
HNIs are individuals with substantial personal wealth (typically ₹5 crore+ net worth). They actively participate in equity, derivatives, PMS (Portfolio Management Services), AIFs (Alternative Investment Funds), and IPOs.
Key Characteristics
Invest large personal capital
Often use professional advisors or portfolio managers
Strong presence in pre-IPO placements, SME IPOs, and block deals
Engage in high-risk strategies like derivatives, arbitrage, and leveraged trades
Market Influence
Though smaller than FIIs/DIIs in size, HNIs influence short-term trends, especially in:
IPO subscriptions (NII category)
Penny stocks and small caps
High-volume derivative positions
Strengths
Flexibility like retail, power like institutions
Can take concentrated bets
Access to exclusive opportunities (AIFs, PMS, private equity)
Weaknesses
Risk of overexposure due to large positions
Sensitive to market cycles
May follow speculative strategies
HNIs bridge the gap between retail traders and large institutions.
5. Market Makers
Market makers are financial institutions or professionals who provide continuous buy and sell quotes in the market to ensure liquidity. They are essential for smooth trading, especially in derivatives, ETFs, currency markets, and less-liquid stocks.
Key Characteristics
Quote both Bid (buy) and Ask (sell) prices
Profit from the bid-ask spread
Use algorithmic and high-frequency trading systems
Licensed or registered under exchange rules
Examples include global firms like Virtu Financial, Citadel Securities, and domestic brokerage proprietary desks.
Role in the Market
Ensure liquidity by always being ready to trade
Reduce volatility by narrowing price gaps
Help large trades get executed smoothly
Vital for ETFs—without them, ETF prices may not track underlying assets
Strengths
High-speed execution
Deep risk management systems
Help maintain orderly markets
Risks
Exposed to sudden volatility during black-swan events
Algorithm failures can cause temporary mispricing
Spread-based profits reduce in highly efficient markets
Without market makers, many securities would suffer from low liquidity and high transaction costs.
How These Participants Interact
Markets behave like a battlefield of different capital sizes and intentions:
FIIs drive major trends with large inflows/outflows.
DIIs stabilize markets with consistent buying during volatility.
HNIs move selectively, especially in IPOs and derivatives.
Retail investors amplify momentum in trending markets.
Market makers maintain liquidity, enabling smooth execution.
Their combined actions create price discovery, the fundamental mechanism determining stock prices.
Final Thoughts
Understanding market participants helps traders decode price movements more logically. Retail traders often observe FII–DII data, volume patterns, and liquidity behavior to align their trades. FIIs and DIIs shape long-term trends, HNIs influence medium-term sentiment, and market makers ensure constant liquidity.
As markets mature, the interaction among these participants becomes more dynamic, making it essential for investors to study their behavior to improve decision-making, timing, and risk management.

Mahindra & Mahindra: Reversing Gears—Short Drive Toward 3400”Mahindra & Mahindra is showing clear signs of Smart Money distribution on the higher timeframe. Price has tapped into a major HTF supply zone around 3600–3650, where institutional selling previously originated. The recent sweep of the highs looks like a classic liquidity grab, engineered to trap late buyers before a potential reversal.
After the liquidity sweep, price failed to sustain above premium pricing and has started shifting structure. The transition from a bullish market structure to a bearish market structure shift (MSS) suggests that Smart Money may be positioning for a downside move.
Internal liquidity beneath recent swing lows provides an ideal drawdown target, with the next significant HTF demand zone resting near the 3400 level—aligning perfectly with your short target.
As long as price remains in the premium zone and below the supply region, the setup favors short positions with expectation of price delivery toward the 3400 imbalance + demand confluence.
Happy Trading

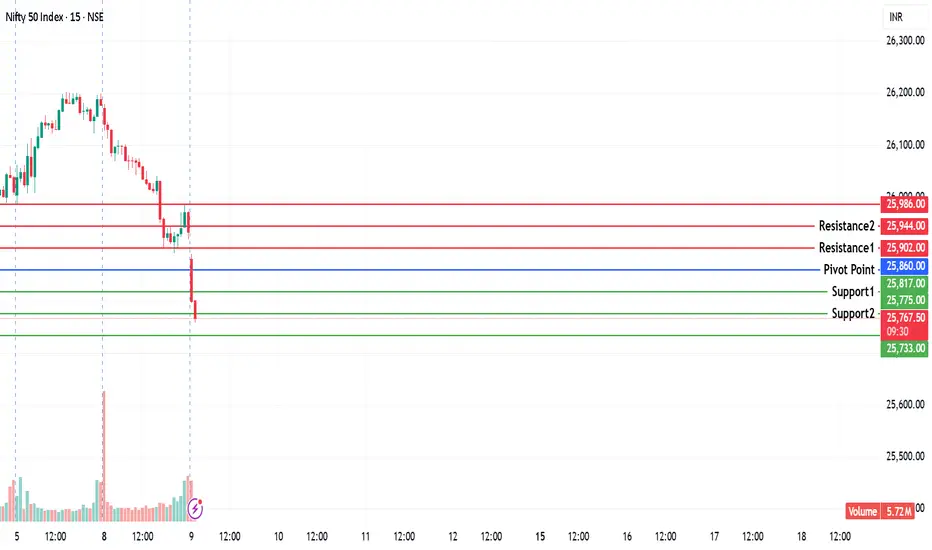
NIFTY KEY LEVELS FOR 09.12.2025NIFTY KEY LEVELS FOR 09.12.2025
Timeframe: 3 Minutes
If the candle stays above the pivot point, it is considered a bullish bias; if it remains below, it indicates a bearish bias. Price may reverse near Resistance 1 or Support 1. If it moves further, the next potential reversal zone is near Resistance 2 or Support 2. If these levels are also broken, we can expect the trend.
When a support or resistance level is broken, it often reverses its role; a broken resistance becomes the new support, and a broken support becomes the new resistance.
If the range(R2-S2) is narrow, the market may become volatile or trend strongly. If the range is wide, the market is more likely to remain sideways
please like and share my idea if you find it helpful
📢 Disclaimer
I am not a SEBI-registered financial adviser.
The information, views, and ideas shared here are purely for educational and informational purposes only. They are not intended as investment advice or a recommendation to buy, sell, or hold any financial instruments.
Please consult with your SEBI-registered financial advisor before making any trading or investment decisions.
Trading and investing in the stock market involves risk, and you should do your own research and analysis. You are solely responsible for any decisions made based on this research
Gold Stuck in Consolidation Ahead of FOMCGold just trading in sideways right now, stuck between 4,175 and 4,200 while everyone waits on tomorrow's FOMC. Current price around 4,194 is basically dead center of this range classic indecision. Nobody wants to make a move until Powell speaks.
Technically, it's pretty straightforward. If we push higher, there's resistance sitting at 4,240 4,255 that's been holding back rallies all week. On the flip side, a break below here targets the 4,100-4,120 support area .
The 25bp cut is basically a done deal. What traders actually care about is what Powell says about next year. Is the Fed done after this, or are more cuts coming? That's the real question, and nobody knows the answer yet.
So we're stuck in this boring chop. Volume's light, moves get faded quickly, and it's just back and forth noise. Honestly, it's the kind of price action that kills your soul if you're trying to trade it. Better to sit tight and wait for the Fed to give us some actual direction. Could rip through 4,240 if Powell's dovish, or dump to 4,100 if he sounds hawkish. Until then, it's just a waiting game.
