Algorithmic Trading vs AI Trading1. Definition and Core Concepts
Algorithmic Trading (Algo Trading):
Algorithmic trading refers to the use of predefined, rule-based computer programs that execute trading orders based on quantitative criteria such as price, volume, time, and other market parameters. The algorithms are explicitly programmed to follow certain logic—for instance, “buy 100 shares of stock X if its price drops by 2% within an hour.”
Key characteristics of algorithmic trading:
Rule-based: Every instruction is manually coded and deterministic.
Speed and efficiency: Algorithms can execute trades in milliseconds, far faster than human capability.
Backtesting: Traders can test strategies against historical data to optimize performance.
Risk reduction: Algorithms reduce the influence of human emotions such as fear and greed.
Common algorithmic trading strategies include:
Trend-following strategies: Buying or selling assets based on moving averages or momentum.
Arbitrage strategies: Exploiting price differences between markets or assets.
Market-making strategies: Placing simultaneous buy and sell orders to capture spreads.
Mean reversion strategies: Assuming that prices will revert to their historical average.
AI Trading (Artificial Intelligence Trading):
AI trading, on the other hand, involves the use of machine learning, deep learning, natural language processing (NLP), and other AI techniques to identify trading opportunities, make predictions, and adapt strategies over time. Unlike traditional algorithms, AI trading systems are capable of learning from data, discovering patterns that may not be apparent to humans, and adjusting their behavior autonomously.
Key characteristics of AI trading:
Adaptive learning: AI models improve over time by analyzing past trades and market data.
Pattern recognition: Machine learning can detect complex, nonlinear relationships in data.
Unstructured data analysis: AI can process news articles, social media, financial reports, and macroeconomic indicators to inform decisions.
Predictive capabilities: AI models aim to forecast market trends, volatility, and asset price movements.
Examples of AI trading techniques include:
Reinforcement learning: AI agents learn to maximize returns by trial and error in a simulated market environment.
Neural networks: Deep learning models capture intricate patterns in historical price data for predictive trading.
Sentiment analysis: NLP algorithms gauge market sentiment from news, earnings calls, or social media.
2. Key Differences
Feature Algorithmic Trading AI Trading
Decision-making Rule-based, deterministic Data-driven, adaptive
Flexibility Limited to predefined rules Learns and adapts to new data
Data types Structured market data (prices, volumes) Structured + unstructured data (news, social media, alternative datasets)
Learning ability No self-learning Machine learning enables continuous improvement
Complexity Moderate to high (depends on strategy) High; often requires advanced ML/DL models
Predictive power Based on statistical models, historical patterns Can predict trends, volatility, and market sentiment
Human intervention Required to update rules Minimal; AI adapts autonomously
Example use case High-frequency trading (HFT), arbitrage Portfolio optimization, predictive trading, sentiment-based strategies
3. Advantages and Limitations
Algorithmic Trading Advantages:
Speed: Executes trades in milliseconds, taking advantage of fleeting market inefficiencies.
Consistency: Removes emotional biases in trading.
Transparency: Traders know exactly what rules are being followed.
Backtesting efficiency: Easy to test strategies against historical data.
Algorithmic Trading Limitations:
Rigidity: Cannot adapt to new market conditions unless manually updated.
Limited data utilization: Cannot process unstructured data like news or social media sentiment.
Predictive limitations: Works well in stable, rule-following markets but struggles in highly volatile or unprecedented conditions.
AI Trading Advantages:
Adaptive and intelligent: Learns from evolving market conditions.
Handles complex data: Capable of integrating multiple data sources for trading decisions.
Predictive capability: Can forecast price movements and volatility.
Potential for higher alpha: Sophisticated AI models can uncover hidden trading opportunities.
AI Trading Limitations:
Complexity and cost: Requires advanced computational resources and expertise in data science.
Transparency issues: Deep learning models are often “black boxes,” making decision rationale unclear.
Overfitting risk: AI models may perform well on historical data but fail in live markets if not properly validated.
Data dependency: Quality and quantity of data directly affect performance.
4. Applications in Financial Markets
Algorithmic Trading Applications:
High-Frequency Trading (HFT): Buying and selling within milliseconds to profit from tiny price discrepancies.
Institutional Trading: Execution of large orders while minimizing market impact.
Arbitrage and statistical strategies: Capitalizing on predictable price differences across assets and markets.
AI Trading Applications:
Predictive analytics: Forecasting stock prices, forex trends, or commodity movements.
Sentiment-driven trading: Using news and social media data to guide buy/sell decisions.
Portfolio optimization: AI models help balance risk and returns in investment portfolios.
Algorithmic strategy enhancement: AI can optimize existing algorithms by fine-tuning parameters based on real-time learning.
5. Future Outlook
The evolution from algorithmic trading to AI trading reflects the broader trend in finance toward data-driven, intelligent decision-making. While algorithmic trading continues to dominate areas like high-frequency execution and market-making, AI trading is gaining traction for predictive analytics, adaptive strategies, and processing alternative data sources.
Hybrid approaches are also emerging, where AI augments traditional algorithmic strategies. For instance, an algorithmic trading system may follow predefined rules but uses AI to dynamically adjust parameters based on market conditions, enhancing performance without sacrificing the reliability of deterministic logic.
As AI technologies—such as reinforcement learning, transformer models, and multi-agent simulations—become more sophisticated, AI trading is expected to move from experimental use cases to mainstream adoption, potentially reshaping investment management, hedge fund strategies, and even retail trading.
6. Conclusion
In summary, algorithmic trading is a rule-based, deterministic approach relying on speed and predefined strategies, ideal for stable, quantifiable market conditions. AI trading, in contrast, is adaptive, data-driven, and capable of learning and evolving over time, providing predictive power and the ability to analyze complex, unstructured datasets. Both have unique advantages and limitations, and the future of trading is likely to see a convergence where AI enhances algorithmic strategies, creating smarter, faster, and more resilient financial systems.
Understanding these differences is crucial for traders, investors, and financial technologists who aim to leverage modern technology for sustainable market advantage. While algorithms execute with precision, AI brings intelligence to execution, marking the next frontier in financial innovation.
X-indicator

XAUUSD – Bullish trend, focus on Buy pullbacks to 5,700Market Context (M30)
Gold continues to trade in a strong bullish continuation after a clean impulsive leg higher. The recent consolidation above former resistance shows acceptance at higher prices, not exhaustion. This behavior suggests the market is rebalancing liquidity before the next expansion leg.
On the macro side, USD remains under pressure, while safe-haven demand stays firm. Even though bond yields are relatively stable, capital flows continue to favor gold, keeping the upside bias intact.
➡️ Intraday bias: Bullish – trade with the trend, not against it.
Structure & Price Action
• Market structure remains bullish with Higher Highs – Higher Lows
• Previous resistance has flipped into demand and is being respected
• No bearish CHoCH or structural breakdown confirmed
• Current pullbacks are corrective moves within an active uptrend
Key takeaway:
👉 As long as price holds above key demand, pullbacks are opportunities for continuation.
Trading Plan – MMF Style
Primary Scenario – Buy the Pullback
Patience is key. Avoid chasing price into extensions.
• BUY Zone 1: 5,502 – 5,480
(Minor demand + short-term rebalancing zone)
• BUY Zone 2: 5,425 – 5,400
(Trendline support + deeper liquidity zone)
➡️ Only execute BUYs after clear bullish reaction and structure confirmation.
➡️ No FOMO at highs.
Upside Targets
• TP1: 5,601
• TP2: 5,705 (upper Fibonacci extension / expansion target)
Alternative Scenario
If price holds above 5,601 without a meaningful pullback, wait for a break & retest to join the next continuation leg.
Invalidation
A confirmed M30 close below 5,400 would weaken the bullish structure and require reassessment.
Summary
Gold remains in a controlled bullish expansion supported by both structure and macro flow. The edge lies in discipline — buying pullbacks into demand while the trend stays intact, not predicting tops.
➡️ As long as structure holds, higher prices remain the path of least resistance.

GMDCLTD 1 Day View 📌 Live / Latest Price (approx)
Current NSE Price: ~₹568–₹572 range at latest update.
📊 Daily Pivot, Support & Resistance Levels
(Based on recent pivot calculations for the daily timeframe)
🔵 Pivot (central reference)
Daily Pivot: ~₹566.1–₹572.3 – key mid-point for bias.
🟥 Resistance Levels (Upside Targets)
R1: ~₹571.8–₹575.1
R2: ~₹575.1–₹586.0
R3: ~₹580.8–₹607.5
(Strong upside barriers where price may face selling pressure)
🟩 Support Levels (Downside Floors)
S1: ~₹562.8–₹562.9
S2: ~₹557.1–₹560.6
S3: ~₹553.8–₹548.9
(Important near-term supports on the daily chart)
How to read these:
Above Pivot → bullish bias
Below Pivot → bearish bias
Break & sustain above R1/R2 → potential to test R3
Fail near Resistance or break below S1 → watch deeper supports
📌 Intraday Trading Range
Based on observed price action today (intraday high/low so far):
Day High: ~₹576–₹577
Day Low: ~₹559–₹560
This range offers a reference for intraday support/resistance — trade setups often consider failing below the low or breaking above the high for momentum plays.

BitcoinIn this chart we clearly see that bitcoin is about to end its impulse 5th wave in upcoming days..
After that we can see sharp reversal on bullish side
Disclaimer:- Invest at your own risk,, i am not register with Sebi.. This chart is according to my technical analysis which i learnt from past years

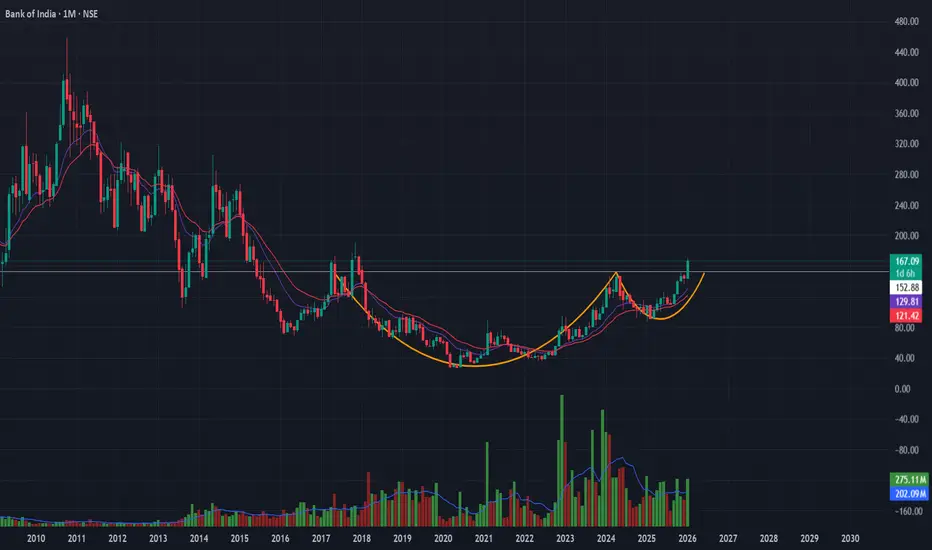
Bank of India | Cup & Handle Breakout SetupStructure:
Long-term Cup & Handle pattern nearing completion on monthly timeframe, indicating accumulation after a prolonged base.
Confirmation Signals:
-Volume expanding on rallies
-RSI above 50 and rising
-OBV trending higher → accumulation visible
-Price holding above short-term EMAs
Trade Plan:
-Buy: Sustained breakout above ₹151
-Targets: ₹199 → ₹268
-Stop-loss: ₹134 (ATR-based, structure-valid)
-Risk–Reward: ~1:5
USD/JPY Intraday Short – Liquidity Sweep & Shift in Market STRFollowing a period of distribution near the 153.750 level, price has shown a clear rejection of recent highs, likely sweeping buy-side liquidity (BSL) before breaking lower.

Nifty Realty - An Ignored HIDDEN GEM at solid Risk RewardThis is a ratio chart of Nifty Realty compared to NSE 500
A classic cup formation is being seen on multi year level where nifty realty is in a rising channel formation making higher lows for past 2-3 times since covid
Right now index has taken support again at channel low and reversal looks likely
A series of higher lows, increasing volumes, rising channel and a cup formation all together indicate good solid bullishness on real estate stocks outperforming cnx 500.

NIFTY TREND UPDATIONIn Nifty options trading, a significant increase in Put Open Interest (OI) is a double-edged sword that requires careful technical confirmation. From the perspective of "Smart Money" (option writers), rising Put OI generally builds a floor of Support, as institutional sellers are betting the index will stay above that level to collect premiums. However, your observation is correct: if Nifty is trading near a resistance zone or a trendline, an increase in Put OI alone does not automatically reflect positive strength.
If the index breaks below its established trendlines despite the rising Put OI, it often triggers a "Long Unwinding" or a "Short Buildup" scenario. In this case, Put sellers who were providing support are forced to cover their positions to limit losses, which creates a cascade of selling pressure, leading to a sharp fall. Conversely, if Nifty holds above resistance while Put OI climbs, it confirms that the "floor" is moving higher, potentially leading to a breakout. Without a clear move above resistance, however, the heavy Put OI might simply indicate aggressive hedging or a range-bound market rather than true bullish momentum. Always look for price action to lead the way; OI only tells you where the bets are placed, not which side will eventually win.

VEDL - Multi year breakoutThis a 3M time frame chart. Simple, clean and elegant. Please note this a very broad time frame chart so this cannot be a swing trade or short term trade, the minimum time of investment should be 6M.
We can target a return in the range of 60%-100%

NIFTY KEY LEVELS FOR 29.01.2026NIFTY KEY LEVELS FOR 29.01.2026
Timeframe: 3 Minutes
If the candle stays above the pivot point, it is considered a bullish bias; if it remains below, it indicates a bearish bias. Price may reverse near Resistance 1 or Support 1. If it moves further, the next potential reversal zone is near Resistance 2 or Support 2. If these levels are also broken, we can expect the trend.
When a support or resistance level is broken, it often reverses its role; a broken resistance becomes the new support, and a broken support becomes the new resistance.
If the range(R2-S2) is narrow, the market may become volatile or trend strongly. If the range is wide, the market is more likely to remain sideways
please like and share my idea if you find it helpful
📢 Disclaimer
I am not a SEBI-registered financial adviser.
The information, views, and ideas shared here are purely for educational and informational purposes only. They are not intended as investment advice or a recommendation to buy, sell, or hold any financial instruments.
Please consult with your SEBI-registered financial advisor before making any trading or investment decisions.
Trading and investing in the stock market involves risk, and you should do your own research and analysis. You are solely responsible for any decisions made based on this research.

Nifty50 analysis(29/1/2026).CPR: narrow + ascending cpr: trending day.
FII: 480.26 bought
DII: 3,360.59 bought.
Highest OI: 25500and25300 put oi and 25300 and 25200 call oi.
P.C.R: 0.8 mild bullish.
Resistance:25500.
Support : 25150
conclusion:
My pov:
1.the first price resistance is 25450 if it crossed then bulish.
2.until 24900 is crossed below down only bullish pov.
3.today trending day so plan accordingly.
What IF:
1.if price breaks 24900 and closed in day candle then overall trend continues.
2.bullishness continues if it crossed 25450.
psychology fact:
embrace uncertainty, become skilled don't wait, go for it.
note:
8moving average ling is blue colour.
20moving average line is green colour
50moving average line is red colour.
200moving average line is black colour.
cpr is for trend analysis.
MA line is for support and resistance.
Disclaimer:
Iam not Sebi registered so i started this as a hobby, please do your own analysis, any profit/loss you gained is not my concern. I can be wrong please do not take it seriously thank you.

Range 25050 to 26000 POSITIVE NIFTY PCR
>1 SELLING PRESSURE" is key. Most retail traders buy options, but the "Smart Money" (Institutions) usually sells them.
If Call OI Change is much higher than Put OI Change, the "sellers" are dominating the upside, expecting the market to stay down or sideways.
The PCR (Put-Call Ratio) Change helps you see if the sentiment is shifting. If the PCR Change is decreasing, the market is becoming more bearish relative to the previous day.
Interpreting Data
Looking at the "OTM ONLY" (Out-of-the-Money) section , we can see how professional "sellers" are positioning themselves:
Metric Observation Market Sentiment
Sum of Call OI Change High positive values (e.g., 750,461) Aggressive Call writing. Traders are betting on a "ceiling" for the price.
Sum of Put OI Change Moderate positive value Moderate Put writing. Some support is forming, but it's weaker than the resistance.
PCR OI Change Values like 0.22 When this is low, it indicates the day was dominated by Call additions, suggesting a Bearish or cautious outlook.

#NIFTY Intraday Support and Resistance Levels - 29/01/2026Nifty is expected to open on a flat to mildly positive note, indicating stability after the recent recovery from lower levels. The index is currently trading around the 25340–25350 zone, which is an important intraday pivot. A flat opening near this level suggests that the market is waiting for fresh cues before committing to a directional move. Volatility may remain moderate in the initial phase, with price action largely driven by how Nifty behaves around key support and resistance zones.
From a technical structure point of view, Nifty has shown a decent pullback from the 25000 support area, where strong buying interest was seen earlier. This bounce indicates that buyers are still active at lower levels. However, the upside is capped near the 25450–25500 resistance zone, which has repeatedly acted as a supply area. Until this zone is decisively broken, the index may continue to trade in a defined range, offering selective intraday opportunities rather than trending moves.
On the bullish side, if Nifty manages to sustain above 25250 on a 15-minute closing basis, it would indicate strength and continuation of the short-term upmove. In this scenario, long positions can be considered above 25250 with an initial target of 25350. If momentum builds further, the index can move toward 25400 and then 25450+, where partial profit booking is advisable due to expected selling pressure. A strong close above 25450 would further improve the bullish outlook for the coming sessions.
On the downside, failure to hold above 25200 would weaken the immediate structure. If Nifty breaks and sustains below 25200, it may trigger a short-term correction. In such a case, downside targets of 25100 and 25050 come into play, followed by the psychological 25000 level. The 25000–25050 zone remains a crucial support area, where fresh buying or a reversal attempt can be expected. A clean breakdown below 25000 would increase bearish momentum and may lead to deeper correction, though that seems less likely without strong negative cues.
For intraday traders, the zone between 25200 and 25250 should be treated as a wait-and-watch area, as price action here can be choppy and directionless. The best trades are expected only after a clear breakout above resistance or a confirmed breakdown below support. Strict stop-loss, partial profit booking, and disciplined position sizing are essential, as the market is still in a consolidation-to-reversal phase rather than a strong trend.
Overall, Nifty is positioned at a crucial juncture. Holding above 25250 keeps the bias mildly positive, while a break below 25200 shifts the bias toward a short-term corrective move. The session is likely to reward traders who focus on levels, confirmation, and risk management rather than aggressive directional bets.

#BANKNIFTY PE & CE Levels(29/01/2026)Bank Nifty is expected to open flat, indicating a pause in momentum after the recent sharp recovery from lower levels. Such flat openings generally signal indecision in the market, especially when the index is trading close to an important resistance zone. At present, Bank Nifty is hovering near the 59550–59600 area, which has acted as a strong supply zone in recent sessions. This makes today’s trade more level-driven, with higher chances of range-bound movement and sudden volatility around key levels.
From a broader structure perspective, the index has bounced strongly from the sub-58500 region, mainly due to short covering. However, as price approaches higher resistance zones, fresh buying strength needs confirmation. Until that happens, the market may either consolidate in a narrow range or show false breakouts followed by quick reversals. Traders should avoid anticipating moves and instead react to confirmed price action.
On the bullish side, if Bank Nifty manages to sustain above 59550 on a 15-minute closing basis, it would indicate that buyers are gaining control despite the overhead supply. In such a scenario, call options can be considered above 59550. The first upside target would be around 59750, which is a minor resistance and a good zone for partial profit booking. If momentum continues, the next levels to watch are 59850 and then 59950 or higher. Near the 60000 psychological level, strong profit booking is expected, so trailing stop-loss becomes crucial for long positions.
On the bearish side, failure to hold above 59550 followed by a breakdown below the 59450–59400 zone would indicate rejection from higher levels. This would open the door for a corrective move. In that case, put options can be considered around 59450–59400. The immediate downside targets would be 59250 and then 59150. If selling pressure increases, the index could drift toward the 59050–59000 support zone. A clear break below 59050 would weaken the structure further, though such a move would likely require negative global cues or heavy institutional selling.
For intraday traders, the zone between 59450 and 59550 should be treated as a no-trade area, as price action here can be choppy and misleading. The best trades are expected only after the market shows clear acceptance above resistance or below support. Partial profit booking at every target and strict risk management are essential due to the possibility of sudden spikes on either side.
Overall, Bank Nifty is at a crucial decision point. Sustained trade above 59550 favors bullish continuation, while rejection and breakdown below 59400 may lead to a pullback. The session is likely to be volatile but structured, rewarding traders who stick to levels, wait for confirmation, and avoid emotional or over-leveraged positions.

CADJPY 2HR T/F ANALYSIS --- WE NEAD A RETESTING FOR SELL SIDE
📊 Market Structure Explanation (cadjpy – 2hr)
the structure are clear look like a strong bearish formation:- in this selling trend we can se imbalance also and our strong supply of previous demand which are marked clearly into green color they demand copy and past on recent demand bottom to top and now we have a retesting area :-
🔍 What the market can do next:-
Scenario 1 – Pullback / retesting (Needs Confirmation):
For any meaningful retesting to occur, the market must first show clear bearish candlestick confirmation.
This includes patterns such as:
Bearish engulfing candles
Strong rejection wicks (upper shadows)
Evening star formations
Consecutive bearish closes
Long upper-wick rejection candles showing selling pressure
Without these bearish structures, any downside move should be treated as a temporary pullback, not a retesting.
Scenario 2 – Continuation:
If buyers stay strong and bearish confirmation does not appear, price can break above this zone and continue higher with another impulsive bullish move.
Scenario 3 – Range formation:
Market may form a small sideways structure near this level before choosing a clear direction.
🧭 Summary:
The trend is bearish, but price is at a sensitive resistance zone.
Retesting is only valid if bearish candlestick patterns and selling pressure appear.
Otherwise, the structure favors continuation or short-term consolidation before the next move.

EURUSD to test the highs !!ICT Concepts: Price delivering out of a 1hr FVG. SMT with GBPUSD. Price now should move from a IRL to the ERL.

BTCUSD 4H –Demand-to-Resistance Reversal Setup (Structured Long)Market Context
BITSTAMP:BTCUSD is currently reacting from a 4H demand zone after a sharp corrective move from the recent swing high. Price has printed a clear liquidity sweep below prior lows and is now attempting a reclaim of short-term structure.
Technical Breakdown
Strong 4H Demand (D) holding near the 88.9k–89.2k region
Clear reaction + displacement from demand, suggesting active buyers
Price is attempting to reclaim the 4H resistance flip zone (R)
EMA ribbon compression followed by early expansion → momentum shift
Structure aligns with a mean reversion → continuation move
Trade Plan (Illustrative)
Entry: On confirmation above 4H resistance / demand retest hold
Invalidation: Below demand zone low
TP1: ~93.4k (first opposing structure / imbalance fill)
TP2: ~97.7k (daily resistance / premium zone)
R:R remains favorable as long as demand holds and structure is respected
Bias
Neutral → Bullish while price holds above demand
Failure to hold demand invalidates the setup and opens downside continuation
Notes
This is a structure + supply/demand based idea, not a prediction
Best confirmation comes from lower timeframe acceptance and volume expansion
News events may increase volatility—manage risk accordingly
📌 This idea is for educational purposes only. Always manage risk and wait for confirmation.

SILVER SPOT VIEWSILVER POSSIBLE MOVES
WAVE 4 102, 100
WAVE 5 120.00 , 125.00
98.00 BELOW SUSTAIN OR CLOSE INVALIDATION
View is for study purpose only , we are not recommend any trade or investment
Always do your own analysis

#XAUUSD (MEGICAL INDICATOR) Hello Friend's 👋
This Megical indicator works very well. If you trade using this indicator with the Good risk and reward, you can generate significant profits, as you can see in the chart. And it's works well in the long term Chart 📈

CRUDE FUTURE MCXCRUDE POSSIBLE MOVES
WAVE 4 5710 , 5618
WAVE 5 6050 , 6180
5448 BELOW SUSTAIN OR CLOSE INVALIDATION
View is for study purpose only , we are not recommend any trade or investment
Always do your own analysis

Billionbrains Garage Ventures Ltd (NSE) – Daily Chart | Long SetThe stock is showing a bullish structure with higher lows and steady price consolidation. Recent price action suggests strength and a potential continuation move.
Trade Plan:
Entry: 173
Stop Loss: 164 (below recent swing low)
Targets:
T1: 191
T2: 210–212 zone
The setup offers a favorable risk–reward ratio, and momentum remains positive as long as price holds above the key support zone of 170–174.
Note: Partial profit booking near the first target is advised. Strict stop-loss discipline is important.
📌 For educational purposes only.
#Billionbrains #PriceAction #SwingTrading #BullishSetup #RiskReward #IndianStocks #NSE #TradingView #TechnicalAnalysis #ChartPatterns

Data Pattern 3x Possibility in next 5 Years.Data Pattern 3x Possibility in next 5 Years.
LTP - 2600
Targets - 8400+
Timeframe - 5 Years.
Fundamentals:
Company is almost debt free.
Company has delivered good profit growth of 59.4% CAGR over last 5 years
Company's median sales growth is 19% of last 10 years
Happy Investing.

SELL XAGUSD FOR SHORT TERM SILVER (XAGUSD) – SHORT TRADE SETUP
Instrument: Silver (XAGUSD)
Trade Direction: Short (Sell)
Entry Details
• Sell Price: 114.90975
Risk Management
• Stop Loss: 117.80500
This stop loss is placed above the recent resistance zone to protect the trade against unexpected bullish momentum and volatility.
Profit Objective
• Target Price: 103.46659
The target is set near a strong demand/support zone, aiming to capture a significant downside move while maintaining a favorable risk-to-reward ratio.
Risk–Reward Analysis
• Risk per unit: 2.89525
• Potential Reward per unit: 11.44316
• Risk–Reward Ratio: Approximately 1 : 3.95, indicating a high-probability and well-balanced trade setup.
Technical Outlook
• Price action indicates bearish momentum with rejection near higher levels.
• The structure supports a continuation to the downside, aligning with the short bias.
• This trade follows disciplined risk management and trend-based execution.
Trade Management Notes
• Trail stop loss if price moves strongly in favor.
• Partial profit booking can be considered near intermediate support levels.
• Avoid over-leveraging and strictly adhere to the predefined stop loss.
