XAUUSD – Historic Volatility Doji at 1.618 | Exhaustion SignalXAUUSD – HTF Exhaustion at 1.618 | Major Volatility Signal Formed
GOLD HAS PRINTED ITS BIGGEST DOJI IN ENTIRE HISTORY OF DAY CANDLE NEARLY 490$ FROM LOW TO HIGH AND ENDED WITH INDECISION. LETS SEE WHAT HAPPENS NEXT . WAIT FOR LOW AND HIGH OF DOJI.......?
Gold has reacted precisely from the 1.618 Fibonacci extension zone (~5600), where price printed a high at 5597.04 and faced strong rejection.
The current Daily candle is forming an exceptionally large indecision candle (Doji-like structure) after a strong impulsive move.
With an intraday range of nearly 490$, this candle highlights clear exhaustion and aggressive profit-taking at premium prices.
Technical Perspective
Clear rejection from the 1.618 extension resistance
Strong volatility spike following a vertical price expansion
Daily candle structure suggests weakening bullish momentum
Key HTF Levels to Watch
Resistance / Supply: 5580 – 5615
Immediate Reaction Zone: 5350 – 5400
Major Support / Rebalancing Area: 5000 – 4900
HTF Value Area Low: Below 4900 (only if bearish momentum accelerates)
Expectation (Next Sessions / 1–2 Weeks)
As long as price remains below the 1.618 rejection zone, probability favors:
Consolidation or corrective price action
Gradual rotation toward 5000–4900 HTF demand
No immediate V-shaped recovery unless strong acceptance above 5600 is seen
X-indicator

XAUUSD BUYGold has fallen sharply. People think it's crashed, but to me it's a correction. Gold may again move upwards due to this demand. Therefore, you should buy this demand with LTF confirmation and expect big profits. Keep your risk under control It will only be possible if money is saved

GILD breaks out after months of compression 1 Price has been holding above the old high zone near 120 for months, that looks like controlled building, not panic
2 The breakout was fast, so the reaction around 140 to 141 is the key area now
3 Shapes like a triangle or channel are only visual context here, Silent Flow does not need them
4 Silent Flow is active, it confirms the breakout, but it does not promise a smooth ride
5 Scenario A is holding above the old high zone, then price can cool down and keep working higher
6 Scenario B is slipping back into the prior range, then it starts to look like a failed push
7 Near term, the earnings update on Feb 10 can add volatility even if the chart stays constructive

XAUUSD Gold Next Move In Upcoming 2 Weeks ExpectedGold is Now Moving to 5600 to 5615 Which is Retracement level of 1.618 For Golds Previous Swing Extension levels and can expect a retracement of till 5000 to 5100 Levels In Upcoming Weeks Lets See WhatS Going to Happen..........# XAUUSD .. Check My 4hr chart Frame

Silver Futures: Parabolic Breakdown & Bearish LiquidationSilver Futures: Parabolic Breakdown & Bearish Liquidation (Analysis)
Part 1: Historical Context (The "Why") To understand this violent -17% move, we must look at Silver's distinct "personality" compared to Gold.
1. The "Beta" Factor (Silver vs. Gold) Silver is often called "Gold on steroids." While Gold is a monetary metal held by Central Banks for stability, Silver is 50% industrial and 50% speculative. It has a much smaller market cap, meaning it takes less liquidity to push the price up or down violently.
Historical Rule of Thumb: When Gold drops 5%, Silver often drops 10-15%. This chart confirms a classic high-beta liquidation event.
2. Historical Comparisons
The 2011 Crash: In April 2011, Silver went parabolic to nearly $50/oz before crashing ~17.7% in a single day (the "Sunday Night Massacre"). This was caused by exchange margin hikes, forcing leveraged longs to liquidate.
The 2020 Covid Crash: In March 2020, Silver fell ~30% in weeks due to a liquidity crisis where traders sold precious metals to cover equity losses.
Part 2: Visual & Technical Analysis
A. Daily Timeframe (The "Map")
Step 1: The Parabolic Arc Break: The rally followed a steep, unsustainable curve (Blue Arc on chart). When price cuts vertically through such an arc—as the recent Red Candle has done—the bullish momentum is technically broken.
Step 2: The "Supply Zone" Rejection: The long wick at the top (near 422,000) represents a "concrete ceiling." Buyers were exhausted, and trapped longs at this level will likely sell into any recovery to break even.
Step 3: Bearish Engulfing Candle: The massive red candle has "engulfed" (wiped out) the gains of the previous 7-10 trading sessions. This shifts market psychology from "Buy the Dip" to "Sell the Rally."
Step 4: Momentum Warning (RSI Divergence): Before this drop, while price was making Higher Highs, the RSI likely failed to confirm with a Higher High (Bearish Divergence). This signaled buyer exhaustion before the crash occurred.
B. Intraday / Short-Term Strategy (The "Path") Since the daily trend is broken, the strategy shifts to defensive management.
1. The "Dead Cat Bounce" Scenario: After a vertical drop, the RSI is oversold. A bounce is expected, but it is often a trap. We use Fibonacci Retracement levels from the Swing High to Low to identify resistance:
0.382 Level: The first zone where aggressive bears often reload shorts.
0.5 - 0.618 (Golden Pocket): Historically the highest probability area for a "Lower High" to form.
2. The "Bear Flag" Pattern: In strong liquidations, price rarely recovers in a V-shape. Watch for a "Flag" pattern (slow drift upward on low volume). A break below the flag's support triggers the next leg down.
Part 3: Trading Strategy Summary & Risk Management
Volume Confirmation: Check the volume on the breakdown candle. If it is the highest of the year, it indicates "Capitulation" (potential temporary bottom). If volume is average, the "real" panic selling may still be ahead.
Invalidation Level (When is this view wrong?): This bearish outlook is negated ONLY if we get a Daily Candle close back above the 400,000 supply zone. Until then, the market structure remains corrective.
Disclaimer: This analysis is for educational purposes only and does not constitute financial advice. Trading futures involves significant risk.

Bank Nifty spot 59610.45 by Daily Chart view - Weekly UpdateBank Nifty spot 59610.45 by Daily Chart view - Weekly Update
- Support Zone 58850 to 59350 for Bank Nifty
- Resistance Zone 59900 to ATH 60437.35 for Bank Nifty
- Bank Nifty seems more matured then Nifty to contain the unwarranted Geo-Political scenario and trending up for New ATH

XAUUSD – INTRADAY🔴 Market Structure
Overall trend: Bearish
Price making lower highs
Current bounce = pullback into resistance
✅ ENTRY (BEST AREA)
Sell between: 5085 – 5100
Or sell on rejection below 5105
🎯 TARGETS
Target 1: 🎯 5045
Target 2: 🎯 5000
Target 3 (extension): 🎯 4945
🛑 STOP LOSS (STRICT)
SL: ❌ 5140

Nifty spot 25320.65 by Daily Chart view - Weekly UpdateNifty spot 25320.65 by Daily Chart view - Weekly Update
- Support Zone 24775 to 25075 for Nifty Index
- Resistance Zone 25325 to 25625 for Nifty Index
- Nothing major Domestically except for the unwarranted Geo-Political scenario affecting our Stock Markets

Canara Bank daily chartThe chart pattern Upward Parallel channel is seen .
Price is hovering around 20 and 50 EMA. Near term (next few days): Expect consolidation around 150–156.
A breakout above 156.80 could target 160–162, while a drop below 150 might lead to testing 148.
Key levels:
Support: 150 / 148.
Resistance: 156.80 / 160.
The View: If Price keeps hovering around moving avgs. consolidation is expected .More than average buying must be seen for price to move above in parallel channel.

Bharat Electronics Limited Weekly Chart
4 EMA Analysis: The stock is trading above the 21, 55, 100, and 200 EMAs(Red, Blue, Green & Orange respectively) indicating a bullish trend. The EMAs are also in a positive alignment, suggesting a strong uptrend.
Volume Analysis: The breakout was supported by healthy volume expansion, validating the move. There's no major selling pressure visible near the breakout zone.
RSI Indicators: The RSI has crossed 60, reflecting healthy strength without signs of exhaustion.
Based on these indicators, the technical analysis suggests:
The trend is bullish, with buyers maintaining control above key demand zones.
The stock is likely to continue its uptrend, with potential targets at ₹460-₹480 (positional).
Support levels to watch: ₹428 - ₹420.
Further prediction:
A daily close above ₹422 could trigger stronger moves, opening room for fresh highs.
If the resistance holds, there could be a retest towards ₹340-₹360, followed by an uptrend.
Keep an eye on the volume and RSI for any signs of exhaustion or reversal. Majorly trend looks positive .

Gold (XAUUSD) Short Setup – Target $4,890Gold is showing signs of weakness after a failed attempt to reclaim higher levels. Here is the breakdown:
Context: After a significant drop, the price pulled back into a clear Supply Zone (blue box) around the $5,075 - $5,085 area.

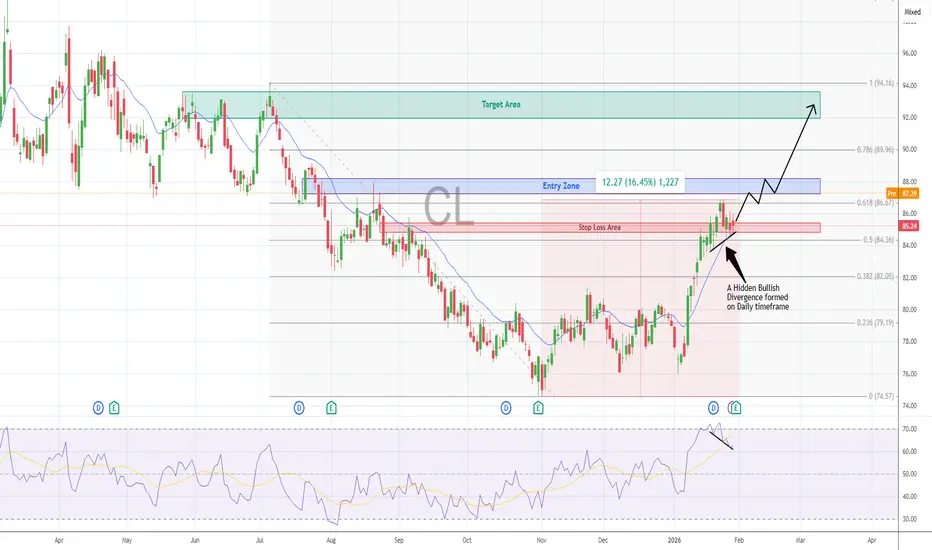
Colgate Palmolive Analysis* The primary trend of the stock is bullish, although prices witnessed a bearish retracement for over a year (Sep 2024 - Oct 2025)
* Since strong Q3 earnings (Oct 2025), a bullish pull-back could be seen, and prices rose more than 16.5% in over +3 months
* Recently prices tested fib level 0.618 (86.67) and started consolidating between fib level 0.618 & 0.50.
* Today's strong earnings results of the company for Q4 might drive the stock prices higher.
* The stock is expected to open with a gap-up near the Entry zone, and rise higher towards the Target area
Technical Indicators
- The prices are existing at the support of the 21 EMA
- A hidden bullish divergence is also visible, driving prices higher
Q4 & Annual Earnings
- Colgate-Palmolive beat estimated earnings by 4.0%, reporting an EPS of $0.95 versus an estimate of $0.91.
- Revenue was up $286.00 million from the same period last year.
- EPS, although beat estimates, but fell 106% from the previous quarter, and turned negative for the quarter
- EPS for the financial year also fell 25% to $2.63 from $3.51
XAUUSD (Gold) – 4H Chart Analysis (Short & Clear)XAUUSD (Gold) – 4H Chart Analysis (Short & Clear)
Market Structure
Overall strong uptrend intact (higher high–higher low).
Recent move shows sharp rally → profit booking / pullback.
Current price ~5127, bounced from below 5000 area.
Key Levels
Resistance:
5250–5280 (minor)
5450–5600 (major supply zone / previous top)
Support:
5050–5000 (important demand zone)
4850–4800 (strong swing support)
Price Action Insight
Big red candles after top = healthy correction, not trend reversal yet.
Last candle shows rejection from lows → buyers still active.
As long as 5000 holds, bias remains bullish.
Buy-side View
Buy on dip near 5050–5000 with confirmation.
Safer buy if market reclaims & holds above 5200.
Targets (short-term): 5250 → 5400
Targets (swing): 5500–5600
Bearish Scenario (Only if)
Clean 4H close below 4950 → deeper correction possible
Downside then: 4850 → 4700
Conclusion
📈 Trend = Bullish
🔁 Phase = Pullback / consolidation
🧠 Best strategy = Buy dips, avoid panic selling

Part 2 Intraday Institutional TradingBest Practices for Retail Traders
1. Start with Buying Options
Risk is limited.
2. Prefer ATM or Slight ITM
Better stability, realistic probability.
3. Avoid Holding Overnight
Unless you understand IV, theta, and event risk.
4. Track Implied Volatility
Buy when IV is low, sell when IV is high.
5. Use a Trading Plan
Entry levels
Stop loss
Target
Position size
6. Don’t Chase Cheap OTM Options
They expire worthless most of the time.

silver trendline Although silver is just not dependent on price action but lot more of geo political tensions and unknowns,there is achance that silver bounces back from here

Advance Trade Setup - KSCLKaveri Seed Company Ltd
BSE : 532899
NSE : KSCL
💡 Liked the idea?
Then don’t forget to Boost 🚀 it!
Comments are Most Welcome
Techincal Setup Details
LTP 818.00
VRVP
RSI
LinReg
VRVP :
The Visible Range Volume Profile (VRVP) indicator, often referred to as VPVR, displays trading volume by price rather than time, specifically for the visible chart area. The Value Area High (VAH) is the upper boundary of the price range where a significant percentage (default 70%) of volume occurs, acting as a crucial resistance or support level.
Significance of VAH:
Resistance : When prices are below or approaching the VAH, it often acts as resistance, signaling a potential pullback.
Support : In an upward trend, a breakthrough above the VAH can signal a continuation, turning the former VAH into support.
Trading VAH with VRVP:
Range Trading : If the price is within the VAH (Value area High) & VAL (Value area Low), it suggests a range-bound market. Sellers often enter near the VAH.
Trend Identification : A price moving well above the VAH indicates strong bullish sentiment, while price staying below the VAH suggests bearish sentiment.
RSI :
The Relative Strength Index (RSI) is a momentum oscillator ranging from 0 to 100 that measures the speed and change of price movements to identify overbought (>70) or oversold (<30) conditions. It helps traders detect potential trend reversals or corrections.
Linear Regression Channel :
The Linear Regression Indicator (LRI) is a technical analysis tool that fits a straight line, known as the "least squares regression," to a specific number of price bars (e.g., closing prices) to identify the current trend. It plots the final, predicted value of this regression line, acting as a responsive, noise-filtering alternative to moving averages that indicates where price "should" be
Purpose: Identifies trend direction, potential reversals, and acts as dynamic support/resistance
I've extended the Indicator/Lines on the Right so that when the actual reversal happens, it easy to go with the flow, will be a Helping hand.
In the Current Scenario # KSCL
VAH is @ 740
Price has Broken LinReg Lower Deviation # Channel Broken, which means we can expect further weakness
RSI is @ 30 odd with Bearish signal still ON
Why this idea is Titled as ADVANCE TRADE SETUP, because we must understand that further weakness is expected & we also need to know well in advance whats the BEST possible price to enter for a Decent RR Ratio
LTP stands @ 818
once its below 760 mark, start adding in tranches till 690 Levels
There is one important point that needs to be highlighted.
KSCL operates in the seed business, which is largely driven by the monsoon cycle.
If you look at its balance sheet, you’ll notice a clear revenue swing around June, and historically, the stock price also reacts during the March–June quarter.
As of now, we are nearing the end of January.
Till mid-March, we may get opportunities to accumulate the stock near the above-mentioned best buy zone.
Once the position is in place, the idea is to hold for an upswing, which could range between 40% to 80%, and possibly more.
Stop-loss (closing basis):
• ₹620 / ₹590
Important Note:
This idea is being shared well in advance.
All price levels mentioned are assumptions and expectations, meant only for guidance.
Actual prices may vary by ±10% to 15%.
Members are advised to act based on real-time market behavior and their own judgment.
Plan patiently. Execute with discipline.
For more insights & trade ideas,
📲 Visit my profile and hit Follow
Warm regards,
Naresh G
SEBI Registered Research Analyst
💬 Comment below if you want me to analyse any stock for you 🔍

Part 4 Institutional VS. Technical1. Delta
Measures how much the premium changes with a ₹1 move in the underlying.
Call delta: +0.0 to +1.0
Put delta: –0.0 to –1.0
High delta = faster premium movement.
2. Gamma
Measures how fast delta changes. Used to evaluate momentum and risk.
3. Theta
Measures time decay—how much premium decreases as expiration approaches.
Sellers benefit from theta.
Buyers lose value daily.
4. Vega
Measures sensitivity to implied volatility (IV).
Higher IV → higher premium.
5. Rho
Impact of interest rates (less important for short-term traders).


XAUUSD 30 MIN T/F ANALYSIS---
📊 Market Structure Explanation (Gold – 30 Min)
The price show heavy selling so we can measure recent top supply and copy it
after retesting we can measure from retesting top and past previous supply and match current supply so supply will be completed --
🔍 What the market can do next:
Scenario 1 – Pullback / Reversal (Needs Confirmation):
For any meaningful reversal to occur, the market must first show clear bullish candlestick confirmation.
This includes patterns such as:
bullish engulfing candles
Strong rejection wicks (lower shadows)
morning star formations
Consecutive bullish closes
Short lower-wick rejection candles showing bullish pressure
Without these bullish structures, any upside move should be treated as a temporary pullback, not a reversal.
Scenario 2 – Continuation:
If sellers stay strong and bullish confirmation does not appear, price can break down this zone and continue lower with another impulsive bearish move.
Scenario 3 – Range formation:
Market may form a small sideways structure near this level before choosing a clear direction.
🧭 Summary:
The trend is bullish, but price is at a sensitive support zone.
Reversal is only valid if bullish candlestick patterns and bullish pressure appear.
Otherwise, the structure favors continuation or short-term consolidation before the next move.

TDPOWERSYS 1 Day Time Frame 📊 Live/Intraday Summary (Today’s Trading)
• Current price: ~₹735 – ₹745* (showing a strong upside on the day).
• Day’s high: ₹767.95.
• Day’s low: ₹642.30.
• Previous close: ₹676.90.
• Range (1‑day): ₹642.30 – ₹767.95.
• Volume: Several million shares traded (indicating active intraday participation).
• Circuit limits: Upper ₹812.25 / Lower ₹541.55.
📈 Intraday Price Behavior (1‑Day Chart Insight)
Although I can’t draw the live chart, major market data sources show the stock rising significantly above its previous close, with intraday volatility spanning over ₹125+, suggesting strong buying interest today.
🔎 What this means for your 1‑day view
The stock opened lower near ₹661 and trended up strongly, testing higher intraday levels toward ₹767+ — a bullish intraday range.
Today’s range and levels are useful for intraday support/resistance as:
• Support: ~₹640 – ₹660 (earlier day lows).
• Resistance: ~₹760 – ₹770 (near today’s high).
⚠️ Notes
• Market prices intraday change rapidly — data above reflects the latest available snapshot for today’s session.
• If you’re planning trades, check real‑time charts from your broker or a live market platform (e.g., NSE/BSE or charting tools like Chartink).

Trump speaks tonight — Gold at decision point.Market Context (H1–H4)
Gold remains in a broader bullish structure, but short-term price action has shifted into a decision phase after rejecting ATH. The sharp drop created a displacement leg, followed by a corrective bounce — typical post-event behavior.
Structurally:
HTF trend is still upward (ascending channel intact)
No confirmed HTF bearish reversal yet
Current move looks like rebalancing, not trend failure
Fundamental Context
Trump’s speech tonight is the key volatility trigger
Any geopolitical / USD-impacting rhetoric can cause:
A liquidity sweep before direction
Or a direct continuation if risk-off sentiment returns
Market is likely positioning → expect fake moves before clarity
Technical Breakdown
ATH: recent distribution, not yet reclaimed
FVG (upper): potential reaction zone for sellers if price rallies
Mid Zone (~5090–5120): short-term decision / balance area
Strong Demand (~4980–5000): HTF buy zone, aligns with trendline & prior BOS base
Trading Scenarios (If–Then)
If price holds above 5090–5120 → look for continuation into FVG, then ATH test
If price sweeps below 5090 but reclaims → classic liquidity grab → BUY continuation
If price breaks and holds below 5000 (H1 close) → deeper pullback, bullish bias pauses (not flips yet)
Key Takeaway
This is not the place to chase.
Trade reactions, not headlines.
Let Trump speak → let liquidity show → then follow structure.
Bias: Bullish continuation unless strong demand fails.

Gold Rejected at High – Sellers Take Control🔴 What the chart is saying NOW
Big rejection from 5600
Sharp breakdown below 5500
Structure shifted from bullish flag → bearish continuation
Current price ~5196
Lower high + lower low = trend flip intraday
This is distribution → breakdown, not a dip-buy anymore.
🧠 Market Bias (important)
Below 5250 = Sell on rise
Bulls invalidated for intraday
Only bounce trades, no blind buys
✅ If you want a FRESH TRADE idea (optional)
Sell below 5230
Targets: 5150 → 5080
SL: 5285

PFC 1 Day Time Frame 📌 Current Live Context (Daily)
📊 Approx Live Price: ~₹377‑₹379 (today’s trading range: ₹376 – ₹384) on NSE intraday quotes.
📈 Daily Pivot / Support & Resistance (Reliable Levels)
🔹 Pivot / Reference Zone
Central Pivot (CPR) ~ ₹386.8 area — key reference point for bias (above = bullish bias; below = bearish).
🚀 Resistance Levels (Upside)
R1 ~ ₹390–₹392 — initial resistance near current zone.
R2 ~ ₹394–₹398 — next supply zone.
R3 ~ ₹402–₹406 — stronger resistance on daily view.
Above ₹400 reinforces bullish structure and opens potential next targets up if breakout sustains.
🛑 Support Levels (Downside)
S1 ~ ₹382–₹386 — near‑term support zone (first buyer interest).
S2 ~ ₹378–₹381 — lower support region on daily pivots.
S3 ~ ₹370–₹376 — deeper support zone if price weakens.
Daily bias turns bearish if price closes clearly below the S2/S3 range (~₹378–₹376).
🔎 Quick Technical Bias Notes
Since current price (~₹377‑₹379) is below the pivot/CPR (~₹387), short‑term bias leans slightly bearish to neutral unless bulls reclaim pivot with volume.
A daily close above ~₹398‑₹400 could shift view bullish toward ~₹402+ and beyond.
