PAYTMPAYTM
buy signals in
technical indicators and
Ascending Channel chart pattern.
21 M EMA
BUYING RANGE 970/980
X-indicator

Two Very Different Futures for Bitcoin Two Very Different Futures for Bitcoin 🔥
Don’t skip this one - the monthly chart decides
Bitcoin is approaching a critical decision zone on the monthly timeframe — one that could shape market behaviour well beyond short-term volatility.
From a structural and macro lens, a few developments stand out clearly:
1. Major supply has been swept, suggesting late-stage participation at higher levels
2. The long-term monthly trendline has been decisively broken
3. Price retested the broken trendline and has since started to roll over — a classic structural shift
4. A clearly defined demand zone between 48K–64K now sits below current price
5. This zone aligns with the 50-period EMA, strengthening it as a potential reaction area
Two macro-consistent paths emerge from here:
Scenario 1 (Higher probability):
Bitcoin retraces into the 48K–64K demand zone, finds support near the 50 EMA, and then resumes its broader bullish trajectory — eventually targeting liquidity above prior all-time highs (~125K).
This would represent a structural reset within a larger bullish cycle, consistent with historical behaviour during expansionary phases.
Scenario 2 (Lower probability, higher impact):
Bitcoin tests the same demand zone but fails to hold, leading to continued downside and a deeper move toward the long-term trendline low near ~18K.
This outcome would likely require a material macro trigger — tighter global liquidity, regulatory shocks, or a broader risk-off event. Less probable, but not dismissible.
Sharing this as a macro-structural study, not a directional call.
Analysis only. Not investment advice.

XAUUSD (H1) – Liam PlanUptrend intact, but signs of short-term exhaustion | Trade reactions, not impulse
Quick summary
Gold remains in a strong H1 uptrend, continuing to print higher highs and higher lows within a well-defined bullish structure. However, after the recent sharp advance, price is starting to slow near the highs, increasing the likelihood of short-term pullbacks and two-sided price action.
➡️ The broader trend stays bullish, but execution should now be level-driven and reaction-based, not momentum chasing.
Technical view
Price is currently trading at elevated levels relative to recent structure, where prior buying activity has already been absorbed.
Key price areas to watch:
Short-term sell area: 5520 – 5530
Upper resistance area: around 5600
Pullback buy area: 5405 – 5420
Primary buy zone: 5150 – 5155
The current structure favors a pullback and rebalancing phase before any sustained continuation higher.
Trading scenarios
SELL – short-term reaction trades
Look for sell reactions around 5520 – 5530 if price shows weakness.
Downside targets sit near 5420, with further extension possible if the pullback develops.
These sells are tactical and short-term, not calls for a trend reversal.
BUY – aligned with the main trend
Primary scenario
Buy pullbacks into 5405 – 5420 if the area holds.
Targets back toward 5520 and higher.
Deeper scenario
If volatility increases, wait for price to retrace toward 5150 – 5155.
This area offers the best risk-to-reward for trend continuation.
Key notes
Strong trends still correct; patience matters.
Avoid entries in the middle of the range where risk outweighs reward.
Short positions are tactical only while the broader structure remains bullish.
What’s your plan:
selling reactions near 5520 – 5530, or patiently waiting for a pullback into 5405 – 5420 to rejoin the uptrend?
— Liam


APOLLOAPOLLO MICRO SYSTEMS
bullish trend is Showing on the chart.
buy signals in
technical indicators and
descending triangle chart pattern.
BUYING RANGE 262/265
Watch for a breakout above 262/2650 to sustain the bullish trend. If the resistance holds, there could be a retest towards 210/220 and an uptrend from here.

The Global IPO Market1. What Is an IPO & Why It Matters
An Initial Public Offering (IPO) is when a private company offers its shares to the public for the first time by listing on a stock exchange. It allows companies to raise capital from a broad investor base, provides liquidity to early investors and employees, and increases visibility and credibility. In return, public markets demand transparency, regulatory compliance, and ongoing disclosure.
IPOs serve as a crucial mechanism in global finance for capital formation, enabling companies to fund expansion, repay debt, invest in research and development, and pursue acquisitions. For investors, IPOs can offer growth opportunities—especially if the company scales rapidly post‑listing.
2. How the Global IPO Market Works
Key Participants
Issuing Company (Issuer): Seeks capital through a public listing.
Underwriters/Investment Banks: Advise on pricing, structure the deal, and sell shares to institutional and retail investors.
Stock Exchanges: Provide the platform for listing (e.g., NYSE, Nasdaq, HKEX).
Regulators: Oversee disclosure and compliance (e.g., SEC in the U.S.).
Investors: Institutional (mutual funds, hedge funds) and retail investors who buy shares.
Process Overview
Preparation: Financial audits, governance structures, and prospectus creation.
Due Diligence: Underwriters evaluate company financials and market potential.
Marketing (Roadshow): Presenting the investment case to potential investors.
Pricing: Shares are priced based on demand and valuation metrics.
Listing: Shares begin trading publicly, often with first‑day “pop” or volatility.
The success of an IPO depends on market conditions, investor appetite, sector momentum, and broader economic trends.
3. Current Trends in the Global IPO Market (2025)
Overall Market Health
After years of caution driven by geopolitical tensions, interest rate uncertainty, and volatility, 2025 saw a stabilizing and resilient global IPO market. According to data from EY’s Global IPO Trends, there were approximately 1,293 IPOs raising US$171.8 billion globally in 2025, signaling renewed confidence and a shift toward higher‑quality offerings.
This continues a trend of recovery following slow periods in 2022–24. While not yet at the frothy peaks of the 2021 boom, IPO markets are showing strength characterized by larger deal sizes and selective investor interest in standout companies.
Volume vs. Proceeds
Data indicates that while the number of IPOs hasn’t surged dramatically, total capital raised is increasing—reflecting a shift toward larger, more established issuers deciding to go public rather than many small firms. This is a key metric of market maturity and investor selectivity.
Cross‑Border Listings
Companies increasingly choose to list on foreign exchanges—a trend especially evident in the U.S. This can enhance liquidity and broaden the investor base. Cross‑border IPOs reached multi‑decade highs in 2025, highlighting globalization within equity capital markets.
Sector Focus
Major IPO activity is concentrated in sectors that attract investor interest, such as:
Technology & AI: Companies tied to digital transformation.
Fintech: Financial technology firms tapping broader capital markets.
Healthcare & Life Sciences: Biotech and life science companies.
Industrials & Consumer Goods: Established firms with strong growth plans.
4. Regional Dynamics
Asia‑Pacific
Asia continues to be a powerhouse in IPO activity.
Greater China (including Hong Kong and mainland China) has emerged as a dominant source of IPO proceeds, capturing around one‑third of global capital raised in the first half of 2025.
Hong Kong Exchange (HKEX) has enjoyed strong listings in 2025, with companies raising significant capital — reflecting confidence in Asia’s public markets.
India has also shown strong IPO volume and improvement in fundraising, trending toward record years and ranking among the top global IPO markets.
This reflects broader economic growth in the region, deepening equity markets, and policy frameworks aimed at attracting listings.
United States
The U.S. traditionally leads global IPO markets in capital raised thanks to large tech and growth company listings:
The U.S. recorded strong IPO volumes in early to mid‑2025—the highest since 2021 in some quarters.
Some of the most anticipated potential IPOs (e.g., SpaceX) could redefine market scale if they materialize.
However, intermittent challenges like regulatory slowdowns (e.g., government shutdowns affecting the SEC) have occasionally slowed the pace of launches.
Europe
Europe’s IPO market remains smaller relative to Asia and the U.S. but showed record momentum at the start of 2026 with major industrial and defense listings.
Emerging Markets
Latin America, the Middle East, and other emerging regions see sporadic but noteworthy IPOs, with firms choosing international listings to access deeper capital pools.
5. Major Recent IPOs & Signals
2026 Activity Indicators
Even in early 2026, new signs of life include:
PicPay’s Nasdaq IPO marking a return of Brazilian companies to public markets after a multi‑year break.
Agibank’s planned U.S. IPO underlining fintech interest from Latin America.
Busy Ming’s successful Hong Kong IPO showing continued appeal of Asian listings.
These signals reflect a nuanced landscape where IPOs are widely spread across sectors and geographies.
6. Challenges Facing the IPO Market
Despite improvements, the global IPO market faces several persistent challenges:
Market Volatility & Economic Uncertainty
Global macroeconomic uncertainty—driven by tariffs, interest rate shifts, and geopolitical tensions—has made companies more cautious about listing timing.
Regulatory & Compliance Pressures
Companies face rising compliance costs and investor demands for transparency and ESG (environmental, social, governance) disclosures—both prerequisites for modern listings.
Investor Selectivity
Investors increasingly focus on firm quality, profitability pathways, and sustainability of growth. Firms with weak fundamentals or unclear growth prospects often delay or cancel IPO plans.
Valuation Concerns
High valuation expectations by private companies sometimes misalign with market realities, leading to postponed listings or sub‑par performances post‑IPO.
7. The Future Outlook
The outlook for the global IPO market remains cautiously optimistic, with several key forces shaping its trajectory:
Strong Pipelines
Many large private companies (especially in tech, fintech, and biotech) remain IPO candidates. As markets stabilize, these firms may enter public markets—potentially providing a meaningful uplift to aggregate proceeds.
Innovation & New Sectors
New sectors like AI, green tech, and biotech are attracting investors and may lead to new high‑value IPOs.
Geographic Shifts
Asia’s increasing share and cross‑border listings suggest a more balanced global IPO market, reducing reliance on single regions.
Economic Policies
If monetary easing continues and geopolitical tensions reduce, IPO markets are likely to see further expansion in both number and value of offerings.
8. Conclusion
The global IPO market in the mid‑2020s has shifted from the uncertainty of the early 2020s to a phase of resilience and cautious expansion. While market volatility and external economic pressures remain challenges, structural improvements, stronger investor sentiment, and megadeals in promising sectors suggest a maturing market with significant future capital formation potential.
Whether for young innovators or established industrial firms, the IPO remains a central pillar of global capital markets—connecting companies with investors and driving growth across regions and industries.

Commodity Supercycle and Geopolitics: An In-Depth AnalysisA commodity supercycle refers to an extended period—usually lasting 10 to 20 years or more—of elevated demand and prices for commodities, often driven by structural economic shifts rather than short-term market fluctuations. These cycles have historically been influenced by rapid industrialization, urbanization, technological innovation, and shifts in global trade patterns. However, geopolitics increasingly plays a central role in shaping commodity supercycles in today’s interconnected world, influencing both supply and demand dynamics.
Understanding Commodity Supercycles
Unlike normal commodity cycles, which are often tied to cyclical economic growth or short-term supply-demand imbalances, a supercycle is usually structural. Historical supercycles can be traced to events such as post-World War II reconstruction, the industrialization of Japan, and the economic rise of China in the early 21st century. During a supercycle, commodities such as metals, energy products, and agricultural goods experience prolonged price increases, often outpacing inflation and impacting global economic patterns.
The genesis of a supercycle is often linked to surges in global demand. For instance, the 2000s commodity supercycle was largely fueled by China’s rapid industrialization, urbanization, and infrastructure expansion. This created unprecedented demand for metals like copper, aluminum, iron ore, and energy resources such as oil and coal. Unlike short-term demand spikes, these structural drivers reshape production patterns and influence long-term investment decisions in mining, energy extraction, and logistics.
Supply-side constraints also reinforce supercycles. Commodities are often subject to long lead times for new production capacity. Mining projects, oil fields, and agricultural expansion cannot scale up instantly in response to rising demand. Environmental regulations, geopolitical instability, and technological limitations further restrict supply flexibility, allowing prices to remain elevated over extended periods.
Geopolitics and Its Role in Commodity Supercycles
Geopolitics—encompassing conflicts, trade policies, sanctions, territorial disputes, and strategic alliances—plays a decisive role in determining the timing, magnitude, and duration of commodity supercycles. Political events can affect both the physical availability of commodities and the perception of risk in global markets.
Energy and Oil Geopolitics:
Oil is perhaps the most geopolitically sensitive commodity. Historical supercycles, such as the 1970s oil crisis, demonstrate how conflicts, embargoes, or political instability in key oil-producing regions can trigger dramatic price spikes. Contemporary issues such as tensions in the Middle East, Russian-Ukrainian conflicts, and shifts in OPEC+ policies continue to influence crude oil supply and pricing. Energy security concerns drive countries to diversify energy sources, invest in strategic reserves, and accelerate transitions to renewable energy, indirectly affecting the demand patterns for fossil fuels.
Metals and Strategic Minerals:
Geopolitics also strongly influences metals and critical minerals essential for modern technologies. For example, rare earth elements, lithium, cobalt, and nickel are central to the production of batteries, semiconductors, and renewable energy infrastructure. China dominates the rare earth market, controlling the majority of global production. Any geopolitical tension, export restriction, or trade dispute involving China can trigger price volatility worldwide. Similarly, cobalt sourced from the Democratic Republic of Congo faces supply risks due to political instability and labor concerns, highlighting how geopolitics can constrain supply and accelerate supercycle trends.
Agriculture and Food Security:
Agricultural commodities are no longer insulated from geopolitics. Conflicts in Ukraine, one of the world’s largest grain exporters, have disrupted wheat and corn supply chains, sending shockwaves across global markets. Similarly, geopolitical tensions affecting fertilizer exports, such as Russia and Belarus, influence crop yields and prices worldwide. Nations increasingly consider strategic stockpiling, trade barriers, and domestic production incentives to safeguard food security, further affecting global commodity cycles.
Sanctions, Trade Wars, and Global Supply Chains:
Economic sanctions and trade wars can exacerbate commodity price volatility. U.S.-China trade tensions, for instance, affected the demand for soybeans, metals, and energy products. Sanctions on Russia following the Ukraine invasion impacted oil, gas, and wheat supplies. These disruptions not only affect immediate supply-demand balances but also alter long-term investment strategies and infrastructure development, reinforcing supercycle characteristics.
The Interplay of Technology, Transition, and Geopolitics
In the modern era, commodity supercycles are increasingly intertwined with technological transitions and environmental imperatives. The global push for green energy and decarbonization has heightened demand for lithium, nickel, cobalt, copper, and rare earth elements, all crucial for electric vehicles, energy storage, and renewable energy infrastructure. Geopolitical considerations, such as control over these critical minerals and the location of processing capabilities, shape the trajectory of this emerging supercycle.
For instance, the European Union, U.S., and other nations are investing heavily in domestic battery supply chains to reduce dependence on China, highlighting how geopolitics drives structural shifts in commodity markets. Similarly, energy transitions in India, Southeast Asia, and Africa are reshaping demand patterns for coal, natural gas, and renewables, with geopolitical alliances influencing both investment and trade flows.
Historical Patterns and Lessons
Past supercycles, such as those in the 1970s, 2000s, and early 2020s, reveal common patterns:
Demand-driven origin: Rapid industrialization and urbanization often create sustained increases in commodity consumption.
Supply-side rigidity: Long lead times for production expansions amplify price impacts.
Geopolitical triggers: Wars, sanctions, trade disputes, and policy interventions frequently catalyze or intensify supercycles.
Technological and policy transitions: Innovation and regulatory changes, such as renewable energy adoption or strategic stockpiling, significantly influence commodity prices.
These patterns suggest that future supercycles may increasingly revolve around critical minerals, energy transition metals, and food security, with geopolitics remaining a central driver.
Implications for Investors and Policymakers
For investors, understanding the nexus between commodity supercycles and geopolitics is crucial for risk management and portfolio strategy. Supercycles offer opportunities for long-term gains, but geopolitical risks can amplify volatility, making diversification, hedging, and strategic timing essential.
For policymakers, the interplay between commodities and geopolitics highlights the importance of securing supply chains, investing in strategic reserves, and fostering international cooperation. Policies addressing energy transition, climate goals, and technological sovereignty must account for potential supply disruptions caused by geopolitical conflicts.
Conclusion
Commodity supercycles are not merely economic phenomena; they are deeply entwined with geopolitics. Structural demand shifts, constrained supply, and long-term technological transitions interact with political instability, trade disputes, and strategic resource control to shape prolonged periods of elevated commodity prices. In an era of energy transition, technological innovation, and geopolitical realignment, understanding this interplay is critical for nations, corporations, and investors alike. The next supercycle will likely be defined not only by rapid growth in demand but also by the geopolitical landscape surrounding critical resources, energy security, and food production. Navigating this environment requires foresight, resilience, and an acute awareness of how politics and economics converge in shaping the global commodity market.
Major Global Inflation & Economic Developments (Recent)Introduction — What Is Inflation?
Inflation refers to the general rise in prices of goods and services over time, typically measured by consumer price indices (CPI). Moderate inflation is normal in growing economies, but rapid inflation erodes purchasing power, affects living standards, and complicates economic planning. Central banks and governments aim to keep inflation within target ranges (often ~2% in advanced economies) to sustain stability and confidence in markets.
Historical Context: From Low Inflation to the Recent Surge
During the 2000s and 2010s, global inflation tended to decline due to factors such as globalization, technological improvements, disciplined monetary policy frameworks, and integrated supply chains. Between 2000 and 2020, global inflation averaged about 3.4%, significantly lower than the double‑digit levels common in the 1980s and early 1990s.
However, the post‑COVID era marked a pronounced departure from this trend. Starting in mid‑2021, inflation surged sharply in many countries, reaching multi‑decade highs. This period was driven by a constellation of factors related to both global demand shocks and supply constraints.
Key Historical Drivers of the Surge
Pandemic disruptions: Lockdowns, labor shortages, and logistics bottlenecks disrupted supply chains worldwide.
Fiscal and monetary stimulus: Massive government spending and ultra‑loose monetary policies boosted demand faster than suppliers could respond.
Commodity price shocks: Energy, food, and raw material prices spiked, especially after Russia’s invasion of Ukraine in early 2022, elevating inflation globally.
Food and energy pressures: These categories often dominate headline inflation, especially in developing economies with high food shares in consumption baskets.
This combination triggered a cost‑of‑living crisis in many societies, where essential goods’ prices rose faster than wages, squeezing households’ real incomes.
Recent Global Inflation Trends (2023‑2026)
Headline Inflation — Broad Global Trends
After peaking around 2022–2023, global inflation has been moderating, but not uniformly across countries or regions.
Average global inflation was estimated around 5.6% in 2023, but eased to about 4.0% in 2024.
Projections for 2025 place global inflation near or slightly above 4%, indicating that inflation remains above many central bank targets in several economies.
For 2026, forecasts suggest further decline — with estimates around 3.7% to 3.9% globally, reflecting ongoing price stability efforts.
These figures reflect headline CPI, which includes volatile food and energy prices. Underneath this, core inflation (excluding food & energy) often remains more persistent, especially in services‑oriented advanced economies.
Regional and Country Variations
Advanced Economies
Many advanced economies have successfully reined in headline inflation from their post‑pandemic highs, bringing figures back toward or even below central bank targets:
The United States inflation slowed significantly in 2025 toward the Federal Reserve’s 2% target range.
Japan’s core inflation recently eased slightly but remains above its central bank’s 2% goal — signaling persistent underlying pressures.
Across Europe, headline inflation has largely moved toward target levels, though services price pressures and wage dynamics can keep core components elevated.
Many advanced economies are now focused on balancing inflation control with growth support. Central banks have either paused rate hikes or considered cuts if disinflation continues — a shift from the aggressive tightening seen in 2022–2024.
Emerging & Developing Economies
Inflation trends in emerging markets remain more heterogeneous:
Some countries have successfully lowered inflation near target ranges as commodity price effects recede.
Others, especially with weaker policy frameworks or external vulnerabilities, still experience elevated inflation — sometimes in double digits.
Outliers like Turkey and Argentina have posted high inflation rates due to structural issues, policy challenges, and currency volatility.
These disparities reflect differences in economic structures, policy credibility, exchange rate stability, and exposure to external shocks.
Drivers Shaping Current and Future Inflation
Understanding why inflation behaves as it does requires looking at several interacting forces:
1. Monetary Policy
Central banks worldwide reacted to the inflation surge by hiking interest rates. Higher borrowing costs have gradually tempered demand and inflation expectations, contributing to the disinflation observed in 2024–2026. However, the pace of disinflation depends heavily on how services inflation and wages evolve.
2. Commodity and Energy Prices
Global commodity markets significantly influence inflation. For instance, falling global commodity prices — including oil and coal — have eased cost pressures, moderating headline inflation in 2025 and beyond.
3. Labor Markets and Wages
Tight labor markets in several advanced economies have supported stronger wage growth, which can sustain core inflation if productivity gains don’t keep pace. Some central banks have acknowledged that underestimating wage growth contributed to inflation forecast errors.
4. Supply Chain and Trade Dynamics
Post‑pandemic restructuring of global supply chains, geopolitical tensions, and increased trade barriers (e.g., tariffs) have raised costs for producers and consumers in some regions. These factors can slow disinflation or even reignite price pressures if persistent.
5. Food Prices
Food inflation remains a significant driver of headline inflation worldwide, particularly in lower‑income nations where food constitutes a large share of household spending. Persistent food price volatility continues to push up living costs.
Inflation Expectations and Long‑Term Outlook
Inflation expectations — what households, firms, and markets anticipate inflation will be in the future — matter for actual price setting. Surveys show that global inflation expectations remain elevated in the medium term, with forecasts clustering around 3.7%‑3.9% for 2025 and 2026.
This suggests that while headline inflation is declining, structural pressures and uncertainty — such as labor market dynamics, geopolitical risks, and possible policy shifts — could keep inflation sticky or volatile.
Impacts of Inflation
On Households
Inflation erodes purchasing power, especially for essential goods like food, energy, and housing. Even when average inflation slows, subgroups with lower incomes often bear the heaviest burden due to higher shares spent on necessities.
On Businesses and Investment
Inflation influences business costs (wages, materials, borrowing) and investment decisions. High or unpredictable inflation can deter long‑term planning and distort resource allocation.
On Policy and Markets
Central banks constantly balance between price stability and economic growth. Too fast a policy tightening can slow growth or trigger recession; too slow a response can entrench inflation expectations.
Summary — Global Inflation in a Nutshell
Post‑pandemic inflation peaked in 2021‑23 due to disrupted supply chains, stimulus policies, and energy/commodity shocks.
Global inflation has moderated since — headline rates falling from near 8‑9% at the peak to around 3.7‑4% in 2025‑26 forecasts.
Advanced economies have generally returned toward central bank targets, while emerging markets show more variation, with some facing persistent high inflation.
Underlying drivers include monetary policy, labor market tightness, commodity prices, trade dynamics, and food costs.
Expectations remain elevated, signaling that inflation may ease further slowly rather than collapse abruptly.

TDPOWERSYSTDPOWERSYS
bullish trend is Showing on the chart.
buy signals in
technical indicators and
Ascending Channel chart pattern.
BUYING RANGE 700/710
Watch 700/710 to sustain the bullish trend. If the resistance holds, there could be a retest towards 550/570 and an uptrend from here.

Advanced Strategies & Market Microstructure1. Understanding Market Microstructure
Market microstructure refers to the study of the processes and outcomes of exchanging assets under explicit trading rules. It examines how the design of markets, order types, transaction costs, and participant behaviors influence price formation and liquidity. Key components include:
Order Types and Order Books:
Limit Orders: Orders placed to buy or sell at a specific price or better. They contribute to market liquidity but may not be executed immediately.
Market Orders: Orders executed immediately at the best available price. They consume liquidity and can cause price impact.
Stop Orders: Orders triggered when a specific price is reached, often used for risk management.
Order Book Dynamics: The limit order book represents the supply (asks) and demand (bids) at various price levels. Advanced traders analyze order book imbalances to anticipate short-term price movements.
Liquidity and Depth:
Liquidity refers to how easily an asset can be bought or sold without significantly impacting its price.
Depth measures the volume of buy and sell orders available at each price level in the order book. Greater depth reduces price volatility for large trades.
Market Participants:
Retail Traders: Typically trade smaller volumes and are often more reactive to news.
Institutional Traders: Manage large portfolios, often using sophisticated algorithms to minimize market impact.
Market Makers: Provide liquidity by continuously quoting bid and ask prices, profiting from the spread.
High-Frequency Traders (HFTs): Use ultra-fast algorithms to exploit tiny inefficiencies and respond to market signals in milliseconds.
Price Formation and Efficiency:
Prices are influenced by both the fundamental value of an asset and the microstructure effects such as order flow, transaction costs, and latency.
Bid-ask spreads, adverse selection, and order anticipation can create temporary mispricings, offering opportunities for advanced strategies.
2. Advanced Trading Strategies
Advanced trading strategies often exploit subtle features of market microstructure. These strategies are quantitative in nature, often automated, and rely on rigorous risk management.
Algorithmic Trading:
Algorithms automate trade execution to improve efficiency and reduce market impact.
Common algorithmic strategies include:
VWAP (Volume Weighted Average Price): Executes trades in line with historical volume patterns to minimize market impact.
TWAP (Time Weighted Average Price): Spreads trades evenly over time to avoid influencing the market.
Implementation Shortfall Algorithms: Optimize trade execution by balancing the trade-off between market impact and opportunity cost.
Statistical Arbitrage:
Exploits temporary price discrepancies between related securities.
Examples include:
Pairs Trading: Long one security and short another correlated security when the spread deviates from its historical mean.
Index Arbitrage: Exploits differences between the price of an index and its constituent stocks.
Requires sophisticated models to account for transaction costs, slippage, and risk exposure.
Liquidity Provision and Market Making:
Market makers profit from the bid-ask spread while managing inventory risk.
Advanced market-making strategies use predictive models to adjust quotes dynamically, considering order book imbalances, volatility, and competitor activity.
Momentum and Trend-Following Strategies:
Focus on capturing price trends over short or intermediate time horizons.
Microstructure signals such as large trade imbalances, sudden order book depletion, or unusual volume spikes often trigger entries or exits.
Requires careful attention to execution speed and transaction costs.
High-Frequency Trading (HFT) Strategies:
Leverage extremely low-latency infrastructure to capture opportunities that exist for milliseconds.
Examples include:
Latency Arbitrage: Exploiting delays in price updates across exchanges.
Quote Stuffing: Temporarily overwhelming competitors’ algorithms with large numbers of orders (controversial and regulated).
Sniping and Pinging: Detecting large hidden orders by sending small test orders.
Dark Pool Strategies:
Dark pools are private trading venues where orders are not displayed publicly.
Advanced traders use tactics such as iceberg detection (identifying hidden large orders) or dark-to-light routing to execute trades without revealing intentions to the broader market.
3. Risk Management in Advanced Strategies
Even sophisticated strategies are exposed to significant risk. Microstructure-based trading faces unique challenges, including:
Execution Risk: Poor timing or large trades can move the market against the trader.
Latency Risk: Delays in market data or execution can erode profits, especially in high-frequency trading.
Adverse Selection: Trading against better-informed participants can lead to losses.
Inventory and Position Risk: Market makers and liquidity providers must carefully manage holdings to avoid overexposure.
Regulatory Risk: Algorithmic and HFT strategies are heavily regulated to prevent market manipulation.
Advanced risk management techniques involve dynamic hedging, stop-loss protocols, portfolio diversification, and real-time monitoring of order book conditions.
4. Technology and Infrastructure
Advanced strategies are heavily dependent on cutting-edge technology:
Low-Latency Networks: Minimize transmission delays between exchanges and trading servers.
Co-location Services: Traders place servers physically close to exchange matching engines for faster execution.
Big Data and AI: Machine learning models analyze market patterns, predict short-term movements, and adapt strategies in real time.
Quantitative Analytics: Statistical models and simulations assess the profitability and risk of various execution tactics.
5. Market Microstructure Implications for Strategy Design
Understanding market microstructure is crucial for designing strategies that are both profitable and sustainable:
Spread and Transaction Cost Analysis: Strategies must account for bid-ask spreads, fees, and slippage.
Order Book Dynamics: Anticipating where liquidity will appear and disappear can optimize entry and exit points.
Information Asymmetry: Awareness of informed vs. uninformed order flow can improve trade timing.
Volatility and Market Impact Models: Predicting how trades influence price ensures minimal adverse impact on execution.
Regulatory Compliance: Algorithms must adhere to rules on market manipulation, quote behavior, and reporting obligations.
6. Future Trends in Market Microstructure and Strategy
The field continues to evolve rapidly due to technological innovation and regulatory developments:
AI-Driven Execution: Adaptive algorithms that learn market patterns in real time.
Cross-Asset and Cross-Market Arbitrage: Exploiting inefficiencies across asset classes and global exchanges.
Decentralized Finance (DeFi) Microstructure: Applying traditional market microstructure concepts to blockchain-based exchanges and automated market makers.
Sustainable and ESG-Informed Trading: Incorporating environmental and social factors into trading strategies.
Conclusion
Advanced trading strategies and market microstructure are deeply intertwined. Microstructure provides insights into how trades are executed, how liquidity and prices behave, and how different participants interact. By leveraging this knowledge, sophisticated traders can design strategies that optimize execution, manage risk, and exploit inefficiencies. In a competitive and technologically evolving market, the ability to integrate microstructure insights with algorithmic execution is often what separates consistently profitable traders from the rest. Understanding these dynamics is not just an academic exercise—it is a practical necessity for anyone looking to succeed in modern financial markets.

Equity Market Trends: An In-Depth Analysis1. Defining Equity Market Trends
At its core, an equity market trend refers to the general direction in which stock prices move over a period. These trends can be upward (bullish), downward (bearish), or sideways (neutral/consolidation). Bullish trends indicate sustained buying pressure, reflecting optimism about the economy or specific sectors. Conversely, bearish trends signify prolonged selling pressure, often triggered by negative economic signals, corporate earnings disappointments, or geopolitical tensions. Sideways trends occur when the market fluctuates within a range without a clear directional bias, often reflecting indecision among investors.
Trends are influenced by a combination of fundamental, technical, and behavioral factors. While fundamental factors relate to corporate earnings, macroeconomic indicators, and monetary policies, technical factors focus on price patterns, moving averages, and market volumes. Behavioral factors capture investor psychology, herd behavior, and sentiment-driven trading.
2. Historical Trends and Market Cycles
Historically, equity markets exhibit cyclicality. Markets move in long-term secular trends, lasting several years, superimposed with short-term cyclical fluctuations driven by economic and corporate cycles. For instance, the post-World War II era saw sustained growth in global equities, punctuated by periods of correction during recessions, oil crises, and financial meltdowns such as the 2008 Global Financial Crisis.
Equity markets often follow the four phases of market cycles:
Accumulation Phase: Smart money or institutional investors begin buying stocks at undervalued levels.
Mark-Up Phase: Rising prices attract broader participation, leading to bullish trends.
Distribution Phase: Early investors start booking profits, slowing growth.
Mark-Down Phase: Pessimism prevails, resulting in sustained declines.
Recognizing these phases helps investors anticipate trend reversals and manage risk effectively.
3. Key Drivers of Equity Market Trends
Equity trends are shaped by a multitude of interconnected factors:
a. Macroeconomic Indicators
Economic indicators such as GDP growth, inflation, interest rates, unemployment, and industrial production heavily influence stock market trends. For example, strong GDP growth and low unemployment generally foster bullish sentiment. Conversely, rising inflation or tightening interest rates may trigger bearish trends as borrowing costs increase and corporate profits are pressured.
b. Corporate Earnings
Earnings growth is a primary determinant of stock performance. Consistently strong earnings growth supports rising stock prices, while disappointing results can trigger corrections. Investors often rely on forward-looking earnings estimates to gauge potential market directions.
c. Monetary and Fiscal Policy
Central bank policies, including interest rate adjustments and quantitative easing, directly impact equity markets. Lower interest rates reduce borrowing costs, making equities more attractive relative to fixed-income securities. Similarly, fiscal stimulus measures, such as tax cuts or government spending, can boost investor confidence and drive market rallies.
d. Global Events
Equity markets are increasingly interconnected. Geopolitical tensions, trade wars, pandemics, and technological disruptions can create volatility. For example, the COVID-19 pandemic caused a sharp market sell-off in early 2020, followed by an unprecedented recovery fueled by global stimulus.
e. Sectoral Trends
Not all sectors move in unison. Technology, healthcare, energy, and financials often exhibit independent trends based on sector-specific developments. Investors track sector rotation strategies to capitalize on these divergences, moving capital from overvalued sectors to those with higher growth potential.
4. Technical Analysis and Trend Identification
Technical analysis plays a critical role in identifying and confirming market trends. Common tools include:
Moving Averages: Indicators like the 50-day and 200-day moving averages help identify bullish or bearish momentum. A crossover between short-term and long-term averages often signals trend reversals.
Trendlines and Channels: Connecting price highs and lows visually highlights the market’s direction.
Momentum Indicators: Tools like RSI (Relative Strength Index) and MACD (Moving Average Convergence Divergence) help assess whether the market is overbought or oversold.
Volume Analysis: High trading volumes during price increases suggest trend strength, while low volumes may indicate weakening momentum.
Technical analysis provides insights into entry and exit points, trend duration, and potential reversals, complementing fundamental analysis.
5. Investor Behavior and Sentiment
Equity trends are also heavily influenced by behavioral finance. Psychological factors, such as fear, greed, and herd mentality, often exaggerate market movements. For instance:
Fear-driven sell-offs can lead to panic-induced bearish trends.
Speculative bubbles form when optimism drives overvaluation, as seen during the dot-com bubble of the late 1990s.
Market sentiment indicators, such as the VIX (Volatility Index), measure investor anxiety and help anticipate trend shifts.
Understanding sentiment allows investors to make contrarian moves, buying during pessimism and selling during irrational exuberance.
6. Recent Equity Market Trends
In the past decade, global equity markets have exhibited several notable trends:
Technology-led Bull Market: Growth in digitalization, cloud computing, and AI has fueled long-term bullish trends in technology stocks.
Sustainable and ESG Investing: Increasing focus on environmental, social, and governance factors has shifted capital toward sustainable investments, impacting sector trends.
Market Volatility: Geopolitical tensions, inflationary pressures, and interest rate cycles have resulted in alternating bullish and bearish phases.
Retail Investor Influence: Platforms enabling easy stock trading have introduced new dynamics, contributing to rapid price swings and short-term trends.
Emerging trends include AI-driven investment strategies, algorithmic trading, and growing interest in thematic and global ETFs, further diversifying equity market behavior.
7. Risk Management in Trending Markets
While trends offer opportunities, they also carry risks:
Trend Reversals: Markets can suddenly reverse due to economic shocks or geopolitical events, causing significant losses.
Overvaluation: Extended bullish trends may lead to asset bubbles.
Liquidity Risks: Sudden sell-offs can strain liquidity, especially in small-cap stocks.
Investors manage these risks through diversification, hedging strategies, and systematic monitoring of trend indicators. Setting stop-loss limits and maintaining a balanced portfolio are essential for capital preservation.
8. Conclusion
Equity market trends are a dynamic interplay of economic fundamentals, corporate performance, investor sentiment, and global events. Understanding these trends requires a holistic approach that combines macro analysis, technical tools, behavioral insights, and risk management. Long-term success in equities depends on recognizing the market cycle, tracking macroeconomic shifts, and identifying sector-specific opportunities.
While trends offer avenues for wealth creation, they demand disciplined investment strategies, continuous learning, and the ability to adapt to changing market conditions. With globalization, technological innovation, and increasing retail participation, equity market trends are becoming more complex, volatile, and interconnected, presenting both opportunities and challenges for investors worldwide.
In essence, equity market trends are not just about price movements—they are reflections of economic realities, corporate health, investor psychology, and global dynamics. By studying trends rigorously, investors can navigate the uncertainties of the market, capitalize on growth opportunities, and safeguard their investments against volatility. In the modern financial ecosystem, staying attuned to equity market trends is both an art and a science, requiring analytical acumen, emotional discipline, and strategic foresight.

KRISHNADEFKRISHNADEF
bullish trend is Showing on the chart.
buy signals in
technical indicators and
ascending triangle chart pattern.
BUYING RANGE 1000/1020
Watch for a breakout above 1000/1020 to sustain the bullish trend. If the resistance holds, there could be a retest towards 800/825 and an uptrend from here.

Nifty possible roadmap for today & tomorrowIn 30 mins timeframe, Nifty 50 making irregular flat correction.
Wave B crosses starting point on upside and fall today. This fall possibly will come in impulse and finish below 24919 level. and then possible upmove again for 24450+.

Elliott Wave Analysis XAUUSD – January 30, 2025
1. Momentum
Weekly timeframe (W1)
Weekly momentum is currently rising. With this condition, the market is likely to continue moving higher or remain sideways for at least the next 1–2 weeks.
Daily timeframe (D1)
Daily momentum is currently declining. This suggests that over the next 1–2 days, price may continue to fall or move sideways until D1 momentum reaches the oversold zone.
H4 timeframe
H4 momentum is compressed and overlapping in the oversold area. This indicates that the current bearish or sideways phase may continue, however, the probability of a bullish reversal on H4 is relatively high.
2. Wave Structure
Weekly Wave Structure (W1)
On the weekly chart, the five-wave structure (1–2–3–4–5) in blue is still forming.
Yesterday, price experienced a strong decline. However, to confirm that blue wave 5 has completed, price needs to produce a bearish close below the 4282 level.
At the moment, since W1 momentum remains bullish, this decline is more likely a corrective move within blue wave 5, rather than a completed top.
Daily Wave Structure (D1)
Daily momentum is declining, therefore price may continue to move lower or sideways for another 1–2 days until D1 momentum reaches oversold conditions.
Within the context of blue wave 5, price is likely forming yellow wave 4, which belongs to the internal 1–2–3–4–5 yellow structure of blue wave 5.
Once yellow wave 4 is completed, price is expected to resume its advance to form yellow wave 5, thereby completing blue wave 5.
From the RSI perspective, the previous rally reached extremely overbought conditions. This suggests that buying pressure remains strong enough to support at least one more push to a new high, potentially accompanied by bearish divergence at the top. This further supports the scenario that yellow wave 5 will form, and that the market is currently in yellow wave 4.
H4 Wave Structure
The current decline has already reached the 0.382 Fibonacci retracement of yellow wave 3.
From a momentum standpoint, D1 momentum is still declining, so in the near term, another 1–2 days of decline or sideways movement remain possible. Meanwhile, H4 momentum is compressed in the oversold zone, indicating a high probability of a bullish reversal on H4.
Therefore, the most likely scenario is continued sideways movement on H4, or a minor continuation lower before a bullish reaction develops.
RSI from the prior bullish leg remains in a strongly overbought condition, reinforcing the idea that the current decline is corrective in nature, and that the market may still form a new high afterward.
3. Trading Plan
Swing setups:
At this stage, there are no attractive swing positions, as the market is currently in the late phase of an extended wave, where price behavior becomes difficult to predict.
Additionally, today is Friday and also the monthly candle close, which significantly increases volatility risk. The appropriate approach is to remain patient and observe, waiting for D1 momentum to reach the oversold zone, at which point higher-probability swing setups can be considered.

NIFTY 25000 PE GOOD TO BUY“Expecting Nifty to fall.”
SAFE TO ENTER ONLY ABOEV THIS ZONE
“Nifty is expected to move down.”
“Bearish view on Nifty.”
NLong

Premium Chart Pattern Limitations
No Guarantees: Patterns only indicate probabilities, not certainties.
False Signals: Markets can generate fake breakouts or pattern failures.
Subjectivity: Interpretation can vary among traders.
Context Matters: Patterns work best with trend confirmation and other technical indicators like RSI, MACD, and moving averages.

XAUUSD – H1 volatility surge | liquidity reset ongoingMarket Context
Gold is entering a high-volatility phase after an extended bullish run. The recent sharp impulse down from the upper zone is not random — it reflects liquidity distribution and aggressive profit-taking near highs, amplified by fast USD flows and event-driven positioning.
In this environment, Gold is no longer trending smoothly. Instead, it is rotating between liquidity zones, creating two-way risk intraday.
➡️ Key mindset: trade reactions at levels, not direction.
Structure & Price Action (H1)
The prior bullish structure has been temporarily broken by a strong bearish impulse.
Price failed to hold above 5,427 – 5,532, confirming this area as active supply / distribution.
The move down shows range expansion, typical after ATH phases.
Current price action suggests rebalancing and liquidity search, not a confirmed macro reversal yet.
Key read:
👉 Above supply = rejection
👉 Below supply = corrective / bearish bias until proven otherwise
Trading Plan – MMF Style
🔴 Primary Scenario – SELL on Pullback (Volatility Play)
While price remains below key supply, selling reactions is favored.
SELL Zone 1: 5,427 – 5,432
(Former demand → supply flip + trendline rejection)
SELL Zone 2: 5,301 – 5,315
(Mid-range supply / corrective retest)
Targets:
TP1: 5,215
TP2: 5,111
TP3: 5,060
Extension: 4,919 (major liquidity pool)
➡️ Only SELL after clear rejection / bearish confirmation.
➡️ No chasing breakdowns.
🟢 Alternative Scenario – BUY at Deep Liquidity
If price sweeps lower liquidity and shows absorption:
BUY Zone: 4,920 – 4,900
(Major demand + liquidity sweep zone)
Reaction targets:
5,060 → 5,215 → 5,300+
➡️ BUY only if structure stabilizes and bullish reaction appears.
Invalidation
A clean H1 close back above 5,432 invalidates the short-term bearish bias and shifts focus back to bullish continuation.
Summary
Gold is transitioning from trend extension to volatility expansion.
This is a market for discipline and level-based execution, not prediction.
MMF principle:
Volatility = opportunity, but only for those who wait for reaction.
Trade the levels. Control risk. Let price confirm.

XAUUSD Full Technical Analysis (Multi-Timeframe View)Market Structure:
Gold has shifted from a strong bullish impulse into a corrective bearish phase on the lower timeframes. After rejecting from the 5600–5580 supply zone, price formed a clear Change of Character (ChoCH) followed by multiple Bearish Breaks of Structure (BOS), confirming short-term trend weakness. The impulsive selloff toward 5110 indicates aggressive profit booking and institutional distribution from higher levels.
Trend & Momentum:
On the 5-minute chart, price remains below key dynamic resistances (EMA cluster & VWAP), which keeps the intraday bias bearish. Momentum has slowed near 5230–5240, where price is consolidating inside a demand zone with visible volume support, suggesting short-term stabilization but not yet a confirmed reversal. Any bullish move from here is currently corrective unless structure changes.
Key Levels:
Immediate Resistance: 5280 → 5320 → 5415
Major Supply Zone: 5450–5500
Immediate Support: 5230 → 5200
Major Demand: 5110–5050
Scenarios:
Bullish Case: A sustained break and acceptance above 5280–5300, followed by a BOS, could open a recovery toward 5415 and possibly 5450. This would signal buyers regaining short-term control.
Bearish Case (Preferred): Failure to reclaim 5280 keeps price vulnerable to another selloff toward 5200, and a breakdown below 5110 would expose 5050–5000 next.
Conclusion:
Overall bias remains bearish to neutral in the short term, with current price action suggesting a pause or corrective bounce rather than trend reversal. Traders should wait for structure confirmation—either a bullish BOS above resistance for longs or rejection from resistance to continue selling rallies. Patience is key until the market shows clear intent.

PIRAMALFIN 1 Day View 📌 Current Price (Live NSE)
• ~₹1,750.30 (down ~‑2.16%)
• Day Low ~₹1,741.00
• Day High ~₹1,779.90
📊 Daily Pivot Levels (Classic)
(calculated from previous trading session price range)
Level Value
Pivot Point (PP) ₹1,776.93
Resistance 1 (R1) ₹1,838.37
Resistance 2 (R2) ₹1,882.83
Resistance 3 (R3) ₹1,944.27
Support 1 (S1) ₹1,732.47
Support 2 (S2) ₹1,671.03
Support 3 (S3) ₹1,626.57
📌 Intraday Interpretation (1D TF)
Bullish if:
✔ Price holds above Pivot ~₹1,777
✔ Break above R1 ~₹1,838 signals stronger upside bias
Bearish if:
🔻 Price stays below Pivot ~₹1,777
🔻 Break below S1 ~₹1,732 could open slide toward S2/S3 levels
Today’s trading bias (current):
• Price below pivot — short‑term bearish/neutral tone intraday
• Key support to watch: ₹1,732 → ₹1,671 zone
📈 Other Intraday Technicals (from recent session)
• RSI (short‑term) around ~58 (neutral/upper range)
• EMA/SMA 20 day near ~1,772–1,783 — acting as dynamic resistance area
• Volume & range suggest typical NBFC trading volatility today.

GROWWGROWW
bullish trend is Showing on the chart.
buy signals in
technical indicators and
cup with handle & ascending triangle chart pattern.
BUYING RANGE 165/170
Watch for a breakout above 170/175 to sustain the bullish trend. If the resistance holds, there could be a retest towards 150/155and an uptrend from here.


TATASTEELTATASTEEL
bullish trend is Showing on the chart.
buy signals in
technical indicators and
cup with handle chart pattern.
BUYING RANGE 180/185
Watch for a breakout above 180/185 to sustain the bullish trend. If the resistance holds, there could be a retest towards 160/165 and an uptrend from here.

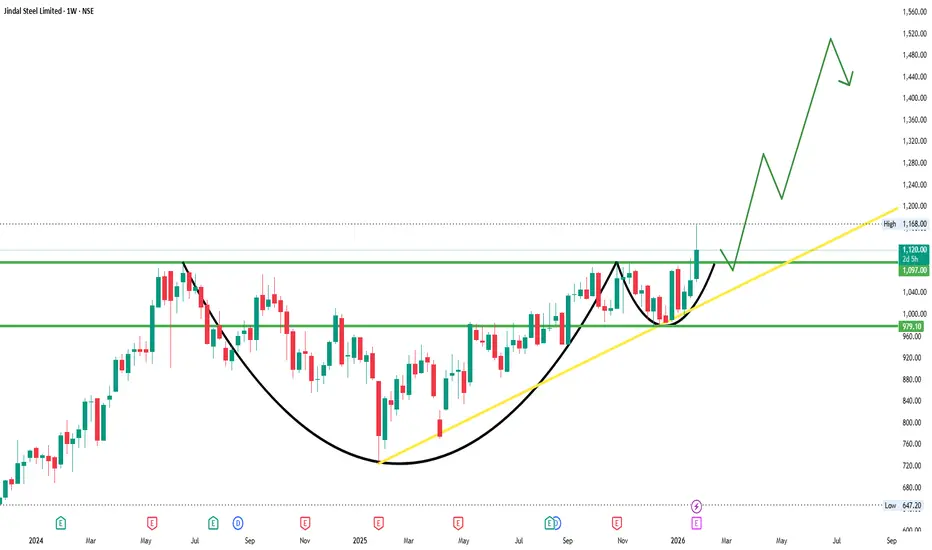
JINDALSTELJINDALSTEL
bullish trend is Showing on the chart.
buy signals in
technical indicators and
cup with handle & ascending triangle chart pattern.
BUYING RANGE 1090/1100
Watch for a breakout above 1090/1100 to sustain the bullish trend. If the resistance holds, there could be a retest towards 975/980 and an uptrend from here.