$DXY | Macro Breakdown Continues | Target 80Timeframe: Monthly / 6M
Bias: Bearish
DXY has confirmed a multi-decade structural breakdown on higher time frames.
This is not a pullback — it’s a cycle shift.
Previous support flipped into resistance
Failed reclaim = continuation signal
Similar structure last seen pre-2008
🎯 Target: 80
❌ Invalidation: Monthly close above 100
Weak dollar = strong hard assets.
🟡 GOLD | Dollar Breakdown Fuel | Multi-Year Bull Case
Timeframe: Weekly / Monthly
Bias: Strong Bullish
With DXY breaking down on HTF, gold enters a macro expansion phase.
Inverse correlation with DXY
Central bank accumulation
Currency debasement hedge
🎯 Expectation: New ATHs over coming quarters
📌 Pullbacks = accumulation, not distribution
Gold moves first when trust in currency fades.
₿ BITCOIN | Late Reaction, Explosive Outcome
Timeframe: Weekly
Bias: Bullish (Lagging but Powerful)
Bitcoin historically reacts after DXY breakdown is accepted by markets.
Sequence: DXY ↓ → Liquidity ↑ → Gold ↑ → Bitcoin explodes
Fixed supply asset
Digital hedge against fiat dilution
Volatility = opportunity
🎯 Expectation: Sharp upside once narrative shifts fully to “weak dollar”
🔥 One-Line Macro Thesis (Perfect for caption)
This is not a bull market. This is a currency reset trade.
X-indicator

Is it still a good buy?OIL India CMP 448
Fibs- The deep correction from the highs halted at 327( 61.8%) of its major swing, indicating that the bull trend is still intact. The support above the 50% post that is telling me the stock is now preparing to move north.
Elliott- Yet an example of how the 4th waves trend to cluster together. Thats the natural support zone in Elliott. The 5th impulse wave has started and the minimum tgt from here is the high of wave 3. That is a good 65% from the CMP of 448.
RSI - RSI taking support above the bull zone is telling me the trend is intact.
MA- the two faster MA's about to converge and is indicating strength.
Trendline - the stock bouncing off the trendline is telling the trend is still intact.
Conclusion - Hence this stock looks like a good buy to me.

INDUSINDBANK-long for 20 % BULLISH POINTS (CONFLUENCE-BASED)
1️⃣ Inverse Head & Shoulder–type structure (trend reversal)
Left shoulder → Head → Right shoulder well formed
Price has reclaimed the neckline zone (~880–895)
This structure usually signals medium-term trend reversal
📌 Bullish implication:
Downtrend exhaustion → accumulation → upside continuation
2️⃣ 18 EMA crossing ABOVE 50 EMA (weekly)
This is a bullish moving-average crossover
Indicates trend shift from bearish to bullish
Happens after basing, hence more reliable
📌 Bullish implication:
Momentum turning in favor of bulls, not just a dead-cat bounce
3️⃣ Strong bounce from 18-week EMA
Recent pullback respected 18 EMA
Buyers stepped in exactly at dynamic support
📌 Bullish implication:
Institutions defending trend → higher probability of continuation
4️⃣ Price holding ABOVE key moving averages
Price above:
18 EMA
50 EMA
Long red 100/200 EMA above = mean reversion potential
📌 Bullish implication:
Once price accepts above 900, fast move toward 1000+ possible
5️⃣ Higher Low structure intact
Head low → right shoulder higher low
Confirms change in market structure (CHoCH)
📌 Bullish implication:
Bear control broken, buyers in control
6️⃣ Volume contraction during pullback
Pullbacks happening on lower volume
Expansion seen on green candles earlier
📌 Bullish implication:
Healthy consolidation, not distribution
7️⃣ RSI holding above 50
RSI ~57 on weekly
Bullish regime = RSI 50–70
📌 Bullish implication:
Momentum supports upside continuation
8️⃣ MACD improving
MACD histogram rising
Signal line crossover visible

Netflix (NFLX) Forming Strong Base Near 200 EMANFLX has corrected from its recent highs and is now approaching a strong support zone near the 200 EMA on the weekly chart. Price is showing signs of stabilization after a healthy pullback.
The RSI is currently near oversold territory, indicating weakening selling pressure and a possible momentum shift. Historically, NFLX has reacted positively from this level, making it an important area for buyers.
Technical Observations:
• Price near long-term support (200 EMA)
• RSI approaching oversold zone
• Previous resistance turning into support
• Downtrend losing strength
Bullish Scenario:
If price holds above this support and shows confirmation, we may see a potential trend reversal towards:
• First Target: 95 – 100
• Second Target: 110 – 120
Invalidation:
A sustained close below 80 may weaken the bullish structure.
This is for educational purposes only. Always follow proper risk management.

#DCBBANK - BreakOut in DTF with Volume Script: DCBBANK
Key highlights: 💡⚡
📈 C&H BreakOut in Daily Time Frame
📈 Volume spike during Breakout
📈 Base BreakOut
📈 RS Line making 52WH
📈 MACD Crossover
BUY ONLY ABOVE 200 DCB
⏱️ C.M.P 📑💰- 199.62
🟢 Target 🎯🏆 – 12%
⚠️ Stoploss ☠️🚫 – 6%
⚠️ Important: Market conditions are BAD, Avoid entering any Trade. Protect Capital Always
⚠️ Important: Always Exit the trade before any Event.
⚠️ Important: Always maintain your Risk:Reward Ratio as 1:2, with this RR, you only need a 33% win rate to Breakeven.
✅ Boost and Follow to never miss a new idea!✅
Disclaimer: I am not SEBI Registered Advisor. My posts are purely for training and educational purposes. Not a BUY or SELL recommendation.
Eat🍜 Sleep😴 TradingView📈 Repeat 🔁
Happy learning with MMT. Cheers!🥂

Daily 1:30 PM IST Crude Oil Trend Setup StrategyPrice action traders on MCX WTI Crude Oil can capture reliable intraday trends by focusing on setups around 1:30 PM IST, using 15-minute - 1hr charts with support/resistance levels and a 10-20 EMA crossover confirmation. This timing aligns with active MCX sessions when momentum builds post-initial volatility.
Chart Analysis
The attached TradingView chart shows CFD WTI Crude Oil on a hourly timeframe.
Core Setup Rules
Monitor price action at exactly 1:30 PM IST for candlestick reversals (e.g., hammers or engulfing) at drawn support/resistance zones.
Confirm entry with 10 EMA crossing above 20 EMA for longs (or reverse for shorts), ensuring alignment with higher timeframe trend.
Target 20 points profit with 15-point stop-loss from entry, as seen in similar crude strategies.
Risk Management Tips
Risk 0.5-1% of capital per trade, trailing stops to breakeven after 10 points. Avoid setups during major news like EIA reports (~8 PM IST). Backtest on TradingView for Nifty/MCX consistency, given your intraday focus. This yields high-probability daily trades in volatile commodities like crude.

NIFTY 50 SET TO OUTPERFORM SMALL CAPS BY A LONG WAYChart is telling the obvious. Nifty is going to outperform, if Both rise then Nifty rises faster and if both falls then Nifty falls slower compared tio Small caps. The trend to continue for coming several months.

INDIAN BOND MARKET IS SET FOR CRASH - HEADED TO 16%With rae cuts by RBI in last 1 year, seems like a eyewash, reality will soon catch up. RBI will be forced to increase interest rates with Bond market slated to crash and yield spikinng to insane 16% or more levels

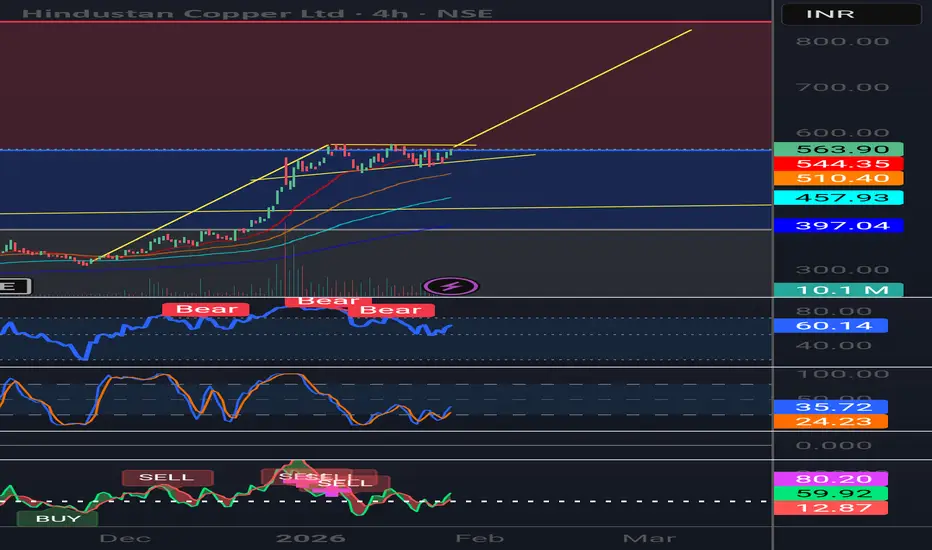
Bullish pennant HindCopperStrong uptrend. Price is consolidating just below resistance (~₹565–570). This looks like a healthy pause after a sharp rally. Expectation: a breakout above ₹570 can lead to a fast move higher; downside remains limited as long as ~₹545 holds.
Next possible targets (on upside):
₹620–630 → first immediate target after breakout
₹650 → next resistance / partial profit zone
₹700–720 → measured move if momentum sustains
Final target 820
Key condition: these come into play only if price sustains above ~₹570.
Part 2 Intrday Institutional TradingPsychology of Option Trading
Trading is 80% mindset, 20% strategy.
You must learn to:
Accept losses
Avoid revenge trading
Stick to plan
Control emotions
Avoid fear of missing out (FOMO)
Consistent success requires discipline.

Gold 5200/1h ChartGold moving in channel from last 10 days. I believe breaking the 5110 level will put gold to new high of 5200. Although I don't see this happing today. Failing to do so might trigger a profit booking as it has already moved 15% from previous high (+last 7 days green candle closing).
Be vigilant with SL, and don't go all in.

MAJOR INDEX OUTLOOK | NASDAQ (US100) Market Structure Update Global indices are currently approaching critical decision zones, and NASDAQ (US100) is showing a
notable shift in short-term market sentiment.
After a prolonged corrective phase, the H1 time frame now confirms a bullish structural transition —
price is forming Higher Highs and Higher Lows, indicating that buyers are gaining short-term control.
However, the index is now testing a major resistance zone near 26,000 — a psychological level combined
with historical supply pressure.
This is a decisive area.
Key Technical Levels
🔺 Major Resistance:
26,000 (Psychological Level)
26,150 (Recent Swing High)
🔻 Immediate Support:
25,750
🔻 Structural Support:
25,600
Scenario 1: Bullish Breakout Continuation
A strong H1 candle close above 26,050 could trigger continuation momentum.
Upside Targets:
➡️ 26,200
➡️ 26,350
A breakout followed by a clean retest of 26,000 as support would offer higher-probability confirmation.
Scenario 2: Bearish Rejection
If price fails to sustain above 26,000–26,050 and prints rejection wicks or bearish confirmation,
a corrective pullback may follow.
Downside Targets:
➡️ 25,750
➡️ 25,600
Lower-high confirmation on M15 would strengthen the rejection case.
Market Note
NASDAQ is highly volatile during impulsive phases. Entering directly into resistance without
confirmation increases risk exposure significantly.
Disciplined execution and controlled position sizing remain essential.
Current Bias: Short-Term Bullish (Caution at 26,000 Resistance)
The reaction around 26,000 will likely determine the next 150–300 point directional move.
#NASDAQ #US100 #IndexTrading #MarketStructure #ForexAnalysis #TechnicalAnalysis #MustProfitFX
Disclaimer: This content is for educational purposes only. Trading involves significant risk.

Will DALBHARAT give 20% returns? cmp 2105Stock Update - *Dalmia Bharat cmp 2108*
Stock has corrected around 22% from its recent high and taken support near the 1932 - 1995 on weekly demand zone.
In the latest quarter, Dalmia Bharat reported a significant improvement in Q3 earnings compared to the previous quarter.(QoQ)
Technically, a key support zone is holding and price action from here suggests a potential bullish turn. Major upside resistance placed at 2400
*8% to 20% Upside Potential*

HMVL 1 Month Time Frame 📊 Current Price Snapshot (Latest Close)
- Approximate latest price: ₹70.9 – ₹72.2 per share (data from multiple live sources on 23 Jan 2026) showing HMVL trading around ~₹71–₹72 levels.
- Intraday range: ₹69.00 – ₹72.00 recently observed.
- 52‑week range: ₹61.76 (low) to ₹103.40 (high).
📈 1‑Month Performance
- Over the past 1 month, the stock’s performance shows a slight decline or mild sideways move: approx −1 % to −3 % change depending on the exact start/end dates used (TradingView indicated ~‑2.75 % monthly fall).
- Other data suggests very modest monthly change (slight positive/negative depending on source).
📅 Recent Daily Price Levels (Indicative)
From historical price data for the first half of January 2026:
01 Jan 2026: ~₹68.5
06 Jan 2026: ~₹70.4
09–12 Jan 2026: ~₹66‑₹69
16–23 Jan 2026: ~₹69‑₹72
→ This shows a 1‑month trading range roughly between ~₹65 and ~₹72.
📍 1‑Month Key Levels to Watch
Support zone: ~₹65 – ₹67 (recent lows).
Near‑term resistance: ~₹72 – ₹74 (recent highs).
Mid‑range pivot: ~₹69 – ₹71 — recent close vicinity area.

Part 2 Technical Analysis VS. Institutional Option Trading Why Do Traders Use Options?
Options are used for:
✔ Speculation
Predicting whether the price will move up or down.
✔ Hedging
Insurance for your portfolio or positional trades.
✔ Income Generation
Through option selling strategies.
✔ Risk Management
You can cap losses while maintaining unlimited upside potential.
✔ Leverage
Small premium → big exposure.
✔ Flexibility
You can design strategies for all market conditions:
Uptrend
Downtrend
Range-bound
High volatility
Low volatility

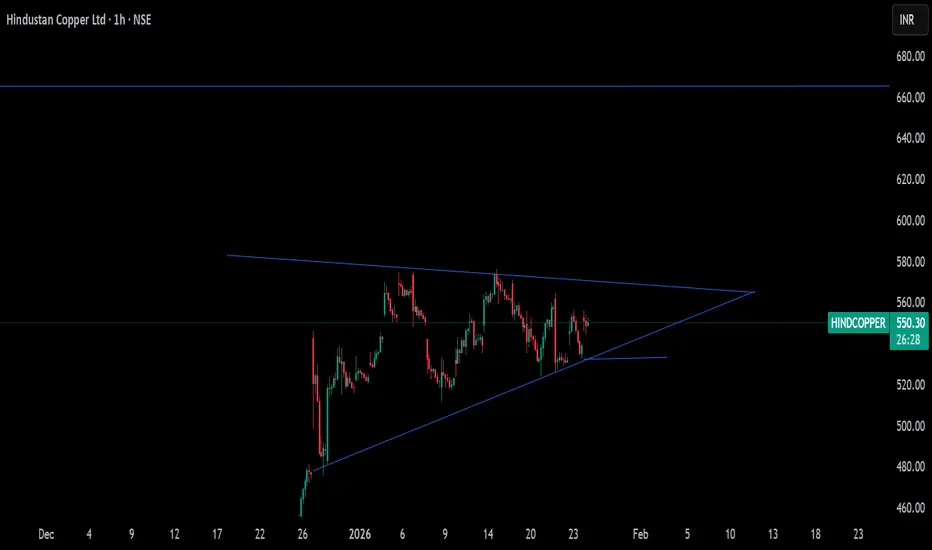
HindCopper to test ATH!!Nifty Metals are in a cyclical bull run. HindCopper has taken a perfect support in a bullish channel. One can plan a long position with an SL below the channel, targetting ATH levels of 670.
Paytm In this chart we clearly see that on B wave triangle correction is over. Now in upcoming days we can see major fall. Because B wave is over and we all know is the B wave is over then we may see sharp C wave in 5 waves ..
Disclaimer:- Invest at your own risk,, i am not register with Sebi.. This chart is according to my technical analysis which i learnt from past years

GBPUSD – Support Holding, Watching Reaction From RangeGBP/USD has reacted from a well-defined support zone, an area where buyers have stepped in multiple times before. Price is currently trading between clear support and resistance, indicating a short-term range environment.
As long as this support holds, upside reactions toward the resistance zone remain possible. A clean break below support, however, would weaken this structure and change the short-term bias.
This is a reaction-based zone, not a prediction. Let price confirm the next move.
Disclaimer: This analysis is for educational purposes only and does not constitute financial advice. Trading involves risk. Please manage risk responsibly.

Breakout Stock: Tanla PlatformsTanla platform Ltd, one of best Anti Phishing making company mwith strong fundamentals has recorded a strong Q3 performance, beating market expectations.
Record revenue growth was driven by higher adoption of its cloud communications platform and solid enterprise demand. Management highlighted margin stability, cost discipline and healthy cash flows, boosting investor confidence.
Support: 432, 471
Resistance: 507, 536, 578, 613

BIKAJI 1 Week View 📌 Current Price Snapshot (Weekly Context)
Current trading price: ~₹645 – ₹651 (NSE) — price has been trending lower recently.
1‑week return: down ~6–7% (indicating short‑term bearish momentum).
📊 Weekly Support & Resistance Levels (Key Zones)
🔹 Resistance (Upside)
These are levels where price may face selling pressure if it tries to rebound:
R1: ~₹680 – ₹686
R2: ~₹695 – ₹700
R3: ~₹710 – ₹722
(these are key weekly/week pivot‑type resistance zones)
🔸 Current Pivot / Short‑Term Reference
Pivot zone: ~₹668 – ₹670 (central bias level)
This is useful for gauging bullish vs bearish bias for the week.
🔻 Support (Downside)
These are levels where buyers could step in on weakness:
S1: ~₹650 – ₹642
S2: ~₹635 – ₹630
S3: ~₹620 – ₹619
(weekly support zones below current price)
📈 How to Interpret These Levels (1‑Week Lens)
🎯 Bearish scenario
If price closes below ~₹640–₹635 on weekly candles → next support around ₹620 becomes important. Continuous closes below that could see deeper pullbacks.
📈 Bullish/Recovery scenario
For a bullish shift at this 1‑week timeframe:
Break above ₹680–₹690 zone convincingly → next upside toward ₹700+
Weekly close above ₹700–₹710 strengthens the reversal thesis.
🟡 Neutral/Range scenario
Between approx ₹650–₹690, expect sideways movement / consolidation with likely choppy action.

KARURVYSYA Bank is Buy for 11% upside possibility in 30-40 days.KARURVYSYA Bank is Buy for 11% upside possibility in 30-40 days.
LTP - 263
SL - 254
Target - 290+
Happy investing.

4H Rejection Block & Return to EquilibriumGold (XAUUSD) has rallied aggressively but is now showing signs of exhaustion as it taps into the supply zone around the 5080-5100 level. We are seeing a rejection on the 4H timeframe, suggesting a potential shift in momentum.

AVL 1 Day View📅 Daily (1‑Day) Technical Levels – Aditya Vision Ltd
📌 Current Approx Price (Latest)
~₹474–₹483 range around current trading session (today’s intraday range seen) — price fluctuates in this band.
📊 Pivot / Reference
Pivot ~ ₹479–₹484 (central reference for bias — above = bullish, below = bearish).
🟩 Resistance Levels (Upside)
R1: ~ ₹484–₹485 – first upside barrier.
R2: ~ ₹489–₹492 – next target if momentum improves.
R3: ~ ₹495–₹500+ – higher resistance zone.
🔻 Support Levels (Downside)
S1: ~ ₹474–₹476 – immediate support.
S2: ~ ₹468–₹470 – intermediate support if S1 breaks.
S3: ~ ₹460–₹463 – deeper support zone.
📈 Interpretation (1‑Day View)
Bullish scenario:
✔️ Price holding above pivot ~₹480 strengthens short‑term bullish bias.
✔️ A break above ~₹490–₹492 can open up ~₹495–₹500+ region.
Bearish scenario:
❌ If price decisively drops below ~₹474–₹476, next supports ~₹468 and ~₹463 may be tested.
