X-indicator

Vedanta 13000+ Targets in next 10 Years suggest Quarterly ChartsVedanta 13000+ Targets in next 10 Years suggest Quarterly Charts.
LTP - 685
Targets - 13000+
Timeframe - 10 Years
Technically Vedanta is following its channel since Inception in 1994. It has move from 0.25 to 143 ... 550x ROI from 2000 till 2010. Post this phase it went in sideway consolidation till 2020 making lows of 27.
Post consolidation Stock is again in uptrend & making New Highs on Monthly basis.
This Rally would continue till 2030 ... Vedanta can be Multibagger for long term Investment.
Happy Investing.


#CHENNPETRO#CHENNPETRO
bullish trend is Showing on the chart.
buy signals in
technical indicators and
Retest cup with handle chart pattern.
Buying Range 830/840
Watch for a breakout above 770/780 to sustain the bullish trend. If the resistance holds, there could be a retest towards 640/650 and an uptrend from here.

Weekly analysis of XAUUS/Gold with buy and sell scenarios...Gold has reached to Level 2 as we analysed few weeks back.
Gold has created a strong weekly momentum candle showing positive sentiment. But there is divergence with volume. Candle is strongest amongst last four weekly candles while volume is lowest. On daily time frame there are consecutive 5 buy candles. RSI is also over 80 and oversold All these brings a caution
So, price may take a pause or pull back to adjust pricing. Now we need to be cautious and plan for rangebound pull back.
1. Price has created higher highs in lower time frames and created micro structures.
2. Now price may pull back with some delivery change in lower time frames.
3. Still, we should be positive till delivery changes at 4H/1H TF.
4. Most probably price will take liquidity of FVG/RDRB level and create MSS/CISD/TS/iFVG in LTF.
5. Price should show rejection/reversal in respective LTF (4H/1h/15m) at FVG zone.
6. Take the trade only once clear entry model i.e. turtle soup. iFVG break, CDS or MSS happens on LTF
All these combinations are signalling a high probability and high RnR trade scenario.
Note – if you liked this analysis, please boost the idea so that other can also get benefit of it.
Also follow me for notification for incoming ideas.
Also Feel free to comment if you have any input to share.
Disclaimer: This analysis is for educational purposes only and does not constitute investment advice. Please do your own research (DYOR) and check with your financial advisor before making any trading decisions.

Multiple time frame RSI bearish diversion Tata steelMultiple time frame RSI bearish diversion Tata steel. This content is for educational and informational purposes only and does not constitute financial, investment, or trading advice. Trading financial markets involves significant risk of loss, and past performance does not guarantee future results. Users are responsible for their own investment decisions and should consult a certified financial advisor.

MRPLMRPL
bullish trend is Showing on the chart.
buy signals in
technical indicators and
Ascending Channel chart pattern.
cup and handle pattern
BUYING RANGE 150/155
Watch for a retest 150/155 to sustain the bullish trend. If the resistance holds, there could be a retest towards 120/125 and an uptrend from here.

XAUUSD – Brian | H3 Technical AnalysisGold continues to trade within a well-defined bullish structure on the H3 timeframe, supported by strong technical momentum. Price action remains orderly, with impulsive advances followed by controlled pullbacks — a characteristic of a healthy trending market.
From a macro standpoint, geopolitical uncertainty remains elevated after recent comments from President Trump regarding increased U.S. control over strategic military areas in Greenland. While not implying direct occupation, the development adds to broader risk sensitivity and continues to support gold’s role as a defensive asset.
Market Structure & Technical Context (H3)
On the H3 chart, XAUUSD remains firmly above its rising trendline, with market structure defined by higher highs and higher lows. A prior break of structure (BOS) confirmed bullish continuation and opened the door for further expansion.
Key technical areas highlighted on the chart:
A strong impulsive leg followed by corrective pullbacks, consistent with trend continuation.
Fibonacci expansion with the 2.618 extension near the 5005 zone, acting as a major reaction area.
A liquidity pullback zone around 4825, aligned with trendline support and suitable for continuation scenarios.
A lower POC / value area acting as deeper support if volatility increases.
As long as price holds above these demand zones, the broader bullish structure remains intact.
Liquidity & Forward Expectations
Upside liquidity remains available above recent highs, while short-term pullbacks are likely driven by profit-taking rather than structural weakness. The 5000–5005 area represents a key decision zone where price may pause or consolidate before the next directional move.
Trading Bias
Primary bias: Bullish continuation while structure holds
Key zones to monitor:
4825 – liquidity pullback / trend continuation
5000–5005 – major extension & reaction zone
Preferred timeframe: H1–H4
Risk management remains essential, particularly in a market sensitive to sudden news flows.
Refer to the accompanying chart for a detailed view of market structure, liquidity zones, and Fibonacci extensions.
Follow the TradingView channel to receive early updates and join the discussion on market structure and price action.

MTARTECHMTARTECH
bullish trend is Showing on the chart.
buy signals in
technical indicators and
Inverse Head & Shoulders (Weekly) chart pattern.
BUYING RANGE 2800/2820
Watch for a breakout above 2800/2820 to sustain the bullish trend. If the resistance holds, there could be a retest towards 2200/2230 and an uptrend from here.

EURUSD BUYou can look to buy the EURUSD from here. Volume in the EURUSD is very high. I don't think it will offer a deep pullback. If I get some LTF confirmation from this zone, I will buy it. You can also monitor your risk management.

Weekly Analysis of BTC - Detailed Another week and price still moved as expected in same range. No major view change since last prediction for long term trades.
Further short-term view.
Week is closed bearish and may target recent draw on liquidities of ~84K. Price may move in choppy mode for some time. So, the best idea is to look for small trade rather than long swing trades.
As the market in rangebound/Choppy, so we should keep eye on both side Opps but focus on down side as next high-level draw on liquidity is at downside.
Refer previous details below for larger perspective…
We analysed three weeks back that BTC would be in range for some time before taking any further move, And BTC is following same analysis and trapped within a small range since then. BTC prediction of last week also worked perfectly well and market kept in consolidation mode itself. BTC is still in consolidation zone and may spend some more days. It may develop ABC pattern or reversal at identified daily FVG level, if price has to change its delivery and take turn from here. This zone is kind of make or break. If price is not able to sustain and breakdown, then it may witness ~65-70K levels as well.
We hope for reversal from this level as price is developing the pattern at higher time frame.
1. Price has taken liquidity or 82K and almost touched 80K.
2. It has inversed 1Day FVG and now price is consolidating in the range between EMAs.
3. We may expect price retracement till 1D iFVG and then reversal.
4. Before to that we may see sweep of 92900 (1D CISD) level and then a retracement short trade till 1D FVG
5. Most probably price will take liquidity of FVG/RDRB level and create MSS/CISD/TS/iFVG in LTF.
6. Price should show rejection/reversal in respective LTF (5m/15m) at FVG zone.
7. Take the trade only once clear entry model i.e. turtle soup. iFVG break, CDS or MSS happens on LTF
All these combinations are signalling a high probability trade scenario.
Note – if you liked this analysis, please boost the idea so that other can also get benefit of it.
Also follow me for notification for incoming ideas.
Also Feel free to comment if you have any input to share.
Disclaimer: This analysis is for educational purposes only and does not constitute investment advice. Please do your own research (DYOR) and check with your financial advisor before making any trading decisions.

Nifty weekly analysis - Detailed Last week Nifty had strong downfall of ~3% because of various factors including global events and selling of FIIs. Week closed with a strong bearish candle with heavy volume showing further downside pressure targeting near draw on liquidity of ~24600. This level has highest volume, which will act as magnet for price.
Order flow is also downside creating lower highs.
Currently price is inside weekly price imbalance zone and at a psychological number of 25000. So, we can expect a pause at this level for few days. So next week may go in range bound mode to bearish.
Over all sentiments are bearish until there is a big positive change appears in global politics.
Critical points ……………….
• Support zone: 24,580–25,050
• Resistance zone: 25,550–25,600
• Bias: Range-bound to mildly bearish for the coming week.
1. If breakout support with volume we may see 24600 levels soon.
Note – if you liked this analysis, please boost the idea so that other can also get benefit of it.
Also follow me for notification for incoming ideas.
Also Feel free to comment if you have any input to share.
Disclaimer: This analysis is for educational purposes only and does not constitute investment advice. Please do your own research (DYOR) and check with your financial advisor before making any trading decisions.

BTCUSD Daily Chart – Corrective Phase with Potential Trendline BPrice Structure:
Bitcoin is trading around $88,800, coming off a strong rejection from the $95k–$97k area. The broader structure since November shows a downtrend transitioning into consolidation, with recent price action respecting a rising diagonal trendline support (blue dashed line). Price is currently testing this trendline, making this a decision zone.
Trend & Key Levels:
Immediate Support: $87,500 – $88,000 (trendline + recent swing lows)
Major Support: $83,000 – $85,000 (range bottom / demand zone)
Immediate Resistance: $91,000 – $92,500
Major Resistance: $95,000 – $100,000
RSI (14):
RSI is around 41.7, below the 50 midline but above oversold. This suggests weak momentum, yet not exhaustion. No strong bullish divergence is confirmed yet, but downside momentum is slowing.
Awesome Oscillator (AO):
AO remains negative, though histogram bars are flattening. This indicates bearish momentum is losing strength, not yet reversed.
MACD (12,26,9):
MACD is still below the zero line with a bearish crossover, but the histogram is contracting. This often precedes either sideways consolidation or a potential bullish reversal if price holds support.
Overall Bias:
Neutral to cautiously bullish if the trendline holds.
A daily close below $87k would invalidate the trendline and open the door toward $83k–$80k.
A strong bounce with volume could target $92k → $95k initially.
Scenario Outlook:
Bullish Scenario: Trendline holds → RSI curls up → MACD histogram flips positive → move toward $95k+
Bearish Scenario: Trendline breaks → increased selling pressure → retest of $83k support zone
Conclusion:
BTC is at a critical inflection point. Momentum indicators are weak but stabilizing, suggesting a possible short-term bounce, though confirmation requires a strong bullish daily close above $91k. Until then, expect choppy price action near support.

Trading with an Automated System (Algorithmic Trading)1. What Is an Automated Trading System?
An automated trading system is a software-based framework that automatically places buy and sell orders in the market without manual intervention. The trader or developer defines a strategy, converts it into a set of logical rules, and programs these rules into the system. Once activated, the system continuously monitors market conditions and executes trades whenever the predefined criteria are met.
For example, a simple automated strategy might be:
Buy when the 20-day moving average crosses above the 50-day moving average.
Sell when the reverse crossover occurs.
The system follows this logic exactly, without emotions or hesitation.
2. How Automated Trading Works
Automated trading generally follows a structured workflow:
Strategy Design
The trader defines a trading idea based on technical analysis, fundamental analysis, quantitative models, or statistical patterns.
Rule Definition
The idea is converted into precise rules, such as entry price, exit price, stop-loss, position size, and time filters.
Backtesting
The strategy is tested on historical data to evaluate performance, drawdowns, win rate, and risk metrics.
Optimization
Parameters are adjusted carefully to improve performance without overfitting to past data.
Deployment
The strategy is connected to a broker or exchange through APIs and runs in real-time.
Monitoring and Risk Control
Even automated systems require supervision to handle errors, slippage, or abnormal market conditions.
3. Types of Automated Trading Strategies
Automated systems can be classified into several categories:
Trend-Following Systems
Use moving averages, breakouts, or momentum indicators to ride market trends.
Mean Reversion Systems
Assume prices revert to an average and trade overbought or oversold conditions.
Arbitrage Systems
Exploit price differences between markets, exchanges, or instruments.
High-Frequency Trading (HFT)
Execute a large number of trades in milliseconds, focusing on very small price movements.
Statistical and Quantitative Models
Use probability, correlation, and mathematical models to identify trading opportunities.
AI and Machine Learning Systems
Adapt strategies dynamically using pattern recognition, sentiment analysis, and predictive modeling.
4. Advantages of Automated Trading
Automated trading offers several powerful benefits:
a. Emotion-Free Trading
Human emotions like fear, greed, and hesitation often lead to poor decisions. Automated systems follow rules strictly, ensuring discipline and consistency.
b. Speed and Efficiency
Computers can scan multiple markets and execute trades in fractions of a second, something impossible for manual traders.
c. Backtesting and Validation
Strategies can be tested on years of historical data, helping traders understand potential risks and returns before risking real capital.
d. Scalability
One system can trade multiple instruments, timeframes, and markets simultaneously.
e. Consistency
The same strategy is executed in exactly the same way every time, removing randomness in decision-making.
5. Risks and Limitations of Automated Trading
Despite its advantages, automated trading is not risk-free:
a. Over-Optimization (Curve Fitting)
A strategy may perform extremely well on historical data but fail in live markets because it was too finely tuned to the past.
b. Market Changes
Markets evolve due to regulations, liquidity shifts, or macroeconomic events. A strategy that worked earlier may stop working.
c. Technical Failures
Internet outages, server crashes, software bugs, or broker API issues can cause losses.
d. False Sense of Security
Automation can make traders complacent. Continuous monitoring and risk management are still essential.
e. Black Swan Events
Extreme events like flash crashes or geopolitical shocks can break normal market behavior, leading to unexpected losses.
6. Risk Management in Automated Trading
Risk management is the backbone of any successful automated system:
Position Sizing Rules limit exposure per trade.
Stop-Loss and Take-Profit Levels control downside and lock profits.
Maximum Drawdown Limits pause or shut down the system if losses exceed acceptable levels.
Diversification across strategies, assets, and timeframes reduces overall risk.
Kill Switches allow traders to immediately stop trading during abnormal conditions.
Without strong risk controls, even the best algorithm can fail.
7. Automated Trading vs Manual Trading
Manual trading relies on human judgment, discretion, and experience. Automated trading relies on logic, data, and execution speed.
Manual trading is flexible but emotionally vulnerable.
Automated trading is disciplined but rigid.
Many professionals use a hybrid approach, where humans design and supervise strategies while machines execute them.
8. Who Uses Automated Trading?
Automated trading is used by:
Retail traders using platforms like MetaTrader, NinjaTrader, or Python-based systems.
Hedge funds and proprietary trading firms.
Investment banks and market makers.
Exchanges and liquidity providers.
With advancing technology, automated trading is no longer limited to institutions; retail participation is growing rapidly.
9. Technology Behind Automated Trading
Key components include:
Programming Languages (Python, C++, Java, Pine Script)
Trading Platforms and APIs
Market Data Feeds
Cloud and Low-Latency Servers
Databases and Analytics Tools
The quality of data and execution infrastructure plays a crucial role in long-term success.
10. Future of Automated Trading
The future of automated trading lies in:
Greater use of AI and machine learning
Integration of alternative data like news, social media, and satellite data
More adaptive and self-learning systems
Increased regulation and risk oversight
Wider adoption among retail traders
Automation will not eliminate human traders but will continue to augment human decision-making.
Conclusion
Trading with an automated system represents a powerful evolution in financial markets. By combining logic, speed, and discipline, automated trading can enhance consistency and efficiency while reducing emotional errors. However, it is not a “set and forget” solution. Success depends on robust strategy design, realistic expectations, continuous monitoring, and strong risk management. When used wisely, automated trading can be a valuable tool for traders and investors seeking systematic and scalable participation in modern markets.

HINDCOPPER 1 Week VIew 📊 Current Price Snapshot
Live/Recent price: ~₹535–₹538 per share on NSE for this week.
52-week range: Low ~₹183.8 — High ~₹576.0; stock remains elevated near recent multi-week highs.
📈 Short-Term Resistance Levels (1-Week View)
These are the price zones where the stock may find selling pressure or pause its upside:
• Immediate Resistance: ~₹550–₹551 — first hurdle this week.
• Next Resistance: ~₹564–₹565 — pivot/resistance area seen on pivot calculations.
• Higher Resistance / Near-term Target: ~₹573–₹578 — extended resistance zone above.
Bullish scenario (this week):
A sustained move above ~₹550–₹565 could open room for tests of the ₹573–₹578 zone.
📉 Short-Term Support Levels (1-Week View)
• Immediate Support: ~₹526–₹527 — first near-term floor.
• Secondary Support: ~₹518–₹520 — next demand zone if price weakens.
• Deeper Short-Term Support: ~₹503–₹505 — more structural support on pullbacks.
Bearish scenario (this week):
A break and close below ~₹518–₹520 on a weekly basis may put pressure on the trend and open tests toward the deeper support band near ₹503–₹505.
📅 Weekly Strategy Levels (Summary)
Level Type Price Area (₹)
Immediate Resistance 550–551
Next Resistance 564–565
Extended Resistance 573–578
Immediate Support 526–527
Secondary Support 518–520
Deeper Support 503–505

Radico Khaitan Buy @ when PE = 67Radico Khaitan Buy @ when PE between 67 and 73.
The Price has followed weekly breakout pattern multiple times, but no clear signal coming from that.
Also, we can see Price falling while Volume rising.

BTC at decision pointThe Big Picture
I’ve been analyzing the 23-hour time frame because it gives a much clearer view of the trend without all the "noise" and manipulation you see on the standard daily chart. After that massive run-up, BTC has been cooling off, and I’m looking to see if our previous support at $86,000 is going to hold or if we’re going deeper.
My Trade Plan
Right now, the 4-hour chart isn't showing much, but the 1-hour and 15-minute charts are telling a different story. Here’s how I’m playing this:
The Short Opportunity: The 15-minute chart is already looking pretty bearish. If the current support level breaks, I expect the price to flush down toward the $85,000 – $85,800 zone. If we cross that line, I’m planning to short with 25x–30x leverage to capture that move down.
The Long Opportunity: I’m only looking to go long if we see a definitive bounce right here. I’m not going to guess the bottom—I’ll wait for the market to show me it wants to move back up first.
Final Thoughts
I’m leaning toward the bearish side for the moment, but I’m staying patient. I’ll let the price come to my level, and once that support breaks or holds, I’ll take the trade.
Let me know what you think of this setup in the comments. Good luck with your trades!

Bank Nifty spot 58473.10 by Daily Chart view - Weekly UpdateBank Nifty spot 58473.10 by Daily Chart view - Weekly Update
- Support Zone 57665 to 58250 for Bank Nifty
- Resistance Zone 58850 to 59350 for Bank Nifty
- Since a while the indicative Support and Resistance Zone are just an eyewash as they hardly sustain by the unprecedented Geo-Political happenings

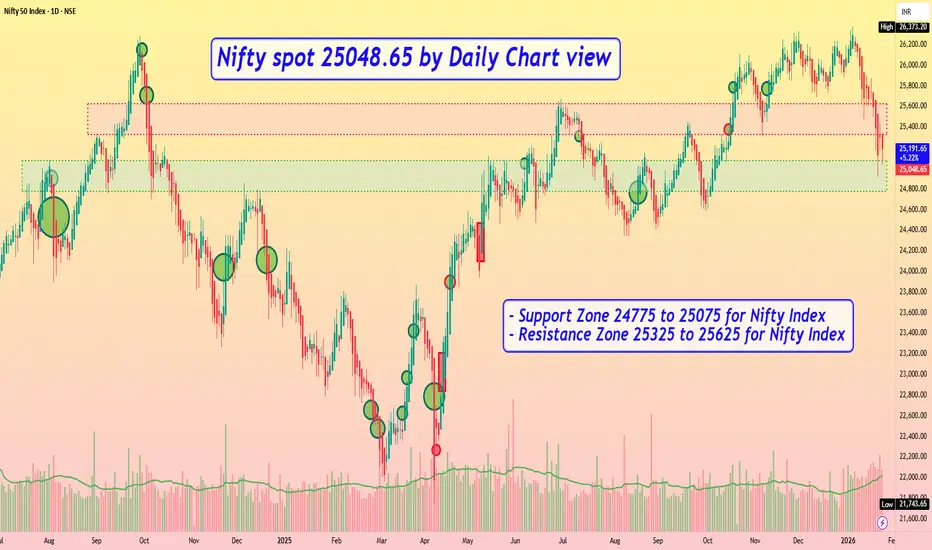
Nifty spot 25048.65 by Daily Chart view - Weekly UpdateNifty spot 25048.65 by Daily Chart view - Weekly Update
- Support Zone 24775 to 25075 for Nifty Index
- Resistance Zone 25325 to 25625 for Nifty Index
- Since a while the indicative Support and Resistance Zone are just an eyewash, as they hardly sustain by the unprecedented Geo-Political happenings
GBPJPY SELLI have full intention to sell GBPJPY, the reason is that it has taken the liquidity of swing high that too daily, I will wait for it in this sell zone, I get some LTF confirmation and then I will enter.

ICICI Bank | Range Compression → Decision ZoneICICI Bank is currently trading inside a tightening range, supported by a rising trendline from below and capped by a declining trendline from above.
This structure suggests volatility compression, often followed by a directional move.
🔍 Technical View:
• Rising trendline acting as immediate support (~₹1,335–1,345)
• Falling trendline acting as overhead resistance (~₹1,420–1,440)
• Price holding above demand zone but lacking momentum
• Breakout or breakdown likely soon
📌 Scenarios to Watch:
✅ Bullish: Sustained close above ₹1,440 → move toward ₹1,500+
❌ Bearish: Breakdown below ₹1,330 → retest of ₹1,280–1,250
📊 Key Levels:
• Resistance: ₹1,420–1,440
• Support: ₹1,345 / ₹1,330 / ₹1,280
📌 Bias: Neutral | Trade only on confirmation
⚠️ Disclaimer: Educational purpose only. Not financial advice.
#ICICIBank #DecisionZone #RangeBound #StockMarketIndia #SwingTrading #TechnicalAnalysis #PriceAction #BankingStocks

Intraday Institutions Trading Option Pricing – How Premium Moves
Factors affecting premium
Underlying price movement.
Volatility levels (IV).
Time remaining for expiry.
Demand–supply and liquidity.
Strike price distance from spot.
How premium reacts
If underlying moves towards strike → premium increases.
If underlying moves away from strike → premium decreases.
Sharp move + low IV = huge premium expansion.
Sideways market = premium decay.
Before major events = IV rise → premium rise.
After events = IV crush → premium collapse.

Part 4 Techical Analysis Vs. Institutional Option TradingBuying Options – Explained in Points
Benefits of Buying Options
Limited risk, unlimited reward.
Small premium, large exposure.
Suitable for trending markets.
Ideal for news-driven moves (budget, RBI meetings, earnings, US data).
Great for breakout trading.
Risks of Buying Options
Time decay eats premium quickly.
Market can trap buyers in fake breakouts.
High volatility inflates premium (overpriced).
Reversal or sideways movement leads to loss.
When to Buy Options
Strong trend confirmed by price action.
Big volume breakout from key levels.
Market structure showing BOS (Break of Structure).
Low IV environment (premiums cheaper).
When a catalyst event can trigger trending movement.
