XAUUSD (H45) – Liam's AnalysisXAUUSD (H45) – Liam View
Geopolitical risk rising | Gold reacting from demand
Gold is stabilizing around the 4745 demand zone, where price is reacting from the rising trendline after a corrective sell-off. The current structure suggests short-term accumulation, with buyers defending value rather than aggressive selling continuation.
From a macro perspective, escalating tensions between the US and Iran—especially risks around the Strait of Hormuz, a key global oil route—are increasing geopolitical uncertainty. Historically, this type of risk environment tends to support safe-haven demand, keeping downside pressure on gold limited while volatility expands.
Technical structure (from the chart)
Key buy zone: 4745 (trendline + demand alignment)
Immediate resistance / liquidity: 5000 – 5100 (buyside liquidity)
Upper imbalance (FVG): 5250 – 5300
Major supply: 5575 (higher-timeframe sell zone)
Price holding above 4745 keeps the bounce scenario active, with potential rotation toward 5000–5100 to rebalance liquidity. Acceptance above this zone would open a path toward the FVG area, where sell-side reactions are expected.
Failure to hold 4745 would invalidate the short-term bullish thesis and reopen downside exploration.
Liam’s takeaway
This is not blind risk-on buying — it’s a measured response to rising geopolitical stress and technical demand.
Trade the zones.
Respect the volatility.
Let price confirm before committing.
— Liam
X-indicator

NIFTY INDEX VIEWINDEX POSSIBLE MOVES
RESISTANCE 25960, 26590
SUPPORT 24500, 24000
24125 BELOW SUSTAIN OR CLOSE FURTHER DOWN MOVE POSSIBLE
23500, 23000
26600 ABOVE SUSTAIN OR CLOSE INVALIDATION
View is for study purpose only , we are not recommend any trade or investment
Always do your own analysis

TMB : VCP Short Base BreakoutTMB has just completed a textbook VCP (Volatility Contraction Pattern) consolidation. We observed three clear rejections accompanied by consistent higher lows, along with a noticeable volume dry-up — all classic signs of tightening supply.
This was followed by a clean breakout backed by strong volume expansion, confirming demand stepping in. Fundamentally, both EPS and sales are improving QoQ, which adds further conviction to the setup. Overall, it checks all the boxes for a high-quality VCP trade.
I initiated the position with a conservative 0.1% risk, as I’m currently collecting more data and validating this setup type. Once I gain more confidence in the price action and consistency, I plan to gradually scale up the risk.
📢📢📢
If my perspective changes or if I gather additional fundamental data that influences my views, I will provide updates accordingly.
Thank you for following along with this journey, and I remain committed to sharing insights and updates as my trading strategy evolves. As always, please feel free to reach out with any questions or comments.
Other posts related to this particular position and scrip, if any, will be attached underneath. Do check those out too.
Disclaimer : The analysis shared here is for informational purposes only and should not be considered as financial advice. Trading in all markets carries inherent risks, and past performance is not indicative of future results. It’s essential to conduct your own research and assess your risk tolerance before making any investment decisions. The views expressed in this analysis are solely mine. It’s important to note that I am not a SEBI registered analyst, so the analysis provided does not constitute formal investment advice under SEBI regulations.

UPDATE ON "XAUUSD" BULLISH IDEA Symbol + Timeframes: XAUUSD— HTF (Daily) & ITF (H4)**
Bias: Bullish (as long as price holds above key DAILY FAIR VALUE GAP)
Structure: – Higher lows intact on HTF and SHORTS LIQUIDATED
– Intermediate pullbacks respecting demand zones
Key Levels: – Support: 4820.360
Context: – Price reacting to confluence (fair value gap + structural support)
Plan: – Look for corrective pullback to support for continuation setups , current buy setup would be inbetween 4820-4815.
– Targets based on structural levels - (I) 5090.890 (ii) 5567 (iii) 5599
This is analysis, not trade advice.

Will Dixon give 100% returns in long run? cmp 11250Stock Update - *Dixon Technologies cmp 11250*
Dixon has corrected nearly 50% from its all time high, reflecting the sector wide pressure and recent proft booking.
Post Q3 results, revenue growth was muted due to softness in consumer electronics but margins remained stable, *management maintained a positive medium term outlook, supported by Outsourcing tailwinds, Capacity expansion, Strong export and OEM pipeline*
Technically, the stock has taken support on long term monthly demand zones and building accumulation phase
*6% to 12% Upside Pote in Short term and 30% to 50% in medium term.*
*Long term investors simply buy and add on dips without considering the lower volatile to get 100%+ returns.*

Alibaba : Ready for another 65% + move Hi friends,
Alibaba is a perfect stock to play AI and China tech boom .
Target & Stoploss are mentioned on the self explanatory chart .
Note : I am not SEBI registered advisor . Please consider my analysis for education purpose only .

Varun Beverages Ltd. VBL daily chart with the drawn annotations can be analysed from both positive (bullish) and negative (bearish) perspectives:
Positive (Bullish) Analysis1. Trend Break: The price has pierced the long‑term descending trendline (white line), indicating a possible reversal from the downtrend.
2. Support & Reversal: The stock has formed a base around 420–429 (horizontal white line) and the upward white arrow suggests a bullish move is underway.
3. Target: If the breakout above 460 holds, the next targets are 500+ and potentially 580 (projected by the white upward arrow).
4. RSI: The RSI (39.20) is climbing out of oversold territory, supporting a momentum shift to the upside.
5. The View : Buy on a confirmed break above 460 with volume; set target at 500–580 and stop‑loss below 420.
Negative (Bearish) Analysis1. Failed Breakout Risk: The breakout above the descending trendline could be a false move; price may revert back into the downtrend.
2. Resistance Block: The zone around 460–480 acts as strong resistance (white box); failure to sustain above could lead to a pullback.
3. Downside Projection: The downward white arrow in the zig‑zag pattern hints at a possible decline toward the support 420 or lower if bearish momentum resumes.
4. RSI Weakness: RSI near 39 indicates the stock is still in weak territory; a dip below 30 could trigger further selling.
5. The Other View: Stay cautious or short on failure to hold 460, with targets near 420–400 and a stop‑loss above 480

Tata Power Date 06.02.2026
Tata Power
Timeframe : Day Chart
Key Negative Points
(1) Net Debt to Equity ratio of 1.56X
(2) Debt to EBITDA ratio of 5.03X
(3) Margin Compression Q3 FY26 declining to 21.24% from 23.86% Y-O-Y
(4) PE Ratio = 30, Premium to industry median of 20X
(5) Profit growth -2.36% (TTM)
Key Positive Points
(1) Green Energy Leadership aiming for 20 GW by FY30
(2) Q3 FY26 highest quarterly addition of 941 MW of renewable projects
(3) EV Infrastructure First-Mover : 5743 public chargers across 677 cities
(4) Strong Parentage: Backed by the Tata Group
(5) Setting-up large scale 10 GW solar ingot & wafer facility with ₹6500 cr investment
Business Segments
(1) Transmission & Distribution 62%
(2) Thermal & Hydro Power Generation 24%
(3) Renewables 13%
(4) Others 1%
Regards,
Ankur Singh

XAUUSD – H4 Technical and Macro AnalysisXAUUSD – H4 Technical & Macro Outlook: Liquidity Compression Ahead of Fed Expectations | Lana ✨
Gold is currently trading in a tight compression structure, while macro conditions are beginning to tilt in favour of precious metals. Weak US labour data and a growing probability of Fed rate cuts are putting pressure on the US Dollar, creating an important backdrop for the next move in gold.
At the same time, price action on XAUUSD suggests the market is approaching a key liquidity-driven decision point.
📈 Technical Structure & Price Behaviour
After failing to sustain above the upper supply zone near 5,200–5,300, gold entered a corrective decline and is now trading inside a descending wedge, bounded by falling resistance and rising support.
Price is currently holding around 4,800–4,830, a short-term balance area.
Repeated rejections from descending resistance indicate supply remains active.
At the same time, sell-side liquidity is clearly resting below the structure, near 4,570–4,550.
This behaviour suggests the market is not trending yet, but preparing for a liquidity expansion.
🔍 Key Levels to Monitor
Near-Term Resistance: ~5,070 – 5,130
A key reaction zone aligned with Fibonacci retracement and prior structure.
Compression Pivot: ~4,800 – 4,830
Holding above this area keeps price in consolidation mode.
Sell-Side Liquidity: ~4,570 – 4,550
A likely downside target if the structure breaks lower.
Major Supply (Higher TF): ~5,500
Still the upper boundary for any medium-term bullish continuation.
🎯 Likely Scenarios
Scenario 1 – Liquidity Sweep Lower (Base Case):
If price fails to hold the rising support, gold may dip toward 4,570–4,550 to clear sell-side liquidity. Such a move would likely be corrective, not a trend reversal, especially given the macro backdrop.
Scenario 2 – Bullish Break from Compression:
If price accepts above 5,070–5,130, the descending structure would be invalidated, opening the door for a recovery toward higher resistance zones.
🌍 Macro Context: USD Weakness & Fed Expectations
Recent US labour data has reinforced concerns about economic momentum:
JOLTS job openings fell sharply below expectations.
ADP employment growth slowed significantly.
CME FedWatch now shows a rising probability of a March rate cut, up from earlier in the week.
As a result, the US Dollar Index (DXY) has struggled to extend its weekly gains, trading slightly lower while remaining near recent highs. This environment is typically supportive for gold, especially during corrective phases.
Upcoming NFP data will be a key catalyst and may act as the trigger for the next liquidity expansion.
🧠 Lana’s View
Gold is currently in a waiting phase, balancing between technical compression and shifting macro expectations. The focus should remain on how price reacts at the edges of the structure, rather than predicting direction too early.
Patience is essential here. The next move is likely to be fast and liquidity-driven once the market commits.
✨ Respect the structure, follow the levels, and let the market reveal the next expansion.

Johnson & Johnson extends the uptrend,1 Price has been trending higher for months with repeated, orderly pauses
2 Each consolidation formed at a higher level and resolved to the upside
3 The latest push was steeper, increasing the chance of another pause
4 So far, pauses have looked constructive rather than distributive
5 Silent Flow is active and confirms the broader state, not the timing of the next leg
6 Scenario A is consolidation at higher levels before continuation
7 Scenario B is a clean drop back below the last breakout zone, forcing the market to re prove strength

NIFTY KEY LEVELS FOR 06.02.2026NIFTY KEY LEVELS FOR 06.02.2026
Timeframe: 3 Minutes
Sorry for the delayed post..
If the candle stays above the pivot point, it is considered a bullish bias; if it remains below, it indicates a bearish bias. Price may reverse near Resistance 1 or Support 1. If it moves further, the next potential reversal zone is near Resistance 2 or Support 2. If these levels are also broken, we can expect the trend.
When a support or resistance level is broken, it often reverses its role; a broken resistance becomes the new support, and a broken support becomes the new resistance.
If the range(R2-S2) is narrow, the market may become volatile or trend strongly. If the range is wide, the market is more likely to remain sideways
please like and share my idea if you find it helpful
📢 Disclaimer
I am not a SEBI-registered financial adviser.
The information, views, and ideas shared here are purely for educational and informational purposes only. They are not intended as investment advice or a recommendation to buy, sell, or hold any financial instruments.
Please consult with your SEBI-registered financial advisor before making any trading or investment decisions.
Trading and investing in the stock market involves risk, and you should do your own research and analysis. You are solely responsible for any decisions made based on this research.

Elliott Wave Analysis XAUUSD – February 6, 2026
Momentum
– Daily (D1) momentum is currently rising, indicating that the upward move may still continue for another 1–2 days, until D1 momentum reaches the overbought zone.
– H4 momentum has started to reverse to the upside, therefore we expect a bullish move over the next few H4 candles.
– H1 momentum is currently in the overbought zone and is showing early signs of a potential reversal. As a result, within the next few hours, a short-term pullback or momentum reversal on H1 is expected.
Wave Structure
Daily (D1) Wave Structure
On the D1 timeframe, momentum continues to rise while price has not yet expanded strongly. This suggests that the corrective rebound of wave B is still in progress.
We expect wave B to complete once D1 momentum reaches the overbought zone, preparing the market for the next phase.
H4 Wave Structure
On the H4 chart, momentum is reversing to the upside, which supports a short-term bullish move of approximately 4–5 H4 candles.
This advance is still considered part of wave B. Once wave B is completed, price is expected to continue into wave C (black) as previously outlined.
H1 Wave Structure
Within black wave B, we are observing a red ABC corrective structure, with price currently trading inside red wave B.
Unfortunately, price did not trigger our intended entry from yesterday’s setup.
For now, we wait for H1 momentum to reverse lower and move into the oversold zone. At that point, if both H4 and H1 momentum align and reverse upward, we will have a strong momentum confluence to consider new entries.
– If price holds above 4658: this will confirm that an H4 bottom has formed at 4658, and price is likely to continue higher in line with H4 momentum.
– If price breaks below 4658: this would indicate that wave B may still be unfolding, and we will then focus on the 4640 – 4597 zone. This area represents high liquidity, combined with the Fibonacci zone identified in yesterday’s analysis, making it a key region to look for buy opportunities.
Risk Management Notes
At this stage, price volatility remains very wide. The potential trading range spans more than 500 pips, which makes placing limit orders extremely difficult.
Therefore, the preferred approach is direct execution, based on:
– Momentum behavior
– Key price target zones
– Clear reversal candlestick patterns
Strict risk management is critical in the current market environment:
– Small accounts: risk no more than 5% per trade
– Large accounts: risk no more than 3% per trade
Proper position sizing at this time is essential to protect trading capital during periods of elevated volatility.

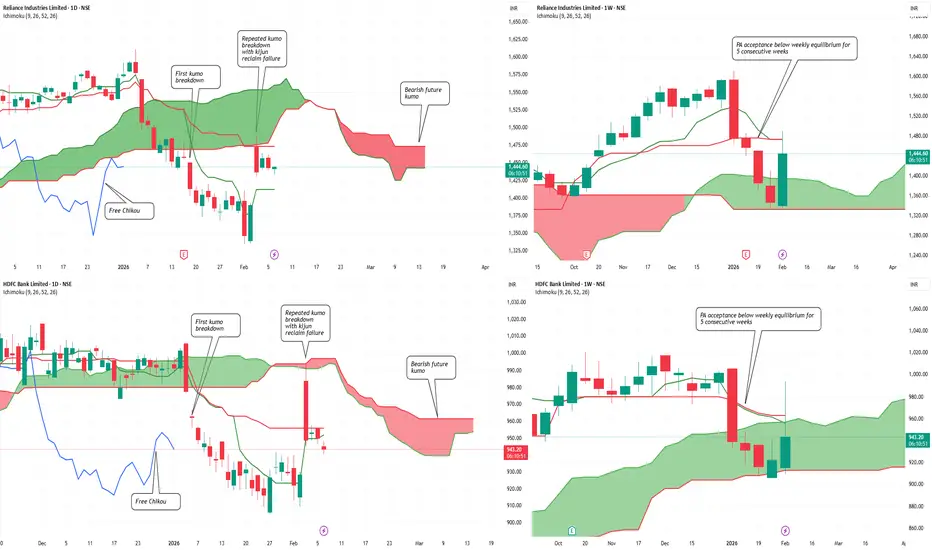
Dead Cat Bounce in Nifty? Heavyweights to Deliver The VerdictDead Cat Bounce in Nifty? Index Heavyweights to Deliver the Verdict Soon…
Both index heavyweights remain structurally weak despite the recent bounce.
On the daily timeframe, Reliance Industries and HDFC Bank have transitioned out of bullish Ichimoku regimes. Crucially, the second daily Kumo breakdown in both stocks overlaps with a failed Kijun-sen reclaim , reinforcing bearish continuation rather than base formation.
The weekly picture strengthens this caution. Price has shown multi-week acceptance below weekly equilibrium across both names, signaling institutional comfort at lower levels . Until price can reclaim and sustain above the weekly mean, the ongoing bounce risks remaining a dead cat rather than evolving into a sustainable trend reversal.
Verdict pending — and it rests squarely with these heavyweights
Vinati Organics at strong supportVinati Organis is at its support. Also, gapup because of traiif relief has been filled. One can enter with the SL as support line.

Nifty50 analysis(6/2/2026).CPR: narrow + decending cpr: trending
FII: 2,150.51 sold.
DII: 1,129.82 bought.
Highest OI:
CALL OI: 25700 to 26000
PUT OI: 25500
Resistance: - 26000
Support : - 25500
conclusion:.
My pov:
1.market gap down and continue with trend because of narrow cpr.
2.still support at 25400 and above first resistance is 25650.
3. Price must find a clear support until then bearish
What IF:
resistance 25650 on the upside
And support 25400 on the down side .
psychology:
Confidence. Discipline . Proper focus gives consistence result
note:
8moving average ling is blue colour.
20moving average line is green colour
50moving average line is red colour.
200moving average line is black colour.
cpr is for trend analysis.
MA line is for support and resistance.
Disclaimer:
Iam not Sebi registered so i started this as a hobby, please do your own analysis, any profit/loss you gained is not my concern. I can be wrong please do not take it seriously thank you

OCTOBER 18: I CALLED $107K CRASH. TODAY: BITCOIN -44% AT $60K.OCTOBER 18: I CALLED $107K CRASH. TODAY: BITCOIN -44% AT $60K. RECEIPTS INSIDE.
They Called Me "FUD Spreader" When I Warned You On October 18, 2025.
Bitcoin Was At $107K.
Everyone Screamed "BUY THE DIP"
I Showed You The Bearish Divergence And Said: "Protect Your Capital."
THE NUMBERS DON'T LIE:
Bitcoin: $107,000 → $60,000
Total Drop: -44%
Short Profit: $47,000 Per BTC
IF YOU FOLLOWED THIS ANALYSIS:
✅ You Saved Your Portfolio From -44% Destruction
✅ You Made Massive Profits On The Short
✅ You're Now Positioned To Buy At 44% Discount
✅ You Ignored The Noise And Followed The Chart
WHAT HAPPENED:
Weekly Bearish Divergence ✓ CONFIRMED
$104K Support Breakdown ✓ BROKE
$73K Support Level ✓ SMASHED
$66K Zone ✓ CRUSHED
Now At $60K Testing Critical Support
WHAT'S NEXT:
$48K-$49K Zone Still In Play If $60K Breaks.
This Is NOT About Being Bearish.
This Is About PROTECTING CAPITAL And Buying Smart.
Bull Market Will Continue.
But Corrections Are PART Of The Journey.
Now You Can Start Accumulation Bitcoin From $60K Level Slowly
THE DIFFERENCE:
❌ Moonboys: "Buy At $107K, HODL Forever"
✅ Real Analysis: Save 44%, Re-Enter Lower
This Is Why Technical Analysis Matters.
This Is Why You Don't Follow Blind Hopium.
Drop Comment If You Followed This Call.
More Updates Coming. The Opportunity Isn't Over.

NIFTY 50 INTRADAY 🧭 Key Levels (Golden Part)
🟢 Supports
S1: 25,620 ⚠️ (abhi yahin fight chal rahi)
S2: 25,465 (strong)
S3: 25,365 (last defence)
👉 25,620 ke neeche sustain = aur weakness
🔴 Resistances
Pivot: 25,719
R1: 25,875
R2: 25,974
👉 25,720 ke upar hold = relief rally

Market Outlook & Trade Setup – Friday, 6th Feb 2026
Today is RBI'S policy announcement wherein we are expecting no change in the repo rate.
🔹 NIFTY: Gift Nifty (25,626: -22)
* Previous Close: 25,642
* Expected Range: 25,500 - 25,700
🔹 SENSEX
* Previous Close: 83,313
* Expected Range: 83,300 - 83,400
🌍 Global & Market Sentiment
* DJIA: -592| S&P: -84
💰 Institutional Activity (Cash Market)
* FII: Net Buyers: - ₹ 2151 Cr
* DII: Net Buyers: + ₹ 1130 Cr
🔥 Events this Week:
India - RBI Interest Rate Decision
📌 Sectoral Focus (Positive)
Bank, NBFC, Auto, Realty
👉 Commodities in Focus: Copper, Gold, Silver, Crude
✌️Important Quarterly Results: Bosch, CESC, Crompton, SUNTV, Whirlpool
📈 Trade smart. Manage risk. Stay disciplined.

#BANKNIFTY PE & CE Levels(06/02/2026)Bank Nifty is expected to open flat, indicating a continuation of the ongoing consolidation phase. Price action over the last few sessions shows that the index is trading within a tight range, reflecting indecision among participants. There is no strong gap or momentum bias visible at the open, so the first half of the session may remain range-bound with false breakouts possible around key levels.
On the upside, the 60050–60100 zone is the immediate resistance and trigger area. A sustained move above this zone with acceptance can open the door for upside targets at 60250, 60350, and 60450+. This level has acted as a supply zone earlier, so only a clean breakout with volume should be considered for fresh long positions. Until that happens, upside moves may face selling pressure near resistance.
On the downside, 59950 is the key support to watch. If Bank Nifty breaks and sustains below 59950, selling pressure can increase, leading to downside targets at 59750, 59650, and 59550, where the next demand zone is placed. This lower zone is expected to attract buyers, so aggressive shorts should be cautious near those levels and consider booking profits.
Overall, the structure clearly favors a range-trading approach for the day. Traders should avoid positional bias and focus on trading confirmation at levels rather than predicting direction. Scalping or short-term trades near support and resistance with strict stop-losses will be more effective until Bank Nifty gives a decisive breakout or breakdown from this consolidation range.

Force Motor - fundamental + Momentum stockFundamental is good.
PRICE above - 20, 50 and 200 SMA.
MACD - Positive in weekly and daily.
RSI > 60 IN WEEKLY AND DAILY.
Performance > Nifty50
Along with P shape volume profile.
Long consolidation.

XAUUSDGreetings!
Welcome traders.
By choosing to "Follow", you can stay updated with the latest information promptly. Kindly consider clicking "Boost" as well.
Wishing you a pleasant day.

XAUUSD Short Idea XAUUSD short idea, sell below harmonic level (below B) with a confirmation. target till the FVG or Ride it with a trailing SL.

MOMENTUM STOCK- HIGH VOLUME ACTION AT TOP OF CONSOLIDATIONPrice above 20, 50 & 200 SMA.
RSI > 60 in Weekly and daily.
MACD - positive crossover
ADX (5) > 20
