It seems silver is going to loose its shine soonSilver (XAGUSD) prices are near all time high, hovering near the VAH logarithmically on monthly chart. Highly cautious period next one or two months. Keep watching !!
XAG USD (Silver / US Dollar)

Silve is going to moon higher speed than GOLD #xauusdSilve is going to moon higher speed than GOLD #xauusd and this is my next move i analysis from 50 to 100 then 91 to 114 and form next level to next tp of silver as i analysis as of now it takes time and in between a small correction will be possible and then ne xt tp hits of #xagusd
Silve is going to moon higher speed than GOLD #xauusd and this is my next move i analysis from 50 to 100 then 91 to 114 and form next level to next tp of silver as i analysis as of now it takes time and in between a small correction will be possible and then ne xt tp hits of #xagusd
Silve is going to moon higher speed than GOLD #xauusd and this is my next move i analysis from 50 to 100 then 91 to 114 and form next level to next tp of silver as i analysis as of now it takes time and in between a small correction will be possible and then ne xt tp hits of #xagusd

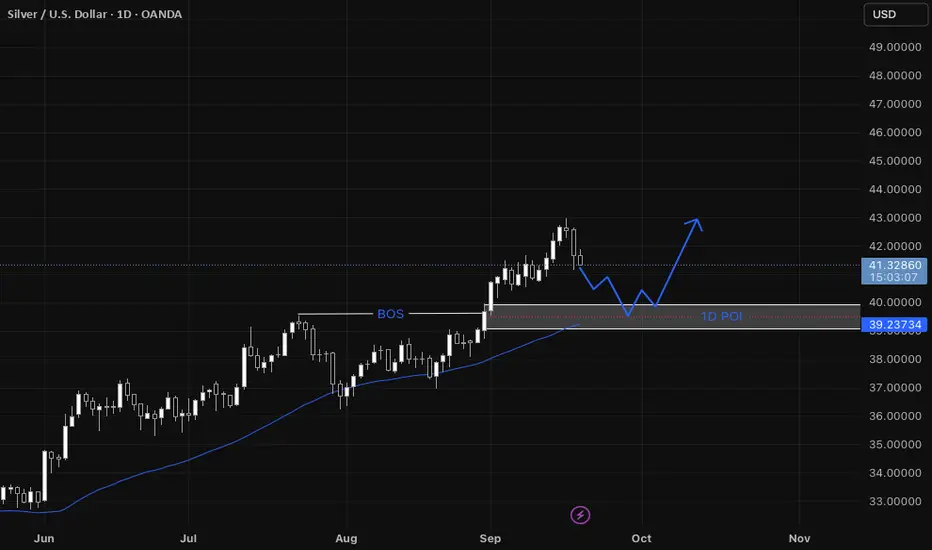
SILVER (XAGUSD) – Weekly Projection Analysis (24-01-26)
Overall Bias: 🔥 Strong Bullish
🔹 Market Structure
Price is clearly inside a bullish channel
Previous trendline break → clean retest
Retest aligns perfectly with 50% Fibonacci level
👉 This is a high-probability continuation zone
🔹 Key Levels
Support S2: ~96
Support S1: ~99–100
Entry Zone: Broken trendline + 50% Fibo (around 100)
Stop Loss: Below ~96 (structure protection)
Resistance R1: ~112–114
Target Zone: 115 – 120+ (New ATH zone) 🚀
🔹 Candle Strength
Strong bullish impulse candle confirms buyers’ dominance
No major rejection wick → momentum intact
🔹 Projection Logic
Trend continuation inside channel
Higher highs & higher lows
Retest confirmation + momentum breakout = buy-on-dips strategy
🧠 Trading Plan Summary
✅ Buy on retracement
✅ SL below structure
✅ Partial booking near R1
✅ Hold runner for ATH expansion

SILVER | XAGUSD 1H Chart - Make or Break LevelsFX:XAGUSD MCX:SILVER1!
Silver is trading at a make-or-break support zone — this level will decide whether the broader uptrend survives or cracks.
🔹 Price is sitting near the 200 EMA, a level that historically acted as a launchpad
🔹 Last time Silver tested the 200 EMA (around $50), it marked the base before a multi-year breakout
🔹 Now, price has again pulled back to the same EMA near $70
📌 Key Observation:
As long as Silver holds above the 200 EMA, this move looks like a healthy retracement, not trend failure.
To Reduce the Noise switch to 4h Chart and see its forming 2 range candle just above 50EMA a break ot that will trigger the trade.
Need Confirmation from 4h chart then only go long
Keep Learning, Happy Trading.

XAGUSD ANALYSISAs per my analysis we can see correction in both silver and gold and we can see a new last high in upcoming months as per this market can form now abc pattern as a corrective pattern it will takes time. as per my view high is formed of 3rd wave and now silver is in correction.
you can post your comment for more analysis
Thanks
Ishu Prajapati

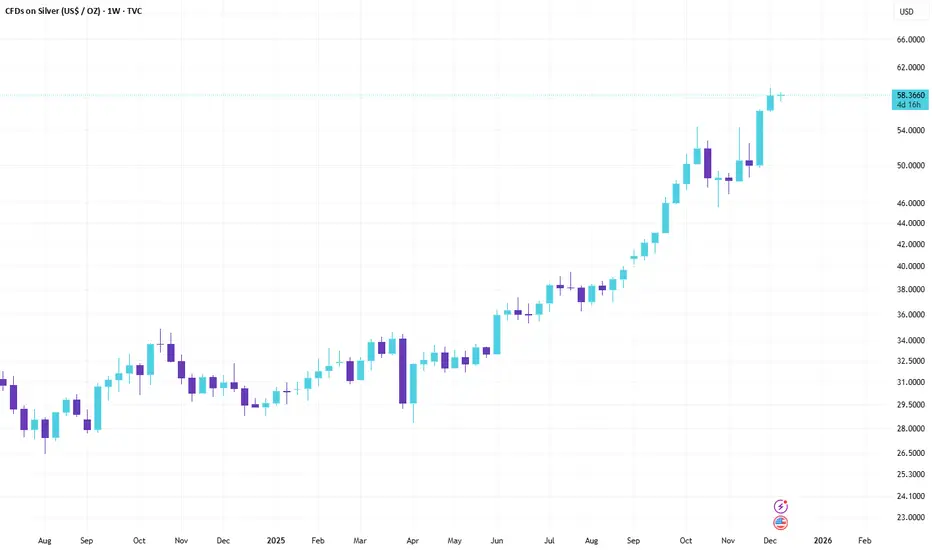
Real-Time XAG/USD Chart Analysis: Bullish Momentum Builds TowardFOREXCOM:XAGUSD
Real-Time XAG/USD Chart Analysis: Bullish Momentum Builds Toward $60
As of December 8, 2025 (Intraday: Early Trading)
Current Price: 58.31 USD (Down ~0.08% from previous close of 58.36; trading range: 57.59–58.74)
Asset: XAG/USD (Silver Spot vs. US Dollar)
Key Context: Silver's consolidating just shy of its all-time high of 59.42 hit earlier this week, with fresh ETF inflows and tightening physical inventories underscoring the uptrend. Amid Fed rate-cut bets and robust industrial demand (solar, AI), the technical setup leans Strong Buy—a pullback could be a gift for longs eyeing new records.
Quick Macro Snapshot
Tailwinds: Weaker USD from softer PCE inflation and labor data, plus record SLV ETF inflows (highest in 10 years). Supply crunch on Shanghai exchanges at multi-year lows, with green tech demand projected to drive deficits. Silver's 2025 YTD gains now at ~83%, outpacing gold's rally.
Headwinds: Overstretched speculative positioning could spark profit-taking; hawkish Fed signals next week might cap upside if yields rebound.
Technical Breakdown
Pulling from daily and 4H charts, the bias is firmly bullish despite minor intraday dips:
Trend & Moving Averages (Strong Buy):
Daily: Price well above rising 200-day EMA (~55.00) and 50-day EMA (~50.00), with all major MAs aligned bullish. 200-hour EMA at 56.30 provides dynamic support.
4H: Golden cross intact on EMAs; buyers defending the ascending channel.
Implication: Uptrend channel from October lows holding; retest of $59+ imminent on volume pickup.
Momentum Indicators (Neutral with Bullish Tilt):
RSI (14): 50.82 (Neutral)—cooled from overbought but no divergence yet, leaving room for extension.
MACD (12,26): Recently slipped negative below zero line (bearish histogram), signaling short-term downside momentum, but line still above signal overall.
Stochastics (9,6): ~65 (Buy territory); not overbought.
CCI (14): Neutral (~0); Williams %R: -45 (Mild buy).
ADX (14): 28 (Moderate trend strength, bullish direction).
Implication: Momentum pausing after the ATH push, but neutral RSI avoids sell signals—watch for bullish crossover.
Volume & Volatility:
ATR (14): ~0.85 (Elevated vs. recent avg., indicating volatility spike post-breakout).
Bull/Bear Power: Bulls dominant (+0.45), with options flow heavy on calls.
Pivot Points & Key Levels (Classic):LevelPriceTypeR359.50ResistanceR259.20ResistanceR159.00ResistancePivot58.15NeutralS157.50SupportS256.50SupportS356.20Support
Support Cluster: 56.20–56.50 (200h EMA + key zone; break below eyes 55.25 weekly support).
Resistance: 59.00–59.35 (recent ATH; clear for $60+ push).
Fibonacci: 61.8% extension from Oct lows targets 60.50.
Weekly Outlook
Broader uptrend: Strong Buy on MAs; Triangle pattern resolving higher, with potential test of 55.25 support before rally to 60.65–68.05. YTD doubling makes $65 realistic if Fed cuts materialize.
Risk: Drop below 56.20 could accelerate to 54–55 (prior resistance-turned-support), but low probability amid deficit forecasts.
Bias: Buy the dip—industrial tailwinds and ETF momentum point to $60 by quarter-end.
Trade Takeaway: Long above 58.15 pivot (stop below 56.50). Target R1 at 59.00 for 1:2 risk/reward. Squad, silver's stealing gold's thunder—$60 next, or Fed-induced pause? What's your play? #XAG #SilverAnalysis #SignalSquad
#Silver Alert: Double Top Breakdown Incoming?🚨 Double Top on XAGUSD daily chart:
1️⃣ First Top: Bearish Engulfing
2️⃣ Second Top: Dark Cloud Cover
Pattern confirms DCB 🔻 below $45.55 , 🎯 targeting $36.71 .
🚧 Resistance: $52.32 - $54.49
🛡 Support: $50.62, $49.38 - $48.91, $47.17 - $46.90
⚠️ Major sell-off potential. Longs only above Double Top high after 2 consecutive closes.
#Silver #XAGUSD #DoubleTop #TechnicalAnalysis #BearishReversal #ChartPatterns #CandlestickPatterns #PriceAction
📌 #Disclaimer: This analysis is shared for educational purposes only. It is not a buy/sell recommendation. Please do your own research before making any trading decisions.

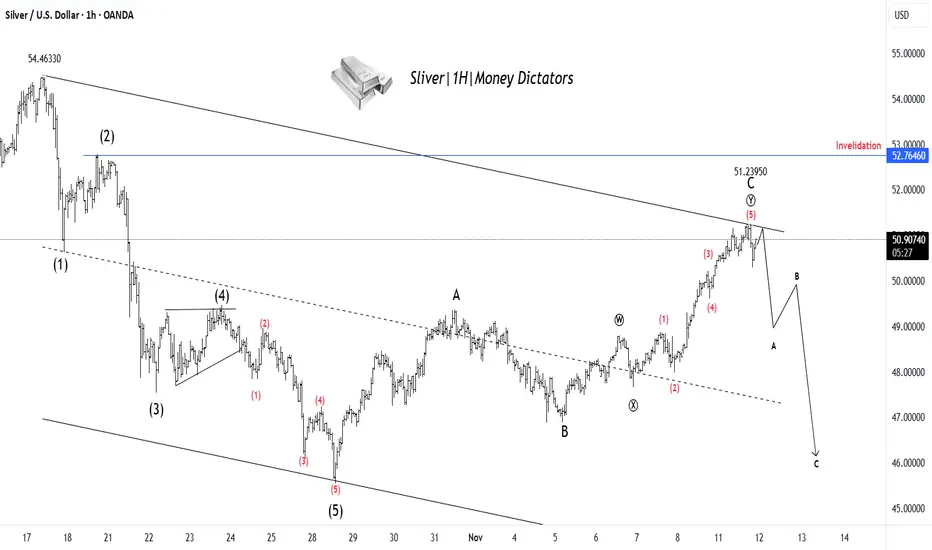
XAG/USD Set for Decline After Finishing Wave YSilver has completed a clear 5-wave upward move, ending near the 51.23 zone, which likely marks the completion of Wave C of the corrective structure. Price action shows rejection from the upper trendline, signaling that buying momentum is fading. This suggests the start of a new A–B–C corrective decline, where Silver could first drop toward 48–47 levels before any temporary bounce. The overall structure remains bearish in the short term unless the price breaks above the 52.76 invalidation zone. In simple terms: rally looks complete → downside correction likely ahead.
Stay tuned!
@Money_Dictators
Thank you :)
#Silver | #XAGUSD 4H UpdateCMP: $50.44
🔴 Price testing key resistance zones
🚧 $50.47 - $50.94
⚠️ Strong supply area — consider booking profits or tightening stops on longs.
👀 Only a clean 4H close above $50.94 can open the way for further upside.
#Silver TVC:SILVER #XAUUSD #PriceAction #Commodities #Trading #Forex #ChartPattern
📌 #Disclaimer: This analysis is shared for educational purposes only. It is not a buy/sell recommendation. Please do your own research before making any trading decisions.

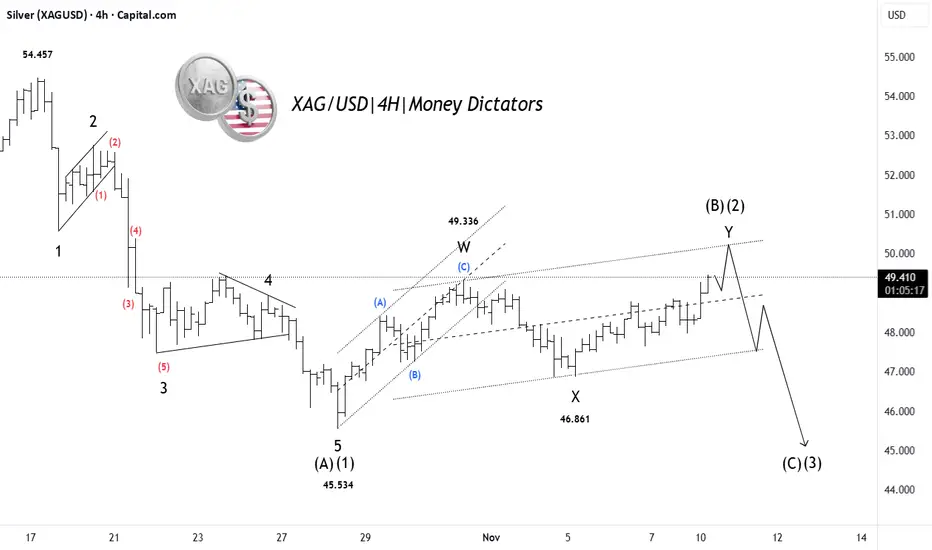
Silver Correction Ending: Major Drop AheadSilver (XAG/USD) has completed a 5-wave decline, marking the end of Wave (A)/(1) near the 45.53 level. Since then, price has been retracing upward in a complex W–X–Y corrective structure, which appears to be forming the final leg of Wave (B)/(2). The rise is losing strength near the upper channel, hinting that bulls may soon exhaust. Once Wave (B)/(2) finishes, the next big move is expected to be a strong bearish Wave (C)/(3) decline targeting lower zones near or below 45. In simple terms: last leg of correction nearly done → next big drop ahead.
Stay tuned!
@Money_Dictators
Thank you :)
XAG/USD (Silver vs USD) chart on the 2-hour timeframe...XAG/USD (Silver vs USD) chart on the 2-hour timeframe:
Price is moving within a descending channel, still below the Ichimoku cloud, indicating continued bearish pressure.
The recent candle is showing a rejection from the upper band of the channel / cloud resistance area (around 47.9–48.1).
My marked two target points on the chart — both aligning with the lower parts of the descending channel.
🎯 Target Zones (Bearish Outlook)
1. First target: around 46.00 – 46.20
→ This aligns with the mid-channel support and my first “target point” marking.
2. Final target: around 42.00 – 42.30
→ This corresponds to the lower channel boundary and my second, deeper target point on the chart.
🔹 Summary
Bias: Bearish below 48.10
Entry area: 47.8 – 48.0 rejection zone
Targets:
🎯 TP1 = 46.10
🎯 TP2 = 42.20
Invalidation: A sustained close above 48.20 would weaken this bearish structure and could trigger a cloud breakout.

XAU/USD – 15-Minute Timeframe Analysis (Short Bias)Market Overview
Following the latest round of China–U.S. trade negotiations, market sentiment has shifted toward a more risk-on environment, reducing demand for safe-haven assets such as gold. As optimism surrounding the talks strengthens the U.S. dollar, gold prices have continued to decline during the Asian and early European sessions.
Technical Outlook
On the 15-minute timeframe, XAU/USD maintains a clear short-term bearish structure, characterized by consecutive lower highs and lower lows. The pair is currently trading below key moving averages, reinforcing the prevailing downward momentum.
A potential retracement toward intraday resistance could present a favorable opportunity for short positions, provided that bearish price action confirms rejection at that level.
Key Resistance: 2360 – 2365 zone (previous support turned resistance)
Immediate Support: 2348 – 2350 zone
Extended Support Target: 2338 – 2340
XAGUSD (Silver/USD) 1-hour chart...XAGUSD (Silver/USD) 1-hour chart, here’s what I can observe and infer about potential target levels:
---
🔍 Chart Summary:
My using Ichimoku Cloud and trendlines.
Price is currently around $49.10.
The chart shows two target points drawn:
1. First Target Point: Around $51.90 – $52.00
2. Second Target Point: Around $54.30 – $54.50
---
🎯 Target Levels Based on the Chart:
1. First Target (Short-Term):
Around $51.9 – $52.0
This coincides with resistance from the previous range and Ichimoku cloud top.
Represents a possible initial take-profit zone if price breaks above current consolidation.
2. Second Target (Extended):
Around $54.3 – $54.5
Aligns with the projected measured move from my trendline channel.
This would be the larger bullish target if price sustains above the $52 breakout zone.
---
📈 Trading Idea (Hypothetical Example):
Buy Zone: Above $49.5 – $49.8 (confirmation breakout)
Target 1: $51.9 – $52.0
Target 2: $54.3 – $54.5
Stop Loss: Below $48.5 support (near Ichimoku base)

XAGUSD (Silver vs USD) on the 1-hour timeframeXAGUSD (Silver vs USD) on the 1-hour timeframe, here’s what can be inferred:
The price has clearly broken below the ascending trendline.
It also broke down through the Ichimoku cloud, confirming a bearish signal.
There’s a sharp rejection candle followed by continuation below previous structure support (around $52.00–$51.80).
My marked a “target point” on your chart — roughly near $47.50, which seems to be aligned with the next major support zone from earlier price action (likely a demand area or Fibonacci retracement level).
🧭 Technical Breakdown:
Current Price: ~$51.81
Immediate Resistance: $52.30–$52.45 (bottom of the cloud)
Support/Target:
Short-term: $50.80
Medium-term: $49.50
Major target (as on your chart): $47.50
🎯 Expected Target:
If bearish momentum continues and the price stays below the $52.00 resistance, your target of $47.50 looks reasonable as a swing target.

XAG/USD Technical Analysis (as of October 19, 2025)Current Market Snapshot
The spot price of silver (XAG/USD) stands at 51.91430 USD per ounce, reflecting a sharp decline of -2.3663 (-4.36%) from the previous close of 54.24 in daily time frame. This pullback follows recent record highs near 54.48, driven by safe-haven demand amid geopolitical tensions and inflation concerns, but now facing profit-taking and a stronger USD.
Support and Resistance Levels
Immediate support is at 51.44, with a critical level at 50.00 if breached.
Resistance looms at 54 to 57.02.
Chart for your reference
~~ Disclaimer ~~
Trading or investing in assets like crypto, equity, or commodities carries high risk and may not suit all investors.
Analysis on this channel uses recent technical data and market sentiment from web sources for informational and educational purposes only, not financial advice. Trading involves high risks, and past performance does not guarantee future results. Always conduct your own research or consult a SEBI-registered advisor before investing or trading.
This channel, Render With Me, is not responsible for any financial loss arising directly or indirectly from using or relying on this information.

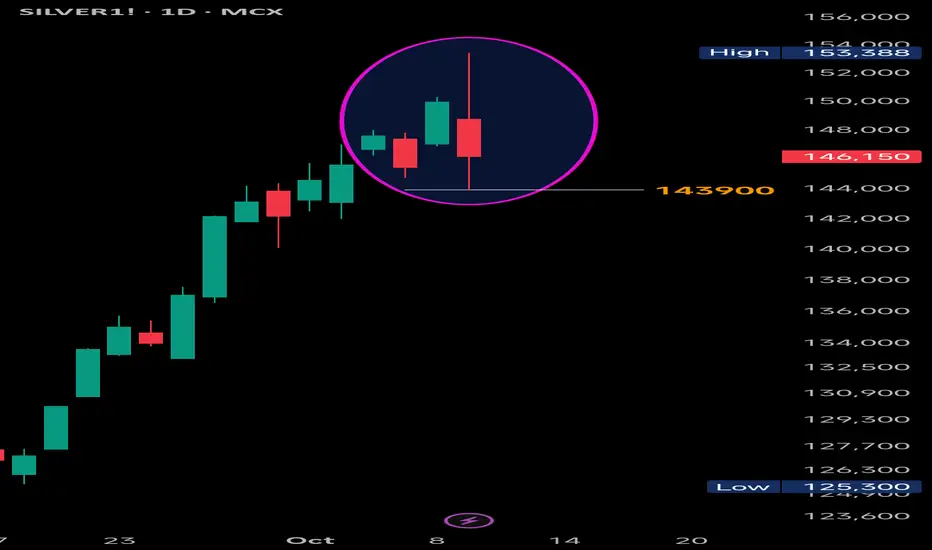
Silver: Bearish Engulfing – Is the Top In?#Silver View:
Just like Gold, Silver has formed a strong Bearish Engulfing pattern on the daily chart, potentially signaling a temporary top in the current trend. While it’s still early to confirm a full reversal, the price action suggests caution for bulls.
✅ Confirmation:
A daily close below 143,900
(today's low), especially with increased volume, would confirm the pattern and likely trigger further downside momentum.
❌ Negation:
If Silver manages to close above 153,388 (today’s high), the bearish structure will be invalidated.
🎯 Key Levels to Watch:
Resistance: 153,388 (pattern high)
Support: 143,900 (pattern low)
Stay alert for follow-through candles and volume spikes in coming sessions.
#Silver | #XAGUSD | #BearishEngulfing | #CandlestickPatterns | #TechnicalAnalysis | #PriceAction | #SilverAnalysis
📌 Disclaimer: This analysis is shared for educational purposes only. It is not a buy/sell recommendation. Please do your own research before making any trading decisions.
Red Alert for Buyers as XAGUSD Nears $49 – Correction AheadSilver price (XAGUSD) faces strong resistance near $49. Neal Bhai Reports warns a “Red Alert for Buyers.” Check latest silver analysis with buy/sell targets, stop loss, and key support levels for traders.
Silver prices have shown a sharp rally, reaching near the $49–$50 zone — a strong resistance area. According to the chart, buyers should stay cautious now as the metal looks overextended. A short-term correction may hit the market soon.
The technical setup suggests that profit booking could start around current levels, pushing silver towards $44 or even $42 in the coming sessions.

Silver Spot Price Technical Analysis [28-09-2025] Buy on DipsAny Correction Buy on Dips - Silver Spot (XAG/USD) daily chart from (dated 2025.09.27), here’s a technical analysis: The chart indicates a continuation of an uptrend, with the price recently breaking out above a key resistance level around 45.013. This breakout is supported by a strong upward move, suggesting bullish momentum.

Silver Bullish Breakout on Monthly & Weekly CharPattern Formed: Symmetrical Triangle (Long-Term Consolidation)
Breakout Type: Bullish Breakout on Monthly & Weekly Chart
Volume Confirmation: Strength in breakout with price expansion
Measured Move Target: ~$44 (based on triangle height projection)
Immediate Resistance Zone: $44.11 (Historical supply zone)
Support Levels Post-Breakout:
Immediate Support: $34.78
Strong Support: $33.28

Silver’s Bullish Cycle: Zones to Buy, Levels to Aim ! Silver is running one of its strongest bullish phases in recent years, having broken through key ranges and now holding around the mid-43s with momentum still intact. The structure shows that 42.7 is the immediate support staying above this level keeps short-term bulls in control. Once pressure mounts, the wider zone between 40 and 41 is where the market is Trend to react with macro catalysts, whether it’s Fed commentary, shifts in the dollar, or changes in yields. This zone is less about weakness and more about price discovery, often a place where institutional demand re-enters. A deeper correction cannot be ruled out, and the 37 region stands out as the medium-term load-up zone, where longer-term players will rebuild exposure. On the upside, silver has scope to stretch toward 44.9, and once momentum extends further, the 47.8 handle comes into play. From a macro perspective, the trend is supported by a weakening dollar, softer yields, and the Fed’s slow shift toward deeper rate cuts, while silver’s dual role both as a safe-haven and an industrial metal tied to the energy transition gives the rally added structural strength. Taken together, the bias remains firmly higher, with dips into support zones offering opportunities rather than threats. Trade safe!
Key Levels to Watch:
Immediate support: 42.7
Reaction zone: 40.0 – 41.0
Medium-term load up zone: 37.0
Upside targets: 44.9 and 47.8

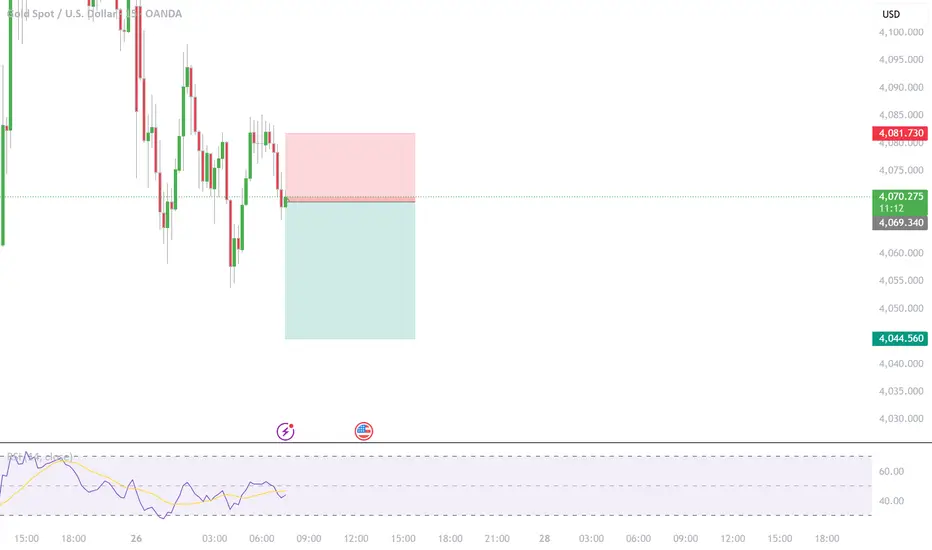
XAGUSD Step-by-step entry plan for XAGUSD
1. We have our Daily Point of Interest (POI)
- On the daily a zone that contains:
* a fair value gap (FVG),
* a break of structure (BOS) that previously acted as resistance and is now expected to act as support, and
* support from the 44 SMA.
2. Wait for price to return to the Daily POI
- Only consider the setup if price actually comes back into that daily POI zone.
3. Switch to the 1-hour timeframe to refine the entry
- Look for a shift in structure on the 1-hour (i.e., evidence that momentum is shifting bullish: BOS to the upside, higher highs/higher lows).
4. Confirm a 1-hour fair value gap forms
- The structure shift on 1-hour should create a 1-hour FVG (a short intraday imbalance).
5. Wait for the 1-hour FVG to be filled
- Let price fill that 1-hour FVG (price moves into/through the gap).
6. Look for a bullish confirmation on the filled 1-hour FVG
- After the fill, require a clear bullish formation on 1-hour (examples: bullish engulfing candle, strong demand candle, a higher-low + rejection wick).
7. Enter on the 1-hour bullish confirmation
- Enter when price breaks the confirmation level (e.g., breaks above the local 1-hour high formed by the bullish setup) or on a confirmed bullish candle close per your entry rules.
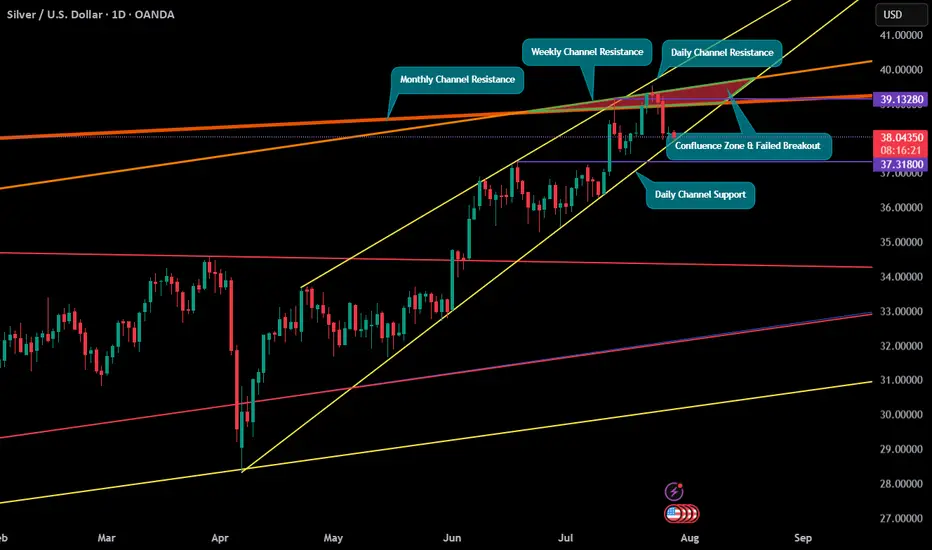
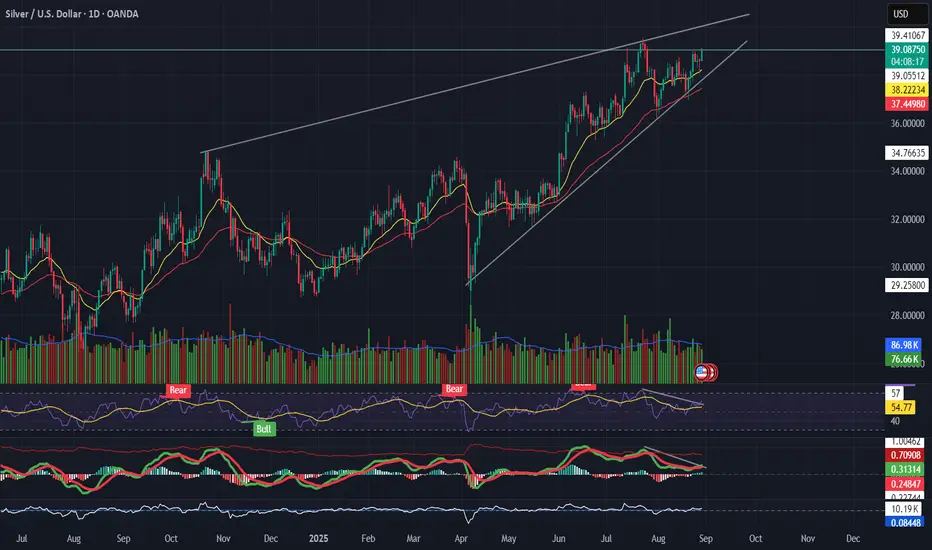
Silver (XAGUSD) Trading in a rising wedge Pattern📌 Silver (XAGUSD)
Trading in a rising wedge, pressing resistance near $39.
RSI divergence → price making higher highs, momentum not following.
MACD rolling over while price climbs = possible bearish divergence.
Support to watch: $37.3 → wedge breakdown if breached.
👉 Bullish only if $39.5 breaks with strong volume; otherwise, risk of pullback.
---
🎯 Takeaway
Silver = extended wedge → caution, momentum weak.
Silver at Multiple Confluence ResistanceSilver came up to a confluence of three Channel Resistances on all major timeframes i.e. Monthly, Weekly & Daily. Near term support currently is only the Daily Channel Support line & the last breakout attempt on D1 has failed to a certain extent. Should big volatility be expected? A break of such strong resistance may signal strong bullish momentum but can the support hold under such conditions.