XAGUSD/SILVER WEEKLY SELL PROJECTION 01.02.26XAGUSD Weekly Sell Projection – Script
This is the weekly technical analysis of XAGUSD, also known as Silver.
Price was previously moving inside a parallel uptrend channel.
Near the top of the channel, the market formed an Evening Star candlestick pattern, which indicates a potential bearish reversal.
After this pattern, price clearly broke the uptrend trendline, confirming weakness in bullish momentum.
Currently, price has made a strong bearish impulse.
Based on market structure, a retracement toward the broken trendline and resistance zone is expected.
This retracement zone acts as a potential selling area.
Trade Plan:
Entry: Sell near resistance and trendline retest
Stop Loss: Above the resistance zone
Target 1: Previous support level (S1)
Target 2: Major support level (S2)
As long as price remains below the broken trendline, the overall weekly bias stays bearish.
Always use proper risk management.
This analysis is for educational purposes only.
Xagusdanalysis

Silve is going to moon higher speed than GOLD #xauusdSilve is going to moon higher speed than GOLD #xauusd and this is my next move i analysis from 50 to 100 then 91 to 114 and form next level to next tp of silver as i analysis as of now it takes time and in between a small correction will be possible and then ne xt tp hits of #xagusd
Silve is going to moon higher speed than GOLD #xauusd and this is my next move i analysis from 50 to 100 then 91 to 114 and form next level to next tp of silver as i analysis as of now it takes time and in between a small correction will be possible and then ne xt tp hits of #xagusd
Silve is going to moon higher speed than GOLD #xauusd and this is my next move i analysis from 50 to 100 then 91 to 114 and form next level to next tp of silver as i analysis as of now it takes time and in between a small correction will be possible and then ne xt tp hits of #xagusd

SILVER | XAGUSD 1H Chart - Make or Break LevelsFX:XAGUSD MCX:SILVER1!
Silver is trading at a make-or-break support zone — this level will decide whether the broader uptrend survives or cracks.
🔹 Price is sitting near the 200 EMA, a level that historically acted as a launchpad
🔹 Last time Silver tested the 200 EMA (around $50), it marked the base before a multi-year breakout
🔹 Now, price has again pulled back to the same EMA near $70
📌 Key Observation:
As long as Silver holds above the 200 EMA, this move looks like a healthy retracement, not trend failure.
To Reduce the Noise switch to 4h Chart and see its forming 2 range candle just above 50EMA a break ot that will trigger the trade.
Need Confirmation from 4h chart then only go long
Keep Learning, Happy Trading.

silver intraday trade ideasilver can be bought near pink marked zone with sl slightly below that zone for quick intraday scalp or trade rest all are mentioned in chart

XAGUSD ANALYSISAs per my analysis we can see correction in both silver and gold and we can see a new last high in upcoming months as per this market can form now abc pattern as a corrective pattern it will takes time. as per my view high is formed of 3rd wave and now silver is in correction.
you can post your comment for more analysis
Thanks
Ishu Prajapati

XAG/USD Technical Analysis (as of October 19, 2025)Current Market Snapshot
The spot price of silver (XAG/USD) stands at 51.91430 USD per ounce, reflecting a sharp decline of -2.3663 (-4.36%) from the previous close of 54.24 in daily time frame. This pullback follows recent record highs near 54.48, driven by safe-haven demand amid geopolitical tensions and inflation concerns, but now facing profit-taking and a stronger USD.
Support and Resistance Levels
Immediate support is at 51.44, with a critical level at 50.00 if breached.
Resistance looms at 54 to 57.02.
Chart for your reference
~~ Disclaimer ~~
Trading or investing in assets like crypto, equity, or commodities carries high risk and may not suit all investors.
Analysis on this channel uses recent technical data and market sentiment from web sources for informational and educational purposes only, not financial advice. Trading involves high risks, and past performance does not guarantee future results. Always conduct your own research or consult a SEBI-registered advisor before investing or trading.
This channel, Render With Me, is not responsible for any financial loss arising directly or indirectly from using or relying on this information.

Red Alert for Buyers as XAGUSD Nears $49 – Correction AheadSilver price (XAGUSD) faces strong resistance near $49. Neal Bhai Reports warns a “Red Alert for Buyers.” Check latest silver analysis with buy/sell targets, stop loss, and key support levels for traders.
Silver prices have shown a sharp rally, reaching near the $49–$50 zone — a strong resistance area. According to the chart, buyers should stay cautious now as the metal looks overextended. A short-term correction may hit the market soon.
The technical setup suggests that profit booking could start around current levels, pushing silver towards $44 or even $42 in the coming sessions.

Silver Spot Price Technical Analysis [28-09-2025] Buy on DipsAny Correction Buy on Dips - Silver Spot (XAG/USD) daily chart from (dated 2025.09.27), here’s a technical analysis: The chart indicates a continuation of an uptrend, with the price recently breaking out above a key resistance level around 45.013. This breakout is supported by a strong upward move, suggesting bullish momentum.

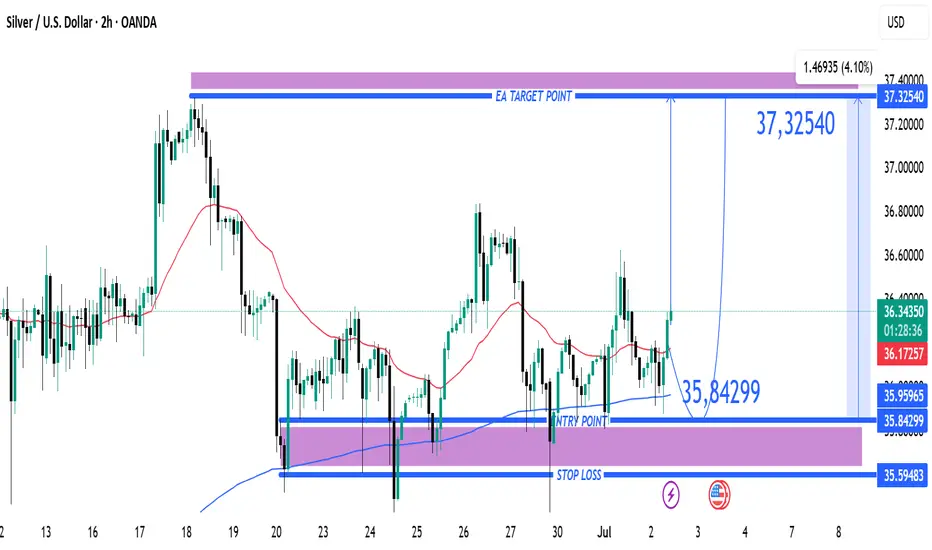
Silver (XAG/USD) Bullish Trade Setup from Key Support Zone XAG/USD (Silver) Trade Analysis – 2H Chart (July 2, 2025)
🔹 Trade Setup Overview:
Entry Point: 35.84299
Target (TP): 37.32540
Stop Loss (SL): 35.59483
Current Price: 36.36350
Risk/Reward Ratio: ~5.9:1 (Very favorable)
🔹 Technical Insights:
Support Zone:
Price recently tested and respected a strong demand zone between 35.60 – 35.84, which has now acted as a bounce level.
Multiple wicks and rejections at this zone highlight buyer interest.
Moving Averages:
50 EMA (red) is starting to flatten, possibly hinting at momentum reversal.
200 EMA (blue) held as dynamic support during the last dip — a bullish signal.
Breakout Potential:
Price has bounced off the entry zone and is approaching minor resistance near 36.40–36.60.
A clean break above this area can trigger momentum toward the 37.30s.
Volume & Momentum:
The latest candle shows strong bullish momentum, validating the bounce setup.
No sign of exhaustion yet.
🔹 Strategy Suggestion:
Entry has already occurred or is slightly above entry zone — ideal for aggressive traders to ride the momentum.
Conservative traders may wait for a pullback near 36.00–36.10 before entering.
SL is well-placed below previous lows and structure — reasonable protection.
🔹 Conclusion:
This setup reflects a bullish continuation trade from a strong support zone. Given the risk/reward profile and recent bullish action, this trade is technically sound as long as price stays above 35.84. A close below this level could invalidate the setup
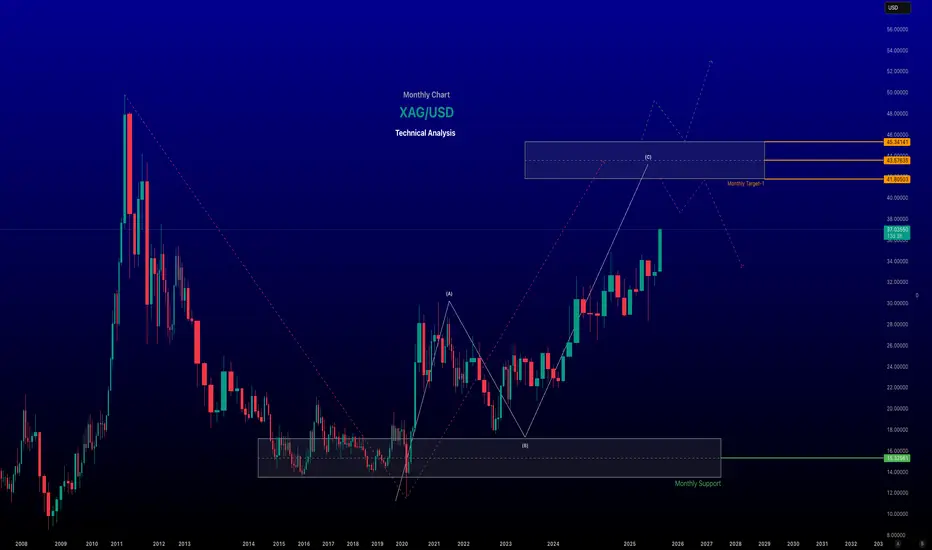
XAG/USD (Silver Spot vs. US Dollar) Analysis - Monthly Chart ~~ XAG/USD (Silver Spot vs. US Dollar) Analysis ~~
#Current Price and Recent Performance
As of June 18, 2025, the XAG/USD spot price is approximately $37.00 per troy ounce at the time of posting, reflecting a 13-year high. Silver has surged nearly 30% year-to-date in 2025, driven by heightened safe-haven demand amid geopolitical tensions, particularly in the Middle East, and global economic uncertainties. Over the past month, silver prices have risen by 12.43%, and year-over-year, they are up 23.33%.
-- Key Drivers of Recent Trends
Geopolitical Tensions: Escalating conflicts, such as Israel’s military actions in Iran, have boosted demand for safe-haven assets like silver and gold. This has been a significant catalyst for silver’s rally, with prices climbing in tandem with gold.
US Dollar Weakness: A softer US dollar, influenced by expectations of Federal Reserve rate cuts and softer inflation data, has supported higher silver prices. Since silver is priced in USD, a weaker dollar makes it more affordable for foreign investors, increasing demand.
Industrial Demand: Silver’s dual role as a precious and industrial metal (used in electronics, solar panels, and medical devices) accounts for ~56% of its demand. Growing industrial applications, particularly in green technologies, continue to support price growth.
Supply Constraints: A persistent supply deficit of 150–200 million ounces annually (10–20% of total supply) and declining above-ground inventories by nearly 500 million ounces in recent years have tightened the market, pushing prices higher.
Speculative Activity: Futures and spot market trading on exchanges like COMEX and the London Bullion Market, coupled with speculative interest, contribute to price volatility. The market is also influenced by “paper silver” (futures, ETFs), which some argue suppresses physical silver prices.
~~Technical Analysis~~
Current Levels and Trends: Silver is trading above the key support zone of $34.90–$35.15, maintaining a bullish outlook. Recent suggest a strong bullish trend, with a breakout above a downward trend line and minor resistance on the 4-hour chart.
Support and Resistance:
Support: Key levels include $34.99, $33.70, $32.67, and the 0.618 Fibonacci retracement at ~$35.00.
Resistance: Immediate resistance lies at $37.85, with further targets at $38.00 and potentially $40.34–$44.21 in the coming weeks or months.
-- Disclaimer --
This analysis is based on recent technical data and market sentiment from web sources. It is for informational purposes only and not financial advice. Trading involves high risks, and past performance does not guarantee future results. Always conduct your own research or consult a SEBI-registered advisor before trading.
#Boost and comment will be highly appreciated
Silver (XAG/USD) Bullish Breakout Setup – 4H Chart Analysis📈 Bullish Setup
Key Zones & Levels:
🔵 Current Price: 33.48
🟣 EMA 70 (Support): 32.83
🔻 Acting as dynamic support
🟦 Demand Zone:
📍 32.54 - 32.83
🟢 Strong buying interest expected here
🟥 Resistance Zone:
📍 Around 33.48 - 33.60
⚠️ Breakout above this zone could trigger buying momentum
Trade Setup:
🚀 Entry Point:
🔵 33.11 - 33.12
🛑 Stop Loss:
🔻 32.54 (Just below demand zone and EMA)
🎯 Target (Take Profit):
🎯 35.50
✨ Potential gain if breakout confirms
Price Path Projection:
🔹 Scenario 1: Bounce from demand zone → Break resistance → Hit target
🟢➡️📈➡️🎯
🔸 Scenario 2: Immediate breakout above resistance
📈⚡➡️🎯
Summary:
Trend: Bullish
EMA and trendline support price
Risk/Reward is favorable
Watch for confirmation before entry

Precision Pays Off: Analysis Hit Again! Another Win🎯 Analysis On Point Again!
My recent analysis played out exactly as expected. 📉📈 Those who followed my instructions not only gained profits but also improved their trading knowledge and decision-making skills.
Success in trading isn't just about luck — it's about learning to read the market with precision and discipline. 📚💡
To those who’ve been riding along — congratulations on your gains! 🥂 And to the new followers, stay tuned. The next winning setups are just around the corner.
Let’s grow, learn, and earn — together. 🚀💸

XAG/USD Rejection Looming at Key Resistance – Bearish Reversal A🔍 Chart Analysis – XAG/USD
1. Trend & EMAs:
The chart shows two key exponential moving averages:
📈 EMA 50 (Red): 33.1940
📉 EMA 200 (Blue): 32.8684
Price is currently above both EMAs, indicating a short-term bullish trend, but a possible bearish rejection is forming near resistance.
2. Key Zones:
🟥 Resistance Zone: 33.45 – 33.60
Price has repeatedly tested this zone and reversed, suggesting strong selling pressure.
Multiple wicks into this zone show buyer exhaustion.
🟩 Support Zone: 32.60 – 32.85
Strong demand observed here with consistent bounces.
The EMA 200 also aligns with this support, reinforcing its strength.
3. Price Behavior & Pattern:
🧱 Repetitive Bearish Drops: Marked by blue rectangles, suggesting a pattern of sharp sell-offs after touching resistance.
🔁 Potential Double Top Pattern forming near the resistance zone, a classic bearish reversal signal.
🧭 The projected path suggests:
A short-term retest of the resistance.
Followed by a pullback toward the support zone around 32.60.
Breakdown below support could open further downside potential.
📌 Summary:
⚠️ Short-Term Outlook: Bearish bias if resistance holds.
📍 Key Level to Watch: 33.60 (breakout) and 32.60 (breakdown).
🔄 Trade Plan:
Consider short entries near 33.45–33.60 resistance zone with stops above 33.65.
Target around 32.65–32.60 support zone.
📊 Indicators in Play:
EMA confluence supports trend analysis.
Price structure and rejection patterns suggest likely mean reversion to support.

Silver (XAG/USD) Falling Wedge Breakout –Bullish Setup Targeting📉 Pattern: Falling Wedge
🔵 Price was consolidating inside a falling wedge (🔽), which is typically a bullish reversal pattern.
🟡 Multiple touchpoints along the trendline confirm the structure.
Support Zone: 🔵
Area: 31.95 – 32.10
✅ Price tapped into this strong demand zone
🔥 Big bullish wick shows rejection – buyers stepping in!
EMA 70: 🔴
🧭 Acting as a potential dynamic resistance at 33.04
Watch for a clean breakout above it to confirm momentum.
Trade Setup:
Entry: ✅ Current area (~32.44) looks like a good long entry after bounce.
Stop Loss: ❌ Below 31.95 (under the blue zone)
Target: 🎯 33.68510 (Previous high)
📈 Huge upside potential if wedge breakout confirms!
Summary:
📉 Pattern: Falling Wedge
🔵 Strong Support Zone
✅ Bullish Rejection
🎯 Target: 33.68
❌ Stop Loss: Below 31.95
⚠️ Watch EMA 70 for resistance
🟢 Bias: Bullish – looking for breakout!

"Silver Short Setup: Supply Zone Rejection &Targeting Major SptChart Analysis for Silver/USD (XAG/USD) 🪙
🔵 Entry Point: 32.64870
📍This is where the trade is planned to start (short/sell).
🧲 Price is approaching this level again — watch for rejection.
🟥 Supply Zone: 32.65 - 33.16
⚠️ “SuPly Zone!” — Area of potential selling pressure.
🧱 Price previously reversed here, so it's a key resistance.
👀 Wait for bearish confirmation before entering.
❌ Stop Loss: 33.16322
🚨 Risk control: If price hits this level, the setup is invalid.
📈 If price breaks above, it could go higher — time to exit.
🎯 Target Point: 30.58219
🪂 The take profit zone — aim here!
🧊 It’s a previous support level where price might bounce.
📉 Trade Direction: SHORT (SELL)
🧾 Entry: 32.64870
🛑 Stop Loss: 33.16322
✅ Target: 30.58219
⚖️ Risk/Reward: ~1:4
🔻 Potential Move: -6.16%
📊 Trend & Indicators
🟠 Price recently moved up, now facing resistance.
🟢 EMA (7) is being tested — may act as dynamic resistance.
🔄 Several swing highs/lows marked with yellow dots — helps visualize market structure.
What to Watch For:
🔎 Bearish candlestick patterns inside the supply zone.
🧨 Sharp rejection or wick candles = good entry signal.
⏱️ Patience is key — let the setup come to you.

Silver (XAG/USD) Bullish Trade Setup: Entry, Target & Stop-Loss Entry Point: ~32.35619
Take Profit (Target Point): 33.31252
Stop Loss: 31.87803
EMA 200 (Blue): 31.65932 – indicating long-term trend support.
EMA 30 (Red): 32.28304 – indicating short-term trend.
Current Price: 32.38220
The price is above both EMAs, which is typically bullish.
---
Analysis
1. Bullish Bias:
Price has broken and is holding above the entry zone.
Both EMAs are aligned in a bullish configuration (short-term EMA above long-term EMA).
The market structure shows higher lows and sideways consolidation, suggesting potential for a breakout.
2. Risk-Reward Ratio:
Risk (Entry to Stop Loss)

XAG/USD Eyes Upside Targets as Wave C MaturesXAG/USD is currently trading in a corrective phase where wave B appears to have completed, and wave C is currently forming. Based on the current price action, it doesn’t seem likely that this entire move will result in a full bullish recovery. The structure suggests that this could be sub-wave C of wave 4, potentially completing around the 26.79944 level. Going forward, if the 5th wave begins to unfold, potential targets could be in the range of 29.74182 to 30.57528.

"Silver on the Rise: RBR Zone Holds the Key to $33.49!"Key Zones:
🔵 RBR Zone (Rally-Base-Rally):
🔹 Acts as support
🔹 Price consolidating above it
🔹 If held, it could trigger a move up
📍 Support:
RBR Zone: ~$31.80–$32.10
Deeper support at $30.45 🛡️
🎯 Target Point: $33.49
Strong resistance zone
Previous high zone = profit-taking spot
📉 Downside Risk:
If price breaks below RBR zone and trendline
Could fall to $30.45 support zone
Trend Structure:
📈 Uptrend (Higher Highs + Higher Lows)
🧵 Trendline acting as dynamic support
🟡 Price bouncing from marked pivot zones
Scenarios:
🟢 Bullish Case:
✅ Hold RBR zone
✅ Bounce from trendline
🚀 Target = $33.49
🔴 Bearish Case:
❌ Break below RBR zone
⚠️ Risk drop to $30.45
Summary:
📊 Bias: Bullish above $32.00
📥 Entry Idea: Buy from RBR zone on confirmation
🎯 Target: $33.49
❌ Stop Loss: Below $31.50

Silver (XAG/USD) Price Analysis – Key Levels & Market Outlook🔍 Key Observations:
📊 Current Price: 34.19250 USD
📈 DEMA (9, close): 34.25605 USD
🎯 Target Price: 35.38940 - 35.5000 USD
🔵 Zones Identified:
🟦 Supply Zone: 34.50 - 34.80 USD (🔼 Selling pressure area)
🟦 RBS Zone: 34.00 - 34.20 USD (🔽 Potential bounce zone)
🟦 Lower RBS Zone: 32.80 - 33.20 USD (⬇️ Strong support)
📉 Market Scenarios:
✅ Bullish Case:
Price bounces off the RBS zone at 34.00 USD ➡️ Uptrend resumes 🚀
Target: 35.50 USD 🎯
❌ Bearish Case:
Breaks below 34.00 USD ❗
Next stop: 33.00 USD ⚠️
📢 Final Thoughts:
🟢 Buyers: Wait for a bounce at 34.00 USD before entering 📈
🔴 Sellers: Look for rejection at 34.50 - 34.80 USD or breakdown below 34.00 USD 📉
⚡ Key Level to Watch: 34.00 USD 👀 A hold = bullish 📊, a break = bearish ⚠️

XAG/USD (Silver) 4H Trading Analysis📍 Current Price: 33.0990 (Near Entry Zone)
🔹 Trading Setup:
🟢 Entry Zone: 32.97654
🔴 Stop-Loss (SL): 32.48368 ❌
🔵 Take-Profit (TP) Levels:
TP1: 33.30512 🎯
TP2: 33.62431 🎯🎯
Final Target: 34.19599 🚀
📊 Price Action Insights:
✅ Bounce from Demand Zone (Gray Box) 📈
✅ Potential Bullish Move if price holds above entry 🚀
⚠️ Risk if SL is hit (Red Box) ❌

XAGUSD_4HXAGUSD_4H ANALYSIS
Everything is mentioned on Charts.
Please always look for double confirmation before entry
Wish you Happy & safe Trading.
Trade as per your own RISK
Please Note:
My studies are for educational purpose only.
Please consult your financial advisor before Trading or Investing.
I'm not responsible for any kinds of your Profits & Losses.

XAGUSD SHOWING A GOOD UP MOVE WITH 1:7 RISK REWARDXAGUSD SHOWING A GOOD UP MOVE WITH 1:7 RISK REWARD
DUE TO THESE REASON
A. its following a rectangle pattern that stocked the market
which preventing the market to move any one direction now it trying to break the strong resistant lable
B. after the break of this rectangle it will boost the market potential for break
C. also its resisting from a strong neckline the neckline also got weeker ald the price is ready to break in the outer region
all of these reason are indicating the same thing its ready for breakout BREAKOUT trading are follws good risk reward
please dont use more than one percentage of your capitalfollow risk reward and tradeing rules
that will help you to to become a bettertrader
thank you

XAGUSD SHOWING A GOOD DOWN MOVE WITH 1:10 RISK REWARDXAGUSD SHOWING A GOOD DOWN MOVE WITH 1:10 RISK REWARD
DUE TO THESE REASON
A. its following a rectangle pattern that stocked the market
which preventing the market to move any one direction now it trying to break the strong resistant lable
B. after the break of this rectangle it will boost the market potential for break
C. also its resisting from a strong neckline the neckline also got weeker ald the price is ready to break in the outer region
all of these reason are indicating the same thing its ready for breakout BREAKOUT trading are follws good risk reward
please dont use more than one percentage of your capitalfollow risk reward and tradeing rules
that will help you to to become a bettertrader
thank you
