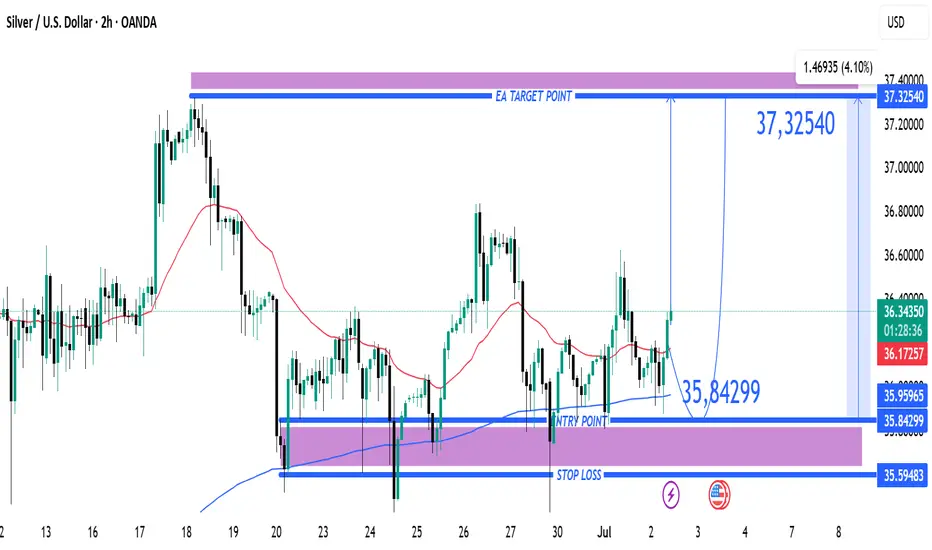
Silver (XAG/USD) Bullish Trade Setup from Key Support Zone XAG/USD (Silver) Trade Analysis – 2H Chart (July 2, 2025)
🔹 Trade Setup Overview:
Entry Point: 35.84299
Target (TP): 37.32540
Stop Loss (SL): 35.59483
Current Price: 36.36350
Risk/Reward Ratio: ~5.9:1 (Very favorable)
🔹 Technical Insights:
Support Zone:
Price recently tested and respected a strong demand zone between 35.60 – 35.84, which has now acted as a bounce level.
Multiple wicks and rejections at this zone highlight buyer interest.
Moving Averages:
50 EMA (red) is starting to flatten, possibly hinting at momentum reversal.
200 EMA (blue) held as dynamic support during the last dip — a bullish signal.
Breakout Potential:
Price has bounced off the entry zone and is approaching minor resistance near 36.40–36.60.
A clean break above this area can trigger momentum toward the 37.30s.
Volume & Momentum:
The latest candle shows strong bullish momentum, validating the bounce setup.
No sign of exhaustion yet.
🔹 Strategy Suggestion:
Entry has already occurred or is slightly above entry zone — ideal for aggressive traders to ride the momentum.
Conservative traders may wait for a pullback near 36.00–36.10 before entering.
SL is well-placed below previous lows and structure — reasonable protection.
🔹 Conclusion:
This setup reflects a bullish continuation trade from a strong support zone. Given the risk/reward profile and recent bullish action, this trade is technically sound as long as price stays above 35.84. A close below this level could invalidate the setup
Xagusdsignals
Silver (XAG/USD) Bullish Breakout Setup – 4H Chart Analysis📈 Bullish Setup
Key Zones & Levels:
🔵 Current Price: 33.48
🟣 EMA 70 (Support): 32.83
🔻 Acting as dynamic support
🟦 Demand Zone:
📍 32.54 - 32.83
🟢 Strong buying interest expected here
🟥 Resistance Zone:
📍 Around 33.48 - 33.60
⚠️ Breakout above this zone could trigger buying momentum
Trade Setup:
🚀 Entry Point:
🔵 33.11 - 33.12
🛑 Stop Loss:
🔻 32.54 (Just below demand zone and EMA)
🎯 Target (Take Profit):
🎯 35.50
✨ Potential gain if breakout confirms
Price Path Projection:
🔹 Scenario 1: Bounce from demand zone → Break resistance → Hit target
🟢➡️📈➡️🎯
🔸 Scenario 2: Immediate breakout above resistance
📈⚡➡️🎯
Summary:
Trend: Bullish
EMA and trendline support price
Risk/Reward is favorable
Watch for confirmation before entry

Precision Pays Off: Analysis Hit Again! Another Win🎯 Analysis On Point Again!
My recent analysis played out exactly as expected. 📉📈 Those who followed my instructions not only gained profits but also improved their trading knowledge and decision-making skills.
Success in trading isn't just about luck — it's about learning to read the market with precision and discipline. 📚💡
To those who’ve been riding along — congratulations on your gains! 🥂 And to the new followers, stay tuned. The next winning setups are just around the corner.
Let’s grow, learn, and earn — together. 🚀💸

XAG/USD Rejection Looming at Key Resistance – Bearish Reversal A🔍 Chart Analysis – XAG/USD
1. Trend & EMAs:
The chart shows two key exponential moving averages:
📈 EMA 50 (Red): 33.1940
📉 EMA 200 (Blue): 32.8684
Price is currently above both EMAs, indicating a short-term bullish trend, but a possible bearish rejection is forming near resistance.
2. Key Zones:
🟥 Resistance Zone: 33.45 – 33.60
Price has repeatedly tested this zone and reversed, suggesting strong selling pressure.
Multiple wicks into this zone show buyer exhaustion.
🟩 Support Zone: 32.60 – 32.85
Strong demand observed here with consistent bounces.
The EMA 200 also aligns with this support, reinforcing its strength.
3. Price Behavior & Pattern:
🧱 Repetitive Bearish Drops: Marked by blue rectangles, suggesting a pattern of sharp sell-offs after touching resistance.
🔁 Potential Double Top Pattern forming near the resistance zone, a classic bearish reversal signal.
🧭 The projected path suggests:
A short-term retest of the resistance.
Followed by a pullback toward the support zone around 32.60.
Breakdown below support could open further downside potential.
📌 Summary:
⚠️ Short-Term Outlook: Bearish bias if resistance holds.
📍 Key Level to Watch: 33.60 (breakout) and 32.60 (breakdown).
🔄 Trade Plan:
Consider short entries near 33.45–33.60 resistance zone with stops above 33.65.
Target around 32.65–32.60 support zone.
📊 Indicators in Play:
EMA confluence supports trend analysis.
Price structure and rejection patterns suggest likely mean reversion to support.

Silver (XAG/USD) Falling Wedge Breakout –Bullish Setup Targeting📉 Pattern: Falling Wedge
🔵 Price was consolidating inside a falling wedge (🔽), which is typically a bullish reversal pattern.
🟡 Multiple touchpoints along the trendline confirm the structure.
Support Zone: 🔵
Area: 31.95 – 32.10
✅ Price tapped into this strong demand zone
🔥 Big bullish wick shows rejection – buyers stepping in!
EMA 70: 🔴
🧭 Acting as a potential dynamic resistance at 33.04
Watch for a clean breakout above it to confirm momentum.
Trade Setup:
Entry: ✅ Current area (~32.44) looks like a good long entry after bounce.
Stop Loss: ❌ Below 31.95 (under the blue zone)
Target: 🎯 33.68510 (Previous high)
📈 Huge upside potential if wedge breakout confirms!
Summary:
📉 Pattern: Falling Wedge
🔵 Strong Support Zone
✅ Bullish Rejection
🎯 Target: 33.68
❌ Stop Loss: Below 31.95
⚠️ Watch EMA 70 for resistance
🟢 Bias: Bullish – looking for breakout!

"Silver Short Setup: Supply Zone Rejection &Targeting Major SptChart Analysis for Silver/USD (XAG/USD) 🪙
🔵 Entry Point: 32.64870
📍This is where the trade is planned to start (short/sell).
🧲 Price is approaching this level again — watch for rejection.
🟥 Supply Zone: 32.65 - 33.16
⚠️ “SuPly Zone!” — Area of potential selling pressure.
🧱 Price previously reversed here, so it's a key resistance.
👀 Wait for bearish confirmation before entering.
❌ Stop Loss: 33.16322
🚨 Risk control: If price hits this level, the setup is invalid.
📈 If price breaks above, it could go higher — time to exit.
🎯 Target Point: 30.58219
🪂 The take profit zone — aim here!
🧊 It’s a previous support level where price might bounce.
📉 Trade Direction: SHORT (SELL)
🧾 Entry: 32.64870
🛑 Stop Loss: 33.16322
✅ Target: 30.58219
⚖️ Risk/Reward: ~1:4
🔻 Potential Move: -6.16%
📊 Trend & Indicators
🟠 Price recently moved up, now facing resistance.
🟢 EMA (7) is being tested — may act as dynamic resistance.
🔄 Several swing highs/lows marked with yellow dots — helps visualize market structure.
What to Watch For:
🔎 Bearish candlestick patterns inside the supply zone.
🧨 Sharp rejection or wick candles = good entry signal.
⏱️ Patience is key — let the setup come to you.

Silver (XAG/USD) Bullish Trade Setup: Entry, Target & Stop-Loss Entry Point: ~32.35619
Take Profit (Target Point): 33.31252
Stop Loss: 31.87803
EMA 200 (Blue): 31.65932 – indicating long-term trend support.
EMA 30 (Red): 32.28304 – indicating short-term trend.
Current Price: 32.38220
The price is above both EMAs, which is typically bullish.
---
Analysis
1. Bullish Bias:
Price has broken and is holding above the entry zone.
Both EMAs are aligned in a bullish configuration (short-term EMA above long-term EMA).
The market structure shows higher lows and sideways consolidation, suggesting potential for a breakout.
2. Risk-Reward Ratio:
Risk (Entry to Stop Loss)

XAGUSD SHOWING A GOOD UP MOVE WITH 1:7 RISK REWARDXAGUSD SHOWING A GOOD UP MOVE WITH 1:7 RISK REWARD
DUE TO THESE REASON
A. its following a rectangle pattern that stocked the market
which preventing the market to move any one direction now it trying to break the strong resistant lable
B. after the break of this rectangle it will boost the market potential for break
C. also its resisting from a strong neckline the neckline also got weeker ald the price is ready to break in the outer region
all of these reason are indicating the same thing its ready for breakout BREAKOUT trading are follws good risk reward
please dont use more than one percentage of your capitalfollow risk reward and tradeing rules
that will help you to to become a bettertrader
thank you

XAGUSD SHOWING A GOOD DOWN MOVE WITH 1:10 RISK REWARDXAGUSD SHOWING A GOOD DOWN MOVE WITH 1:10 RISK REWARD
DUE TO THESE REASON
A. its following a rectangle pattern that stocked the market
which preventing the market to move any one direction now it trying to break the strong resistant lable
B. after the break of this rectangle it will boost the market potential for break
C. also its resisting from a strong neckline the neckline also got weeker ald the price is ready to break in the outer region
all of these reason are indicating the same thing its ready for breakout BREAKOUT trading are follws good risk reward
please dont use more than one percentage of your capitalfollow risk reward and tradeing rules
that will help you to to become a bettertrader
thank you

XAG/SILVER 4H BUY PROJECTION 19.08.24Silver tends to outperform gold in terms of return and can deliver a higher return on investment. However, silver's real value is as a hedge and safe haven asset and the primary reason to own silver is not about wealth accumulation but about wealth protection and hedging risk in an uncertain world.

XAGUSD - This pullback is an opportunity!Silver was following an upward move with gold and stayed strong until there came some dollar strength-ness, last week gold sold off heavily and thus pushing silver lower towards 29.2 levels, this bearishness may vanish with coming days, as global tension rise due to war situation, and risk off assets like gold and silver may show bullish moves again, if you want to buy silver, consider for a strict stop-loss.
Important- This is my own view and not financial advice, trading is highly risky, do calculate your risk before trading.

