XAG/USD 4H Analysis: Falling Wedge Reversal | Buy the Dip Silver (XAG/USD) is approaching a technically important reversal zone on the 4-hour timeframe. After a prolonged bearish move, price has formed a falling wedge, a structure that often signals exhaustion of selling pressure and the beginning of a bullish reversal.
According to the Market Footprinting Trading Concept, the current price action suggests that sellers are gradually losing momentum while smart liquidity is being collected near a major demand area. The recent downside move appears to b
Xagusdtrade
XAGUSD/SILVER SELL PROJECTION 04.03.26Let’s take a look at the Silver market (XAGUSD) and the potential sell opportunity we are currently watching.
Previously, the market broke the neckline support, which clearly indicates that buyers are losing strength and the market structure is starting to shift towards a bearish direction.
After the strong rejection from the top, price created a sharp impulsive move downward, confirming that sellers are gaining control in the market.
Now we are expecting the market to pull back into the resi
XAGUSD/SILVER DAY BUY PROJECTION 23.02.26First, price broke the neckline and created strong buying momentum, confirming a shift in trend.
After that, the market pulled back into a Fair Value Gap, which is where smart money typically looks for entries.
Right at this zone, we also have trendline support and a strong bullish Marubozu candle —
this gives us a high-probability confluence for a long position.
The ideal entry comes from the FVG area,
with targets placed at the previous resistance levels and the Fibonacci zones —
around the
XAGUSD/SILVER WEEKLY PROJECTION 17.02.26This week, silver is showing a clear bearish setup on the higher timeframe.
Price has reached a strong resistance zone near R1, where we can see a bearish engulfing pattern forming.
This indicates that sellers are stepping into the market and momentum is shifting to the downside.
Currently, price is trading along the ascending trendline, but a breakdown below this structure will be the key confirmation for short positions.
The plan is simple:
We wait for a clean breakdown, followed by a rete
XAGUSD/SILVER WEEKLY SELL PROJECTION 01.02.26XAGUSD Weekly Sell Projection – Script
This is the weekly technical analysis of XAGUSD, also known as Silver.
Price was previously moving inside a parallel uptrend channel.
Near the top of the channel, the market formed an Evening Star candlestick pattern, which indicates a potential bearish reversal.
After this pattern, price clearly broke the uptrend trendline, confirming weakness in bullish momentum.
Currently, price has made a strong bearish impulse.
Based on market structure, a retracem
SILVER (XAGUSD) – Weekly Projection Analysis (24-01-26)
Overall Bias: 🔥 Strong Bullish
🔹 Market Structure
Price is clearly inside a bullish channel
Previous trendline break → clean retest
Retest aligns perfectly with 50% Fibonacci level
👉 This is a high-probability continuation zone
🔹 Key Levels
Support S2: ~96
Support S1: ~99–100
Entry Zone: Broken trendline + 50% Fibo (around 100)
Stop Loss: Below ~96 (structure protection)
Resistance R1: ~112–114
Target Zone: 115 – 120+ (New ATH zone) 🚀
🔹 Candle Strength
Strong bullish impulse candle
XAGUSD ANALYSISAs per my analysis we can see correction in both silver and gold and we can see a new last high in upcoming months as per this market can form now abc pattern as a corrective pattern it will takes time. as per my view high is formed of 3rd wave and now silver is in correction.
you can post your comment for more analysis
Thanks
Ishu Prajapati
Red Alert for Buyers as XAGUSD Nears $49 – Correction AheadSilver price (XAGUSD) faces strong resistance near $49. Neal Bhai Reports warns a “Red Alert for Buyers.” Check latest silver analysis with buy/sell targets, stop loss, and key support levels for traders.
Silver prices have shown a sharp rally, reaching near the $49–$50 zone — a strong resistance area. According to the chart, buyers should stay cautious now as the metal looks overextended. A short-term correction may hit the market soon.
The technical setup suggests that profit booking could s
X
Silver Spot Price Technical Analysis [28-09-2025] Buy on DipsAny Correction Buy on Dips - Silver Spot (XAG/USD) daily chart from (dated 2025.09.27), here’s a technical analysis: The chart indicates a continuation of an uptrend, with the price recently breaking out above a key resistance level around 45.013. This breakout is supported by a strong upward move, suggesting bullish momentum.
XLong
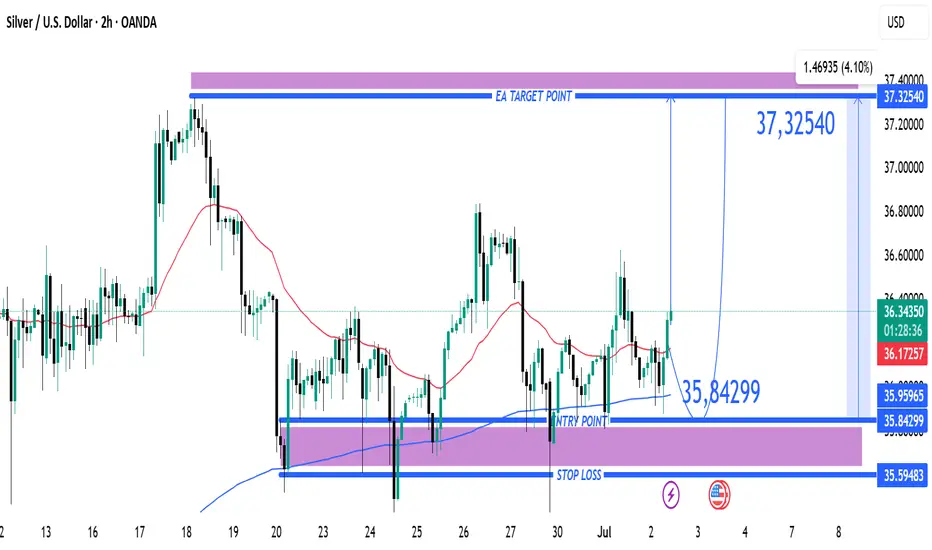
Silver (XAG/USD) Bullish Trade Setup from Key Support Zone XAG/USD (Silver) Trade Analysis – 2H Chart (July 2, 2025)
🔹 Trade Setup Overview:
Entry Point: 35.84299
Target (TP): 37.32540
Stop Loss (SL): 35.59483
Current Price: 36.36350
Risk/Reward Ratio: ~5.9:1 (Very favorable)
🔹 Technical Insights:
Support Zone:
Price recently tested and respected a strong demand zone between 35.60 – 35.84, which has now acted as a bounce level.
Multiple wicks and rejections at this zone highlight buyer interest.
Moving Averages:
50 EMA (red) is starting to flat
Precision Pays Off: Analysis Hit Again! Another Win🎯 Analysis On Point Again!
My recent analysis played out exactly as expected. 📉📈 Those who followed my instructions not only gained profits but also improved their trading knowledge and decision-making skills.
Success in trading isn't just about luck — it's about learning to read the market with precision and discipline. 📚💡
To those who’ve been riding along — congratulations on your gains! 🥂 And to the new followers, stay tuned. The next winning setups are just around the corner.
Let’s grow,
XAG/USD Rejection Looming at Key Resistance – Bearish Reversal A🔍 Chart Analysis – XAG/USD
1. Trend & EMAs:
The chart shows two key exponential moving averages:
📈 EMA 50 (Red): 33.1940
📉 EMA 200 (Blue): 32.8684
Price is currently above both EMAs, indicating a short-term bullish trend, but a possible bearish rejection is forming near resistance.
2. Key Zones:
🟥 Resistance Zone: 33.45 – 33.60
Price has repeatedly tested this zone and reversed, suggesting strong selling pressure.
Multiple wicks into this zone show buyer exhaustion.
🟩 Support Zone: 32.6
Silver (XAG/USD) Bullish Trade Setup: Entry, Target & Stop-Loss Entry Point: ~32.35619
Take Profit (Target Point): 33.31252
Stop Loss: 31.87803
EMA 200 (Blue): 31.65932 – indicating long-term trend support.
EMA 30 (Red): 32.28304 – indicating short-term trend.
Current Price: 32.38220
The price is above both EMAs, which is typically bullish.
---
Analysis
1. Bullish Bias:
Price has broken and is holding above the entry zone.
Both EMAs are aligned in a bullish configuration (short-term EMA above long-term EMA).
The market structure shows higher lo
XAGUSD SHOWING A GOOD UP MOVE WITH 1:7 RISK REWARDXAGUSD SHOWING A GOOD UP MOVE WITH 1:7 RISK REWARD
DUE TO THESE REASON
A. its following a rectangle pattern that stocked the market
which preventing the market to move any one direction now it trying to break the strong resistant lable
B. after the break of this rectangle it will boost the market potential for break
C. also its resisting from a strong neckline the neckline also got weeker ald the price is ready to break in the outer region
all of these reason are indicating the same thing its
XAGUSD SHOWING A GOOD DOWN MOVE WITH 1:10 RISK REWARDXAGUSD SHOWING A GOOD DOWN MOVE WITH 1:10 RISK REWARD
DUE TO THESE REASON
A. its following a rectangle pattern that stocked the market
which preventing the market to move any one direction now it trying to break the strong resistant lable
B. after the break of this rectangle it will boost the market potential for break
C. also its resisting from a strong neckline the neckline also got weeker ald the price is ready to break in the outer region
all of these reason are indicating the same thing
XAGUSD/SILVER 4H BUY PROJECTION 06.09.24In this latest upward cycle of the silver market, Fed interest rate moves are playing an oversized role in pumping up silver prices. In early July, as analysts factored in the rising potential for interest rate cuts in the remainder of 2024, silver prices were once again testing May's nearly 12-year high.
XAGUSD - This pullback is an opportunity!Silver was following an upward move with gold and stayed strong until there came some dollar strength-ness, last week gold sold off heavily and thus pushing silver lower towards 29.2 levels, this bearishness may vanish with coming days, as global tension rise due to war situation, and risk off assets like gold and silver may show bullish moves again, if you want to buy silver, consider for a strict stop-loss.
Important- This is my own view and not financial advice, trading is highly risky, do ca