XAUUSD – consolidating within range, awaiting breakout momentumGold is currently receiving strong support from news that the PBOC has been buying gold for nine consecutive months , bringing reserves close to 74 million troy ounces . This is a strategic move aimed at strengthening financial security and r educing reliance on the US dollar , which has created a positive sentiment in the market.
On the H4 chart, XAUUSD remains range-bound between 3,344 and 3,408 , with strong rebounds from the lower support zone. The price structure suggests that selling pressure is weakening , while buying momentum is building a base.
The preferred scenario is that the price will continue consolidating in a narrow range , then retest 3,344 before rising toward the 3,408 resistance and potentially higher if a breakout occurs. As long as support holds firm , the mild uptrend is likely to continue.
Xauusd(w)

XAUUSD Gold Trading Strategy August 8, 2025XAUUSD Gold Trading Strategy August 8, 2025:
Gold prices have approached the 340x area and have fallen sharply to the 338x support area at the beginning of today's trading session.
Basic news: President Trump announced to double tariffs on Indian goods to 50% in response to continued oil imports from Russia. Reports show that Trump may meet with Russian President Vladimir Putin as early as next week.
Technical analysis: Gold prices are currently in an uptrend channel, but the trading range is showing signs of narrowing. The possibility that the price will correct at this 340x area is very high; if the gold price creates a double peak pattern in the H1 frame, the price range of 3375 - 3380 will confirm the pattern and create a strong downward force for the gold price. If gold forms a double top pattern here, this correction could take gold to the 3350 or even 3330 area.
Important price zones today: 3375 - 3380, 3405 - 3410 and 3420 - 3425.
Today's trading trend: SELL.
Recommended orders:
Plan 1: SELL XAUUSD zone 3407 - 3409
SL 3412
TP 3404 - 3394 - 3374 - 3354.
Plan 2: SELL XAUUSD zone 3423 - 3425
SL 3428
TP 3420 - 3410 - 3390 - 3370.
Plan 3: BUY XAUUSD zone 3375 - 3377
SL 3372
TP 3380 - 3390 - 3400.
Wish you a safe, successful and profitable trading weekend.🌟🌟🌟🌟🌟

Elliott Wave Analysis – XAUUSD August 8, 2025📊
🔍 Momentum
• D1 Timeframe: Daily momentum is currently turning down, limiting the potential for a long-term rally in the current bullish wave. This also suggests that the top may already have formed around the 3,409 level.
• H4 Timeframe: Momentum is still declining and needs about one more H4 candle to reverse upward. For now, the downward move is likely to continue, so caution is advised.
• H1 Timeframe: Showing early signs of a short-term bearish reversal. This decline is important and will be analyzed further after the wave structure review.
🌀 Wave Structure
The current price action suggests a potential Ending Diagonal formation. Once completed, this pattern is typically followed by a sharp and sudden drop.
So far, no sharp decline has occurred, meaning the ending diagonal may not be finished yet. The ideal completion zones for Wave 5 are around 3412 or 3419.
Ending diagonals tend to develop in a complex manner, so a safer approach is to enter trades after price breaks below the lower boundary of the diagonal.
👉 Additional Scenario: If H1 momentum reverses downward and price breaks below 3381, it is likely to drop toward 3371. This area could be considered for a Buy setup.
Conversely, if price does not break below 3381 and instead rises toward 3412, it may indicate that Wave 5 is completing at that level.
📈 Trading Plan
• SELL Zone 1: 3412 – 3414
o SL: 3417
o TP1: 3393
o TP2: 3372
• SELL Zone 2: 3419 – 3421
o SL: 3429
o TP1: 3395
o TP2: 3372

Hedging Position for XAUUSD-GoldResistance seems to be acting up at $3395-98 level. A hedging position could be opened at $3393 with SL of 5 points-$3398 with TP1 at $3368 and TP2 at $3339. Entry invalid if stoploss hits.

XAUUSD – Gold stays hot, bullish trend still intactGold continues to be in the spotlight as a combination of macroeconomic factors and technical structure supports further upside momentum.
Market Overview:
- Analysts have revised gold price forecasts upward to the $3,500–$3,600/oz range, driven by a weaker USD and concerns over slowing US growth.
- Labour market data from the US is showing weakness, with rising jobless claims – increasing expectations that the Fed may cut rates in September.
- Geopolitical tensions and global trade uncertainties are boosting gold's appeal as a safe haven asset.
- Strong investor interest: Trading volumes in gold futures have risen significantly, indicating heavy participation from big money.
Technical Analysis:
- Price is clearly moving within an ascending channel, reflecting a stable medium-term uptrend.
- Gold is currently testing the short-term resistance around $3,408 , with potential for a minor correction toward support near $3,350 , which aligns with the lower boundary of the channel.
- As long as price remains inside the ascending channel, the bullish bias remains valid.
Trading Strategy
Look for long entries near the $3,350 support zone on a pullback.
Short-term target: $3,408 – Mid-term target: $3,500+
Stop-loss: Below $3,320
In summary , gold is receiving strong support from both fundamentals and technicals. Buying the dips remains the preferred strategy in the current setup.

XAUUSD : Is the Dream Run Finally coming to a halt(Temporarily!)Here is the 4H time frame of Gold in USD (XAUUSD). The red trendline marks an important RBS(Resistance Becomes Support) where gold recently took support at 3293.5 on 9th June.
Now, if on a closing basis (4H) it manages to give a decisive close below the green trendline marked in the chart, we are looking at a steady medium term decline towards the levels marked from T1 to T4.
The biggest trigger for this move to begin and sustain would be easing of global uncertain sentiments like war and tariffs showing some signs of cooling off.
If we are lucky we and get to T4, we are looking at roughly a 16% decline from current market prices which would be a GREAT entry point for some long term positional longs in this yellow beast!

07/08/2025 XAUUSD GOLD ANALYSIS Hello xauusd gold analysis price given a good move in morning (Asian session) opening now price taking resistance to 3384 level my view now if price comes 3370 and making bullish candles we plan for buy no selling plan till price break 3360 level

Elliott Wave Analysis – XAUUSD | August 7, 2025📊
________________________________________
🔍 Momentum Analysis:
• D1 Timeframe: Daily momentum is turning bearish, signaling that a medium-term downtrend may have already started and could last until mid-next week.
• H4 Timeframe: Momentum is rising, but the slope of the two momentum lines is relatively flat → indicating weak bullish strength. We should closely watch the overhead resistance zones.
• H1 Timeframe: Momentum has entered the overbought zone → a short-term reversal is likely, especially near the 3386 level.
________________________________________
🌀 Elliott Wave Structure:
• Based on the bearish momentum shift on the D1 chart, we expect the market is entering an ABC corrective pattern (in green).
• Currently:
o Wave A is completed.
o Wave B is in progress.
• Since Wave A appears to be a 3-wave structure, Wave B may unfold as a flat correction. In that case, potential target zones for Wave B are:
o 3385
o or 3395 → these are the key resistance levels to monitor.
• Within Wave B (green), we observe an internal 3-wave ABC structure (in red), where:
o Wave C (red) may reach:
3386
or extend toward 3395
→ In alignment with the D1 momentum signal, 3386 is considered a potential entry point for a short position.
________________________________________
📈 Trade Plan:
• SELL Zone: 3386 – 3389
• Stop Loss: 3397
• Take Profits:
o TP1: 3370
o TP2: 3353
o TP3: 3333

Gold Explodes: Will the Uptrend Continue?News Background:
Recent weak U.S. job data has fueled expectations that the Fed will cut interest rates in September, weakening the USD and bond yields, making gold more attractive. Additionally, trade tensions between the U.S. and India have increased uncertainty, driving capital flows into gold.
Technical Chart:
Resistance: 3,450 USD is a key resistance level. If broken, the price could continue to rise towards 3,500 USD.
Support: 3,360 USD is the nearest support level. A drop below this could lead to a pullback to 3,320 USD.
RSI: Currently at 64.11, close to overbought territory, but not yet too high, suggesting the uptrend could still continue.
Outlook:
Bullish scenario: If 3,450 USD is broken, the price could reach 3,500 USD.
Bearish scenario: If 3,360 USD cannot hold, a pullback to 3,320 USD is possible.

Elliott Wave Analysis – XAUUSD August 6, 2025📊
________________________________________
🔍 Momentum Analysis
• D1 Timeframe:
Daily momentum is showing signs of a potential bearish reversal. However, we need to wait for today’s candle to close to confirm the signal. While waiting for confirmation, price may still experience a minor upward move on lower timeframes, but the current bullish momentum is weak and unlikely to extend far.
• H4 Timeframe:
Momentum is also preparing to reverse. We need to observe the current H4 candle for confirmation. Notably, the reversal signal is forming just below the overbought zone, suggesting there may be one more upward push before a potential decline.
• H1 Timeframe:
Momentum is approaching the oversold zone. It may take 1–2 more bearish candles before a short-term bullish rebound occurs.
________________________________________
🌀 Elliott Wave Structure Update
Yesterday’s bullish move was disappointing — instead of pushing directly to the 3402 or 3419 target zones to complete Wave 5, price only broke slightly above 3385 before reversing. This behavior complicates wave analysis by introducing conflicting possibilities.
We currently consider two main scenarios:
Scenario 1: Wave 5 is not yet complete
• Given that D1 momentum is preparing to reverse downward, it’s unlikely that the current move is Wave 1 of Wave 5. A more likely scenario is that Wave 3 of Wave 5 has completed and price is currently in Wave 4.
• The current corrective structure has stopped at the 0.382 Fibonacci level. As long as price remains above 3370 (the 0.5 Fib level), this strengthens the case for a Wave 4 retracement before another leg up in Wave 5.
• Since bullish strength appears limited, we now focus on two main target zones for Wave 5: 3395 and 3402, instead of the previous high at 3419.
Scenario 2: Full 5-wave structure is complete – now in correction
• If the 5-wave pattern has already finished, the current decline marks the beginning of a corrective phase.
• With current momentum conditions, this is still a viable scenario. However, due to the remaining upside possibility, we recommend waiting for today’s D1 candle to confirm momentum before taking any trade.
________________________________________
📌 Trade Plan
For experienced traders:
• Wait for price to reach the 3395–3402 zones.
• Look for reversal signals in those areas to enter short positions.
Suggested trade plan for newer traders:
• Sell Zone: 3395 – 3398
• Stop Loss: 3408
• Take Profits:
o TP1: 3385
o TP2: 3370
o TP3: 3349
________________________________________
✅ Note:
This trade plan should be reassessed after today’s D1 candle closes for confirmation of the momentum shift.

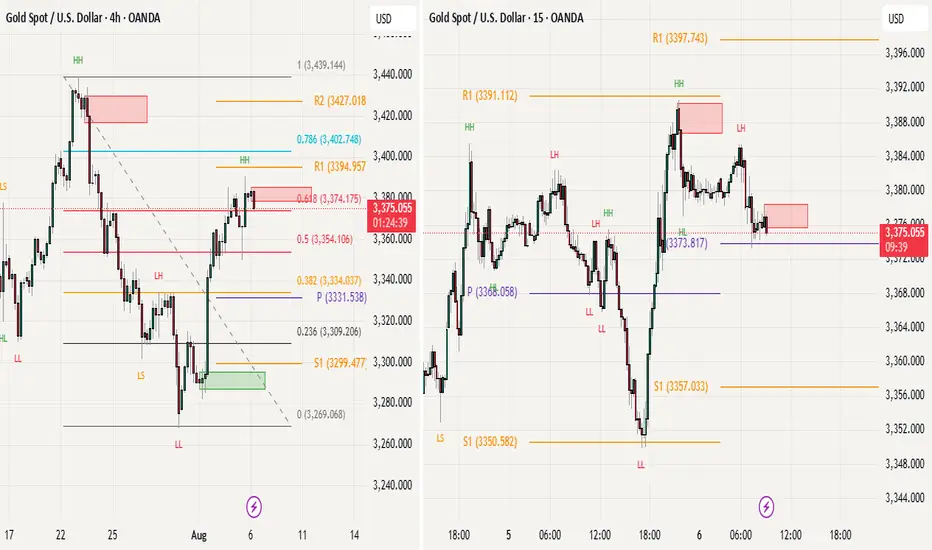
Gold Shows Strength Above Key Fibonacci LevelLooking at the broader time frame, gold has successfully maintained the upward momentum it gained on Friday, with bulls managing to sustain these higher levels. Additionally, the market has broken out aove tbhe important Fibonacci golden zone at the 60% retracement level of 3374, which is a significant bullish sign.
On the lower time frame analysis, we can observe that the 3350 level (Previos day S1) is acting as strong support for gold . Today's pivot is showing an ascending formation pattern, which is clearly visible on the 15-minute time frame chart. The intraday support level for today is at 3357.
From an overall perspective, the larger time frame structure continues to look positive and bullish and currently seems like in consolidation phase. However, if gold manages to print a high low (3335-40 will be good) on the H4 time frame, this would provide an even stronger confirmation signal for the ongoing bullish trend. The combination of sustained momentum, Fibonacci breakout, and ascending pivot formation suggests that gold remains in a favorable position for continued upward movement, provided key support levels hold.
Is gold back on track?Gold is making a strong recovery from the 3,365 USD support zone and is now hovering around 3,380 USD. After a brief correction, the price has bounced back and is heading toward the key resistance area at 3,396 USD. A breakout above this level would likely open the door for a further move toward the 3,428 USD target.
The bullish sentiment is supported by weaker-than-expected U.S. employment data, which has raised expectations that the Federal Reserve (Fed) may cut interest rates sooner. This is boosting demand for gold as a safe-haven asset.
The short-term trend now leans bullish, as long as the price holds above the 3,365 support. A confirmed breakout above 3,396 could be the signal for the next leg higher.

XAU/USDA precise and well-timed entry in XAU/USD was executed at 3381, aligning with a short-term bullish momentum. This buy trade was based on a minor pullback to an intraday support zone, where price action showed signs of reversal through bullish candlestick patterns and a bounce from a key support level. The stop-loss was placed at 3377, just below the immediate support and recent minor low, providing a tight risk buffer while protecting the position from unexpected downside movement.
The target was set at 3389, aiming for a quick profit within the nearest resistance zone. This trade setup offered a favorable risk-reward ratio of 1:2, making it attractive for intraday traders. Indicators like RSI and MACD confirmed bullish divergence, further supporting the long entry.
By combining technical confluence, price action signals, and strict risk management, this entry at 3381 represented a disciplined and strategic trade in the fast-moving XAU/USD market.

Elliott Wave Analysis – XAUUSD, August 5, 2025📊
________________________________________
🔍 Momentum Analysis:
• D1 Timeframe:
Momentum has entered the overbought zone. As anticipated in previous plans, we've seen four consecutive bullish days, and the current overbought condition signals that bullish momentum is weakening.
• H4 Timeframe:
Momentum is reversing downward → We expect a potential pullback today, at least until the US session.
• H1 Timeframe:
Momentum is also turning down → This supports the possibility of a short-term pullback on the H1 chart.
________________________________________
🌀 Wave Structure Analysis:
Currently, there are two key scenarios to consider:
✅ Scenario 1 – ABC Correction Structure (black labels):
• If this is a C wave completing an ABC correction, the current bullish move is likely over.
• In this case, price may break below the 3315 support zone, resuming the medium-term bearish trend.
✅ Scenario 2 – Impulse Wave 12345 (black labels):
• If this is wave 5 of a 5-wave impulse, the uptrend may not be complete yet.
• Currently, wave 5 has reached its first target at 3385, however, we must still watch for an extended target around 3402.
• Notably, wave 4 took the form of a triangle. According to Elliott Wave theory, when wave 4 is a triangle, wave 5 typically travels a distance equal to the triangle’s maximum height → This makes 3385 a highly probable peak area.
________________________________________
🧭 Trade Plan (Reference Only):
🔹 Sell Setup #1 – Near Potential Wave 5 Top:
• Sell Zone: 3375 – 3378
• Stop Loss: 3387
• TP1: 3365
• TP2: 3344
• TP3: 3333
🔹 Sell Setup #2 – In Case of Extended Wave 5:
• Sell Zone: 3400 – 3402
• Stop Loss: 3410
• TP1: 3385
• TP2: 3368
• TP3: 3333

Gold Surges on Weak NFPHello everyone, what’s your take on XAUUSD?
Gold prices soared at the end of the last session and are now trading around $3,380. This sharp rise followed a weaker-than-expected U.S. Non-Farm Payrolls (NFP) report, which shifted market sentiment toward expectations that the Fed may delay interest rate cuts. As a result, the U.S. dollar weakened and demand for gold as a safe haven surged.
Technically, gold appears to be forming a cup and handle pattern, with the first resistance target at $3,400, followed by $3,435.
What do you think? Could this rally continue? Let us know in the comments!

XAUUSD GOLD TRADING STRATEGY August 5, 2025: XAUUSD Gold Trading Strategy August 5, 2025:
Yesterday's trading session, gold prices continued to increase sharply due to previous influences. However, the possibility of a short-term correction in gold prices at the end of the week will be very high.
Basic news: According to CME FEDWatch, the probability of the Fed cutting interest rates at its September meeting has now increased to about 84%, reflecting increasing concerns about economic weakness. The market is currently pricing in at least two 25 basis point cuts between now and the end of the year, showing a clear shift in investor sentiment after disappointing employment data.
Technical analysis: Gold's bullish momentum is currently showing signs of weakening. The peak area of 3383 - 3385 may create a double peak pattern on H1, but the possibility of gold prices correcting today is very low. Currently, gold prices are filling liquidity at support areas. The correction of gold prices may take place at the end of the week when buyers take profits.
Important price zones today: 3350 - 3355 and 3330 - 3335.
Today's trading trend: BUY.
Recommended orders:
Plan 1: BUY XAUUSD zone 3350 - 3352
SL 3347
TP 3355 - 3365 - 3375 - 3400.
Plan 2: BUY XAUUSD zone 3330 - 3332
SL 3327
TP 3335 - 3345 - 3365 - 3400.
Plan 3: SELL XAUUSD zone 3420 - 3422
SL 3425
TP 3417 - 3407 - 3387 - 3357 - OPEN (small volume).
Wish you a safe, successful and profitable trading day.🌟🌟🌟🌟🌟

XAUUSD awaits breakout at confluence zoneGold is consolidating around 3,361 USD after a strong rebound from the key support zone at 3,284 USD — previously a major swing low in the existing bullish structure. Recent price action on the H4 timeframe is forming a potential Cup and Handle pattern, indicating that buying pressure remains present after each retracement.
The 3,351 USD resistance area now acts as a confluence zone, where the descending trendline from July intersects with a key horizontal level. Price behavior at this zone will likely determine the next directional move. A successful breakout would confirm the bullish continuation structure, with room to revisit the previous highs.
Current technical signals suggest that buyers are gradually regaining control, as higher lows emerge and upward momentum builds from the major support area.

XAU/USDThis XAU/USD trade setup is a buy trade, indicating a bullish outlook on gold. The entry price is 3352, the stop-loss is set at 3344, and the exit price is 3375. The trade targets a 23-point profit, while the risk is limited to 8 points, giving a favorable risk-to-reward ratio of nearly 1:3.
Buying at 3352 suggests that the trader expects gold to rise, possibly due to weaker US dollar movement, lower bond yields, or increased safe-haven demand in global markets. The exit price at 3375 is chosen as the profit level, likely near a resistance area where the price may face selling pressure.
The stop-loss at 3344 is placed to protect against any downside move if the trade does not go as expected. Because the stop-loss range is narrow, precise timing and close monitoring of the trade are necessary to avoid being stopped out by short-term market volatility.
With disciplined risk management and adherence to the plan, this setup provides a good opportunity to capture a short-term bullish move. Avoiding emotional decisions and following the strategy strictly increases the chances of consistent trading success in XAU/USD.

Elliott Wave Analysis – XAUUSD, August 3, 2025📊
🔍 Momentum Analysis:
D1 Timeframe: Momentum continues to rise strongly. It's expected that the price will keep rising for at least two more trading days, pushing the momentum indicator into the overbought territory, reinforcing the current bullish trend.
H4 Timeframe: Momentum is showing signs of a potential bearish reversal, indicating a possible corrective pullback during Monday’s trading session.
H1 Timeframe: Momentum is strongly bullish, especially evident from the powerful upward move on Friday. Price may continue rising at the open of the Asian session, potentially creating a Gap. However, caution is advised, as this Gap could signal exhaustion.
📌 Wave Pattern Analysis:
Given Friday's strong price action, the primary scenario currently favors wave 3 within the 5-wave bullish structure (12345 – black). However, we cannot entirely eliminate the possibility that this is wave C within an ABC corrective structure (black).
Presently, the price is forming a smaller 5-wave bullish structure (blue), likely in the final wave 5. Attention should be paid to two critical target zones:
🎯 Blue Wave 5 Targets:
• Target 1: 3368
• Target 2: 3385
⚠️ Next Scenario:
Upon completing the blue 5-wave structure, a corrective move downward will occur.
• If the correction does not break below 3315, the larger 5-wave bullish structure (12345 – black) is confirmed, and the price will continue upward to complete black wave 5.
• If the correction breaks below 3315, the structure shifts to an ABC corrective pattern (black), increasing the likelihood of a deeper decline to complete the larger corrective wave C (red).
🧩 Combining Momentum & Wave Analysis:
• D1 momentum strongly supports the continuation of the bullish trend.
• H4 momentum forecasts a short-term bearish correction on Monday, aligning with the formation of wave 4 correction.
• H1 momentum suggests the possibility of a Gap at Monday's Asian session open, marking the beginning of a corrective pullback as momentum reverses.
🎯 Short-term Trading Plan:
We will trade the current blue wave 5 with the following limit order plan:
✅ Sell Limit Zone: 3385 – 3387
⛔️ Stop Loss (SL): 3399
🎯 Take Profit (TP1): 3368
🎯 Take Profit (TP2): 3355
📌 Note:
The detailed trading plan for capturing the larger wave 4 correction (black) will be updated once sufficient evidence confirms the completion of the blue wave 5.
Happy trading, everyone! 🚀

Gold regains shine after Fed shiftHey traders! Let’s break down what’s been happening with XAUUSD recently.
Last week, gold made a stunning comeback — tumbling first, then surging nearly 800 pips within just a few sessions. This rapid shift was fueled by dovish signals from the Fed and soft US jobs data, which sparked growing expectations of early monetary easing.
At the same time, a global financial survey shows analyst sentiment toward gold at its highest in months. With ongoing global uncertainty, gold is once again in the spotlight as a go-to safe haven.
Despite the rally, volatility remains elevated. The next move will likely depend on upcoming economic data and fresh comments from Fed officials. Meanwhile, holiday trading could mean slower market activity in the short term.
From a technical perspective, gold has broken out of its previous downtrend channel and is moving rapidly. According to Dow Theory, a short pullback may occur — but if price holds above key support, the bullish wave could extend toward the $3,416 level, marked by the 1.618 Fibonacci extension.
This breakout might just be the beginning of a new bullish phase after weeks of sideways action.
What’s your take — is gold gearing up for something bigger?

XAUUSD - Intraday Eyes Short 📌 XAUUSD 45-min — Sell Signal at Supply After Aggressive Impulse Rally
Technical Structure Notes (45m):
🔺 A strong impulsive leg lifted price from sub-3320 zones toward 3360 — completing a breakout from accumulation.
🔴 SELL Signal triggered near prior rejection zone after signs of exhaustion.
🔻 Price is currently reacting to short-term supply, with the red moving average acting as a dynamic decision point.
🟫 Supply zone aligns with previous resistance, suggesting potential rejection unless price reclaims 3362.
📍 If price fails to hold above 3353, a pullback toward 3315–3320 becomes technically plausible.
Disclaimer: This chart is shared strictly for educational purposes and is not financial advice. Always perform your own analysis and manage risk before taking any trading decisions.

XAUUSD – Gold accelerates: Is the 3,600 target within reach?Gold has made an impressive rally of nearly 720 pips, surging from the recent bottom near 3,260 up to 3,365, following a deeply disappointing U.S. jobs report. Non-Farm Payrolls came in at just 106K, far below expectations, while the unemployment rate climbed to 4.2% — a clear sign that the U.S. economy is slowing down. In this context, the expectation that the Fed will pause rate hikes has become more solid, paving the way for gold to break higher.
Technical analysis on the D1 timeframe shows that XAUUSD remains in a well-established ascending channel that has persisted since late 2024. The recent bounce from the 3,260 support zone was strong, with yesterday's bullish candle confirming that buyers are regaining control.
As long as price holds above the 3,260 support area, the next target lies at the psychological resistance around 3,500, and beyond that — the ambitious 3,600 mark.

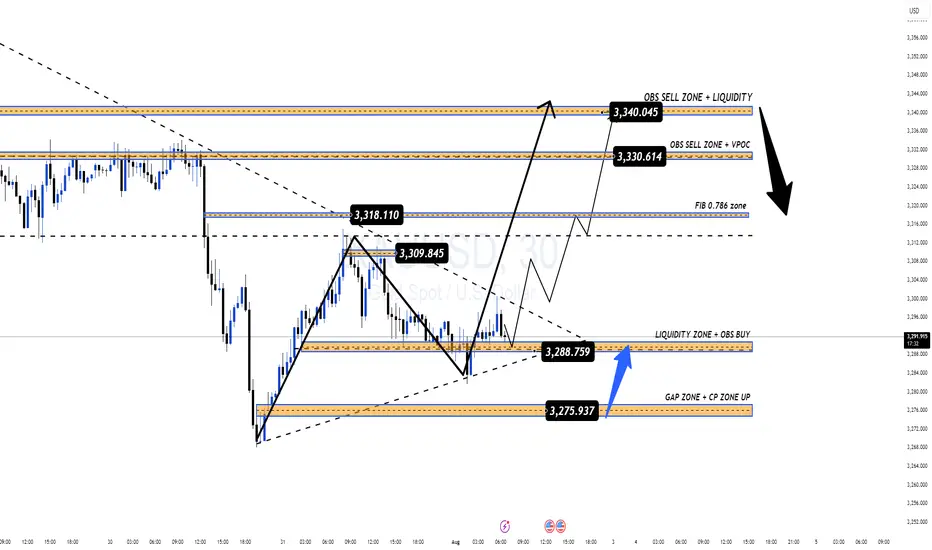
GOLD NFP Plan – Waiting for Breakout & Riding the Bullish Wave – GOLD NFP Plan – Waiting for Breakout & Riding the Bullish Wave
Gold is currently trading inside a large sideways triangle pattern, with price compressing toward the apex. However, based on recent candle structure and yesterday’s reaction at the key level, there’s strong momentum building for bullish continuation—likely forming a Wave 3 breakout if price can decisively break above the current descending trendline.
🔎 Technical Breakdown:
✅ BUY ZONE: 3276 – 3274 (confluence of CP ZONE + GAP + OBS BUY from yesterday)
📈 Price already reacted with +160 PIPS profit from this zone, confirming buyer control
⛓️ Descending trendline is compressing price – a breakout above it could unleash strong bullish momentum
🔄 SELL ZONE: 3339 – 3341 marked by OBS SELL ZONE + liquidity layer
📰 Fundamental Focus:
Today is Nonfarm Payrolls (NFP) day. With current forecasts pointing toward weaker-than-expected U.S. job data, the dollar could face pressure—creating the perfect scenario for gold to spike higher on BUY-side FOMO.
📌 Trade Plan:
🎯 BUY ZONE: 3276 – 3274
❌ Stop Loss: 3270
🎯 Take Profits:
3280 – 3284 – 3290 – 3294 – 3300 – 3305 – 3310 – 3320 – 3330 – 3340 – 3350
⚠️ SELL ZONE (counter-trend): 3339 – 3341
❌ Stop Loss: 3345
🎯 Take Profits:
3335 – 3330 – 3325 – 3320 – 3315 – 3310 – 3305 – 3300
📌 Key Notes:
Favor BUY setups in line with the trend—focus on reaction zones outlined on the chart.
If NFP data is bearish for the dollar, wait for strong confluences before entering any SELL, and avoid shorting prematurely against bullish momentum.