XAU/USD Bullish Setup – OB Zone to $3,590 TargetChart Overview (XAU/USD – 30m):
Current price: $3,534
Price is in a strong bullish channel (higher highs & higher lows).
Market forming an ATH (All-Time High) and consolidating.
📌 Strategies Applied:
1. Trendline Strategy:
Price respecting support & rejection lines inside ascending channel.
Trend remains bullish as long as price holds above support.
2. Order Block (OB) Zone:
Identified buying zone at $3,501 – $3,514.
Strong support + liquidity area → possible rebound point.
3. Moving Averages (EMA):
EMA 70 (3,508) and EMA 200 (3,464) both acting as dynamic support.
EMA alignment confirms bullish momentum.
4. Risk–Reward Setup:
Entry near OB Zone: $3,501 – $3,514
Stop-loss: below $3,500
Target: $3,590 (R:R ~ 1:3).
✅ Summary:
Gold is in a strong bullish trend 🚀. The OB Buying Zone aligns with EMA support, offering a low-risk long entry. As long as $3,500 holds, price likely pushes towards the target zone $3,589 – $3,590.
Xauusd(w)

XAUUSD (GOLD) NEXT TARGET PRICE $4000 OR $2755 XAUUSD (GOLD) NEXT TARGET PRICE $4000 OR $2755 THE Real Commodity King Neal Bhai Forecast.

Elliott Wave Analysis XAUUSD – 03/09/2025
Momentum
• D1: Momentum is still overlapping. As mentioned in the previous plan, with 6 consecutive daily candles in this condition, a reversal may occur today or tomorrow.
• H4: Momentum is preparing to turn bearish. If a confirming candle closes, we may see a downward move on H4.
• H1: Momentum is also turning bearish but right above the oversold zone. This suggests the correction on H1 may be near completion, followed by another upward move.
________________________________________
Wave Structure
• D1: Price is still in an uptrend, possibly wave 1 of wave 5 or the final larger wave 5. Current wave targets are 3602 or 3667. This aligns with momentum on D1, which has been overlapping for 6 candles, signaling that in 1–2 more candles a reversal is likely.
• H4: A 5-wave purple structure is forming – the dominant structure of the current rally. Price is currently running in wave iii (purple).
o Inside wave iii purple, a 5-wave green structure has already formed and is nearing its final stage.
o Wave iii and iv green appear completed, and price is now in wave v green, which has broken the previous high of wave iii green, confirming its development.
• H1:
o The first target of wave v green was hit at 3542. The second target remains at 3585.
o Within wave v green, a 5-wave black sub-structure is visible.
o The Asian session opened with a breakout above the previous high, implying 2 scenarios:
1. Wave 5 black has completed after reaching the first target (3542).
2. Or it is forming a wave 4 black flat, holding above 3525 before heading to 3570–3585.
If price drops below 3525, it means wave 5 black has completed. Then, wave iv purple will target the zones 3498 and 3469 – areas to look for the next buy opportunity.
________________________________________
Trading Plan
• Buy Zone 1: 3500 – 3498
o SL: 3400
o TP1: 3524
• Buy Zone 2: 3471 – 3469
o SL: 3459
o TP1: 3500

Gold on Fire – Will XAUUSD Keep Breaking Higher?Gold (XAUUSD) is showing unstoppable momentum this month. With the US Dollar Index (DXY) weakening and markets expecting the Federal Reserve to cut interest rates, investor sentiment is shifting away from holding cash. For Indian traders, this means one thing: Gold is the ultimate safe-haven play right now.
🔎 Macro View
FED rate cut expectations → Pressure on USD → Bullish for Gold.
Risk sentiment: Investors worldwide are running to gold for safety.
With strong global inflows, gold could continue to make new all-time highs (ATHs) in the coming months.
📊 Technical Outlook (H1/H4)
Gold has been forming sideway accumulation zones followed by strong breakouts. This shows volume and market flow still favor bulls.
BUY ZONE:
3482 – 3480
SL: 3474
TP: 3486 – 3490 – 3495 – 3500 – 3505 – 3510 – 3520 – 3530 – 3540 – ???
SELL ZONE (only for short-term counter-trade):
3540 – 3542
SL: 3548
TP: 3530 – 3520 – 3510 – 3500 – ???
At the moment, there are no strong signals for selling. Trend bias = BUY on dips until we see sentiment reversal.
⚠️ Risk Note
The market is highly volatile right now with sudden liquidity sweeps. Always stick to TP/SL discipline to protect your account.
💡 Conclusion:
Gold remains in a powerful bullish trend, supported by both macro and technical factors. For Indian traders, the best strategy is to stay aligned with the bulls — buy dips and ride the wave.
✅ Follow MMFLOW TRADING for daily market plans and gold insights. Let’s capture this historic rally together!

Elliott Wave Analysis – XAUUSD 2/9/2025
Momentum
• D1: Momentum is still overbought and has been “sticking together” for about 5 consecutive daily candles. Usually, this amount of candles is enough for a potential reversal. This suggests that price may rise for only 1–2 more D1 candles before a daily reversal occurs.
• H4: Momentum is currently turning upward, which indicates that today the market is likely to continue higher for at least 2 more H4 candles.
• H1: Momentum is turning down. This implies that before H4 can continue its upward move, H1 may first produce a short corrective pullback and then resume the uptrend in line with H4.
——————————————-
Wave Structure
• D1: Price is still within wave 5 after completing a correction. Since D1 momentum has already stayed overbought for 5 candles, a multi-day correction may soon develop. This correction will clarify whether the current move is wave 1 of a larger wave 5, or if the larger wave 5 has already finished.
• H4: Price is completing the 5-wave structure (1-2-3-4-5 in red). Breaking above the wave 3 high confirmed that wave 5 in red is unfolding. With momentum on H4 turning up, the upward progress of wave 5 in red is expected to continue.
• H1: Within the 5-wave red structure, we can currently count 9 waves, where the upward waves are nearly equal in length. This reflects an extended wave iii (green). Counting 9 waves also hints that wave iii green is near its end, which implies wave 5 red may also be approaching completion.
Drawing an Elliott channel from wave 2 to wave 4 (red) and extending it over the top of wave 3 shows that wave 5 red is nearing the upper boundary of the channel. This supports the expectation that wave 5 red is close to finishing.
On a smaller scale, the current short-term decline in H1 looks like wave 4 of wave 5 red. The target zones for wave 4 have already been marked on the chart.
—————————————
Principle & Plan
• We do not enter against wave iii, especially in the case of an extended wave iii.
• Wait for wave iv to complete in order to look for buying opportunities into wave v (green).
—————————————
Wave iv targets:
• 23.6% retracement of wave iii: 3479.3
• 38.2% retracement of wave iii: 3459.7
Wave 5 target:
• Projected at 3577.6 (the farthest TP).
—————————————
Trading Plan
• Buy Zone 1: 3481 – 3478
o SL: 3470
o TP1: 3521
• Buy Zone 2: 3461 – 3459
o SL: 3450
o TP1: 3521

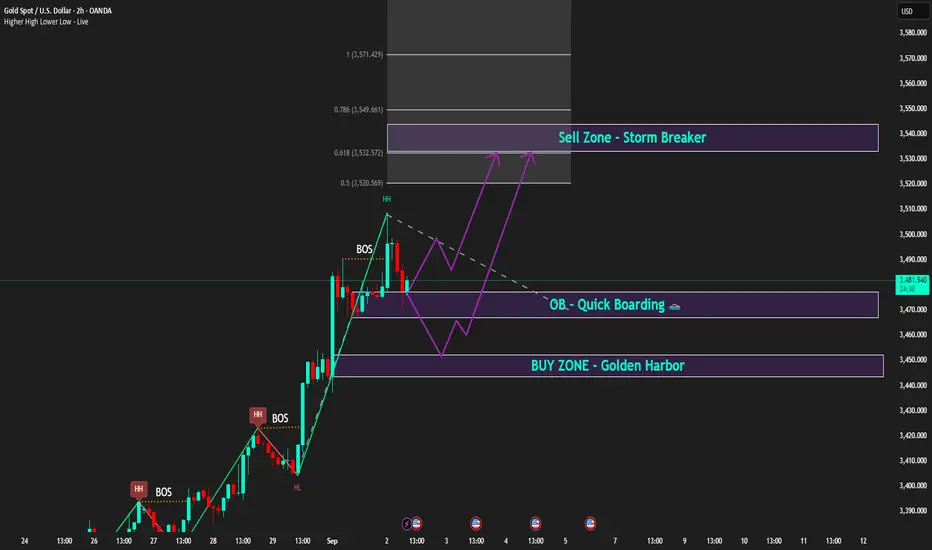
Bullish trend intact, waiting for PMI to spark the next waveCaptain Vincent – Gold Plan XAU/USD
1. Market Waves 🌍
The USD continues to weaken as investors grow more confident that the FED will cut rates in the coming months. With the greenback losing appeal, large flows are leaving cash and moving into safe-haven assets → gold stands out as the number one choice .
👉 This supports gold’s sustainable bullish trend . If USD selling pressure persists, the market could see fresh breakouts into year-end.
2. Technical Outlook ⚙️
H2 Chart: gold just created a Higher High after BOS , confirming bullish dominance.
Golden Harbor 🏝️ (Buy Zone 3,450 – 3,452): aligned with previous FVG , heavy liquidity zone.
Quick Boarding 🚤 (OB ~3,470): intermediate support, ideal for quick pullback entries.
Storm Breaker 🌊 (Sell Zone 3,538 – 3,540): resistance at Fibo 0.618 – 0.786 , strong chance of profit-taking if tested.
Intraday bias: Wait for pullback to Buy. Short-term Sell only if price hits Storm Breaker.
3. Captain Vincent’s Map – Key Levels 🪙
Golden Harbor 🏝️ (Buy Zone): 3,450 – 3,452
Quick Boarding 🚤 (OB Support): 3,470
Storm Breaker 🌊 (Sell Zone): 3,538 – 3,540
4. Trade Scenarios 📌
🔺 Golden Harbor 🏝️ (BUY – Priority)
Entry: 3,450 – 3,452
SL: 3,444
TP: 3,455 → 3,458 → 3,462 → 3,465 → 34xx
🔻 Storm Breaker 🌊 (SELL Reaction)
Entry: 3,538 – 3,540
SL: 3,548
TP: 3,535 → 3,532 → 3,529 → 35xx
5. Captain’s Note ⚓
“The gold sail is still filled with bullish wind, but Storm Breaker 🌊 above may create counter waves. Stay patient at Golden Harbor 🏝️ for precise entries, and watch the PMI at 21:00 – the catalyst for the next wave.”
All-Time High Achieved: Can Gold Hold Above 3500?Gold has successfully tested the 3500 level, printing a fresh all-time high, and momentum remains strong. However, looking at the H4 chart, price action appears slightly stretched, hinting at the possibility of a short-term pullback. A retest toward the previous month’s high / previous week’s high zone (around 3450–3460) cannot be ruled out, and that level will be key to watch for a bullish bounce. As long as gold manages to hold above the 3400 daily close support, any retracement can be seen as a healthy dip-buying opportunity within the broader bullish trend. For now, 3500 stands as immediate resistance, while 3450 is short-term support, and 3400 remains a major level to defend. A sustained daily close above 3500 will open the door for further upside continuation and fresh breakout territory.

XAU/USD Bullish Setup – Buy from POI Zone Towards 3545 TargetXAU/USD (15M Chart) Analysis
Trend Analysis:
Price is in a clear uptrend, supported by higher highs and higher lows above the EMA 70 & EMA 200. Both EMAs are pointing upward, confirming bullish momentum.
POI & FVG Zone:
A POI/FVG buying zone (highlighted in pink) is marked between 3481 – 3491, acting as a strong demand area for re-entry if price retraces.
Chart Pattern:
Price has broken out of a rising wedge formation and is retesting the breakout zone, showing potential continuation to the upside.
Support & Resistance:
Support: 3481 – 3491 zone (FVG & EMA confluence).
Resistance/Target: 3545.608 (major target point).
Entry & Risk Management:
Entry: Buy near 3491 or 3481 (within POI/FVG zone).
Stop Loss: Below 3480 (to protect against false break).
Target: 3545 (approx. +55 points).
Strategy Confirmation:
Trend-following: Bullish continuation above EMAs.
FVG/POI: Perfect re-entry buying zone.
Breakout strategy: Price broke wedge → retest → continuation expected.
Risk-Reward Ratio: Around 1:4, favorable trade setup.
✅ Summary:
XAU/USD remains bullish above EMAs. Ideal trade is to buy the dip at 3481–3491 zone with a target at 3545 and stop loss below 3480. Multiple strategies align for upside continuation.

XAU USD 1 HRS BULLISH CHART Xau USD given a very decent move in last some days from 3383 to 3480 , There is Round number Resistance near 3500 if crossed 3500 with volume or Bullish Candle then Rally can continue. Otherwise there may be some retracement up to 3350-55. Be Cautious & careful. But Still it's bullish . Any Retracement will be Good opportunity.

XAUUSD Trade Idea – Short SetupPair: XAUUSD (Gold/USD)
Type: Sell Setup
Risk/Reward Ratio: 2.7 : 1
🔹 Technical Overview:
Price is moving inside a descending channel, respecting both the upper and lower trendlines.
Recent rejection near the upper channel resistance indicates continuation of bearish pressure.
A short position is taken after price failed to break above the upper boundary.
Volume activity is showing reduced buying momentum, supporting bearish bias.
🔹 Trade Setup:
Entry: 3,473
Stop Loss: 3,477.1 (above channel resistance)
Take Profit: 3,461.4 (near lower channel support)
🔹 Idea Summary:
As long as price remains inside the descending channel, bearish continuation is expected. This setup offers a strong risk-to-reward ratio of 2.7:1, making it favorable for short-term traders.
⚠️ Note: If price breaks above the channel resistance, bearish bias will be invalidated.

XAUUSD Gold Trading Strategy September 1, 2025XAUUSD Gold Trading Strategy September 1, 2025: Gold reversed its decline and surged to its weekly target, boosted by U.S. PCE data and concerns about Fed independence.
Fundamentals: Gold prices reversed course in the U.S. trading session last week, erasing all losses and rising to a new high. After the US Personal Consumption Expenditures (PCE) inflation report largely met expectations, the precious metal traded near $3,454, its highest level since June 16. The weakening dollar supported gold prices, while traders continued to bet on the Federal Reserve's monetary easing measures in September.
Technical analysis: Gold prices, after breaking the 3,420 - 3,425 area, rose sharply to the 3,485 area and are heading towards the old ATH area of 3,500. We will now trade in an uptrend, waiting for a trading point at the combined support zones of MA, Fib and FVG.
Important price zones today: 3,420 - 3,425 and 3,445 - 3,450.
Today's trading trend: BUY.
Recommended orders:
Plan 1: BUY XAUUSD zone 3445 - 3447
SL 3442
TP 3450 - 3460 - 3480 - 3500.
Plan 2: BUY XAUUSD zone 3420 - 3422
SL 3417
TP 3425 - 3435 - 3455 - 3500.
Wish you a new week of safe, effective trading and lots of profit.🌟🌟🌟🌟🌟

Gold consolidates as new alliances emerge | Captain Vincent 1. News Wave 🌍
At the two-day summit in Shanghai, Prime Minister Modi and President Xi Jinping announced that India and China will become development partners rather than competitors.
The meeting also included Russia and four Central Asian nations, aiming to form a Southern Hemisphere bloc to counterbalance the US and the West.
👉 This signals a shift in geopolitical power, heightening concerns of global polarization → Gold continues to hold its safe-haven position.
2. Technical Analysis ⚙️
On the H2 chart, Gold has formed a Higher High after the recent strong breakout.
Storm Breaker 🌊 (Sell Zone 3511 – 3518): Strong resistance, potential for supply if price retests.
Golden Harbor 🏝️ (Buy Zone 3450 – 3448): Confluence with FVG + Fibonacci 0.5/0.618, a key support for pullback entries.
Main Trend: Gold likely to move sideways between 3450 – 3510 before choosing a major direction.
3. Captain Vincent’s Map – Trade Scenarios 🪙
🔻 Storm Breaker 🌊 (SELL Reaction)
Entry: 3511 – 3508
SL: 3518
TP: 3505 → 3500 → 3497 → 349x → 348x
🏝️ Golden Harbor (BUY Zone – Strong Support)
Entry: 3450 – 3448
SL: 3440
TP: 3453 → 3456 → 3459 → 3462 → 346x
4. Captain’s Note ⚓
"Political news continues to stir the golden sea 🌊. Bears are waiting at Storm Breaker 3511, but the safe harbor remains Golden Harbor 3450 – 3448. In such unpredictable waters, prioritise short-term sells to flow with safe-haven demand, rather than recklessly facing the storm."

XAU/USD Ready For Big Dhamaaka - Neal BhaiXAU/USD Ready For Big Dhamaaka, don't miss it. jackpot neal bhai ka.... rok sako to rok lo.

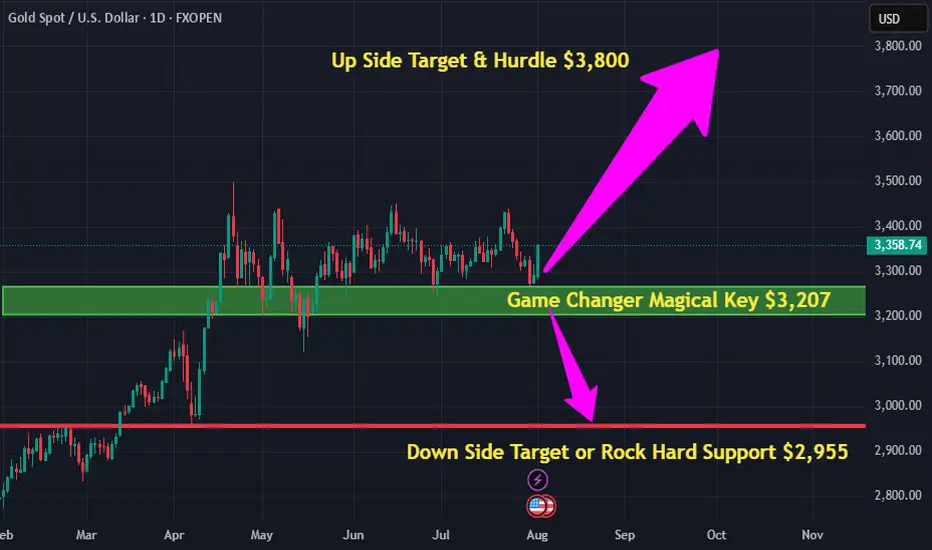
XAU/USD Magical Level for Trading: $400 Up or Down?XAU/USD (Gold) Magic Level for Trading: Can It Move $400 Up or Down till September 2025? - By Neal Bhai, India
Gold 01/09: FVG Retracement – Buy on Dips, Short near 3515SMC Market View – 01 September
Gold is continuing its bullish order flow, with clear BOS and ChoCH signals already confirmed. Price has formed an FVG (Fair Value Gap) near 3463, and is now showing momentum towards the 3515 supply zone.
✅ BUY Setups
Buy Zone 1: 3418 – 3422
Strong demand area with trendline support and liquidity sweep.
Stop Loss: 3410
Targets: 3430 – 3445 – 3455 – 3460+
Buy Scalp Zone: 3352 – 3350
Deeper liquidity grab area, suitable for quick scalps.
Stop Loss: 3344
Targets: 3360 – 3380 – 3400
👉 All buy zones are aligned with the dominant bullish structure. Best approach: wait for retracements to go long.
❌ SELL Setup
Sell Zone: 3515 – 3517
H1 supply area overlapping with resistance.
Stop Loss: 3522
Targets: 3500 – 3485 – 3475 – 3465 – 3450
👉 Short trades here are only meant for quick pullbacks. The bigger bias remains bullish unless a strong bearish ChoCH shows up.
📌 Conclusion
Main bias: Buy on dips at 3415–3422, 3442–3447, and scalp at 3352–3350.
Secondary play: Short at 3515–3520 targeting demand.
Key level: Watch the FVG at 3463 for market reaction.

Will Gold Return to 3400?Market Context
Price has registered multiple bullish break of structure, confirming short-term bullish momentum.
A supply zone around 3449 – 3451 may trigger liquidity-driven reactions.
The fair value gap between 3360 – 3310 is still open and could pull price down before continuation.
Key Levels
Supply Zone: 3449 – 3451
Buy Zone 1: 3396 – 3400 (Stop Loss: 3390)
Buy Zone 2: 3310 – 3315 (Stop Loss: 3303)
FVG Zone: 3360 – 3310
Trading Scenarios
Primary Buy Setup
Entry: 3396 – 3400
Stop Loss: 3390
Target: 3449 – 3460 liquidity sweep
Secondary Buy Setup
Entry: 3310 – 3315
Stop Loss: 3303
Target: 3396 – 3449
Counter-trend Sell
Entry: 3449 – 3451, provided rejection is visible
Stop Loss: above 3458
Target: 3400 demand
Summary
The overall bias stays bullish with two key demand zones in play: 3400 for a shallow retracement and 3310 for a deeper liquidity sweep. Short positions near supply remain valid only as quick counter-trend trades.

Elliott Wave Analysis – XAUUSD (01/09/2025)
Momentum
• D1 timeframe: Momentum has been stuck in the overbought zone for the past 4 days, showing strong buying pressure. However, this also creates noise since extended overbought conditions can reverse at any time.
• H4 timeframe: Momentum is about to turn down in the overbought zone. Once an H4 candle closes with confirmation, we can expect a correction lasting around 4–5 H4 candles.
• H1 timeframe: Momentum is heading into the overbought zone. Within 1–2 more H1 candles, a short-term pullback is likely.
________________________________________
Wave Structure
• D1 timeframe:
Price has risen sharply and steeply, with momentum staying overbought for a long time. This suggests that wave 4 has likely completed, and the market is entering a long-term uptrend. The minimum target is 3684 (equal to the length of wave W).
• H4 timeframe:
Price is currently in red wave 3. We expect a correction into red wave 4, which aligns with H4 momentum preparing to turn down.
• H1 timeframe:
o Wave i (green) is labeled as a leading diagonal, even though wave ii (green) did not retrace as deeply as expected.
o Price is now in an extended wave iii (green).
o Within wave iii (green), a 5-wave structure 1-2-3-4-5 (red) is unfolding. Red wave 3 has already completed with its internal 5-wave (black).
o The target for black wave 5 was achieved at the Fibonacci 0.618 projection of black waves 1–3 → confirming that red wave 3 has completed and price is now correcting into red wave 4.
• Red wave 4 outlook:
Likely to take shape as a zigzag, flat, or triangle. Two retracement zones are identified:
1. 3462 – 23.6% retracement of red wave 3.
2. 3447 – 38.2% retracement of red wave 3.
Considering the guideline that wave 4 often returns to the territory of wave 4 of a smaller degree, and that H4 momentum needs more time to move into the oversold zone, we select 3447 as the primary target for a sell setup.
________________________________________
Trade Plan
• Buy Zone: 3448 – 3446
• Stop Loss: 3438
• Take Profit:
o TP1: 3485
o TP2: 3521

Gold (XAUUSD) Testing Support Before Potential Move HigherAnalysis:
The chart for Gold Spot (XAUUSD) on the 1-hour timeframe shows a strong uptrend within a rising channel, supported by higher lows.
Support Level: Price is currently testing a key support around 3,404–3,405. This level also aligns with the trendline, making it an important zone to hold.
Resistance Zone: The next major resistance lies between 3,430–3,445, where selling pressure could emerge.
Trend Outlook: As long as the support level holds, the bullish momentum remains intact, with potential for price to continue higher toward the resistance zone.
Risk Factor: A breakdown below the support and trendline could weaken the bullish structure and may trigger a pullback toward 3,390.
📈 Bias: Bullish above support, targeting resistance at 3,430–3,445.
📉 Invalidation: Bearish pressure may come into play if price closes below 3,390.

GOLD 29/08: Monthly Candle Closing. DON’T BUY FOMOGold is sitting at a crucial level. As the monthly candle closes, traders must avoid emotional entries. With Smart Money Concepts (SMC) and Elliott Wave Theory, here are the clear trading zones to watch.
🔎 Market Structure (SMC + Elliott)
Elliott Wave: Waves III – IV – V completed. Wave V hit the D1 trendline, showing signs of exhaustion.
SMC Insights:
Multiple BMS (Break of Market Structure) → institutional liquidity play.
EQH (Equal Highs) & EQL (Equal Lows) → liquidity pools ready to be taken.
Demand Zones:
3398 – 3396 (EQH + BMS support)
3372 – 3370 (EQL / deep liquidity sweep)
Resistance: D1 trendline remains the key dynamic cap.
📌 Trading Plan
Scenario 1 – Short-term Sell (Counter-trend):
Entry: 3319 – 3321
SL: 3327
Target: 3398 – 3396
Scenario 2 – Buy at Demand Zone 1 (Main Setup):
Entry: 3398 – 3396
SL: 3390
Target: 3410 – 3415
Scenario 3 – Buy at Demand Zone 2 (Deeper Sweep):
Entry: 3372 – 3370
SL: 3365
Target: 3400 – 3410
✅ Best Risk–Reward setup with liquidity sweep + Elliott retracement.
✅ Conclusion
Bias: Still bullish in the bigger picture.
Risk: Expect liquidity sweeps before continuation.
Advice: Don’t chase price. Wait for demand zone confirmations.
Focus: Safer buys from 3398–3396 or 3372–3370 instead of impulsive FOMO buys near highs.

Gold Awaits Fed Signals: Will 3,350 USD Determine the Next Move?Hi everyone, the gold market is currently at a very sensitive stage. Gold is trading around 3,345 USD, approaching the Fair Value Gap (FVG) between 3,340 – 3,350 USD, and it’s showing signs of consolidation within a narrow range. This phase is highly anticipatory of important news from the Fed and senior officials. So, where will gold head before and after these statements? Let’s break it down.
Gold is currently facing strong resistance at 3,350 USD, a key level that could confirm the next direction. The chart shows that the FVG between 3,340 – 3,350 USD is a region where gold might test again. If it breaks above this level, the chances of continuing the uptrend are very high. On the other hand, if it fails to break 3,350 USD, gold could pull back to test the 3,320 USD support level.
The current trading volume indicates that the bulls are gaining control. However, with significant news soon to be released from the Fed, statements from Jerome Powell and other FOMC members could be decisive factors, especially if there are further signals about potential rate cuts from the Fed. This would weaken the USD and fuel further upside for gold.
Gold Trend Prediction:
If gold breaks 3,350 USD, I expect it to continue rising, with the next target around 3,370 USD. However, if it fails to break this resistance level, gold might adjust back towards 3,320 USD or lower.
Let’s continue to monitor the market and prepare for upcoming trading opportunities!

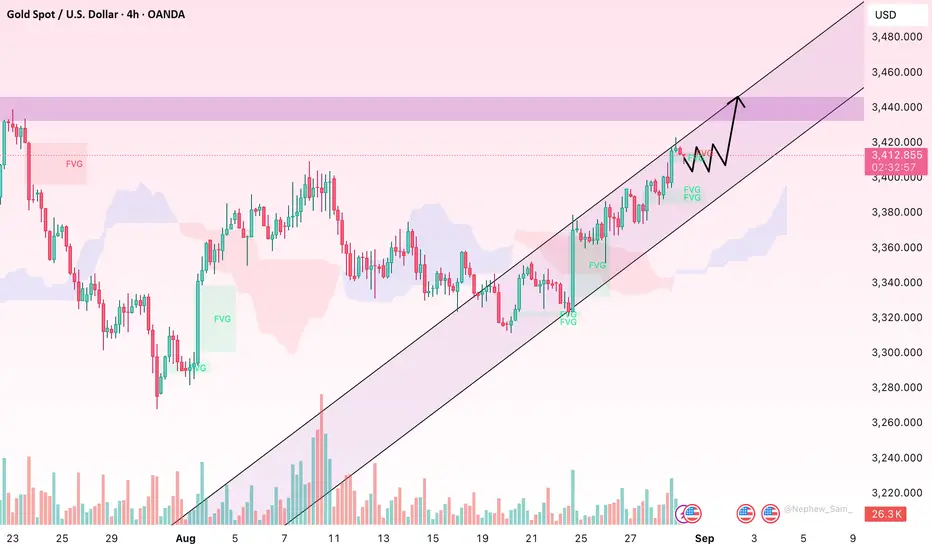
XAU/USD – Gold Targets 3,440 USDHello traders, gold has successfully broken through the key resistance at 3,400 USD and is now approaching the 3,420 USD zone. A decisive move above this level could open the way toward 3,440 USD. On the downside, the 3,375–3,380 USD support range remains effective, helping the bullish structure to hold.
From the macro side, US Q2 GDP grew by 3.3%, beating forecasts and confirming a solid economic recovery. Yet, this also fuels inflation concerns, reinforcing gold’s safe-haven appeal. Additionally, the upcoming PCE data for August is expected to rise, limiting the chances of early Fed rate cuts, which continues to support gold prices.
What’s your view on this setup? Share your thoughts below.
Captain Vincent | Gold holds 3400, breakout or pullback next?” FED turns dovish, Gold challenges a new Storm Breaker
1. News Wave 🌍
FED – Waller: “Tariffs are a kind of tax and do not increase inflation. I’m back with the ‘transitory team’ on inflation.”
👉 A clear dovish hint supporting a 25bps rate cut in September, with potential for 1–2 more cuts in the next 3–6 months.
US Senate: Hearing scheduled on Sept 4th for FED nominee S. Miran → Political–monetary spotlight.
Tonight: Market awaits PCE data, FED’s preferred inflation measure.
➡️ Summary: FED leaning dovish = mid-term bullish for Gold.
But short-term, Gold faces profit-taking pressure near resistance.
2. Technical Outlook ⚙️
On H1, Gold has repeatedly formed bullish BOS and crossed above 3,400.
Golden Harbor 🏝️ (Buy Zone 3375 – 3373): Large volume accumulation, aligned with FVG → Attractive entry if price pulls back.
Storm Breaker 🌊 (Sell Zone 3432 – 343x): At old ATH zone, high probability of supply pressure if tested.
Key Levels:
3,375 → Critical support “anchor”.
3,438 → Resistance target if bullish momentum continues.
3. Captain Vincent’s Map – Trade Scenarios 🪙
🔺 Golden Harbor 🏝️ (BUY Zone – Priority)
Entry: 3375 – 3373
SL: 3365
TP: 3378 → 3381 → 3384 → 3387 → 33xx
🔻 Storm Breaker 🌊 (SELL Zone – Old ATH Reaction)
Entry: 3432 – 343x
SL: 3442
TP: 3428 → 3425 → 3423 → 3420 → 33xx
4. Captain’s Note ⚓
"The Gold ship has sailed past 3400, but Storm Breaker 🌊 at 343x remains a tough challenge. If corrective waves appear, patiently wait at Golden Harbor 🏝️ to board for a more bullish September journey."

XAUUSD SD + OTE Long Trade (Smart Money Logic)This is my recent LONG trade on OANDA:XAUUSD on the 15 min chart.
When everyone was waiting to SHORT , I was waiting patiently in my LONG position.
Entry :
$3378 - Order Block + FVG + 0.5 Optimal Trade Entry level
Exit :
1st Target - $3400 (Standard Deviation Target 1 + 3400 psychological level)
2nd Target - $3418 (Standard Deviation Target 2)
NOTE: Smart Money DOES NOT HUNT stoplosses , they trigger their positions slightly below where they find maximum liquidity, because their positions are WAY TOO HUGE and need all the anti-orders (buy/sell stops) basically buy side or sell side liquidity so that they can fill in their orders. They are literally there to HELP YOU push the price up or down, you just need to place your stoplosses right! not too tight not too far off which may cause market structure shifts. SLs need to be absolutely perfect
Trade Explanation :
OANDA:XAUUSD should have used the 1D Bearish Order Block and we should have seen a fall or at least a decent enough retracement, but only 1 thing saved us, that is 15 min Bullish INDUCMENT and 1H BIAS . I never entered in a short trade!
I hope everyone saw these liquidity pools at the bottom and waited for them to get swept, but yeah, not always will liquidity be hunted right? Pools are areas with the most number of orders + stops. So aren't they supposed to be a good thing? :)
So, yes, DAILY bias is good, but again, LTF bias is also very necessary. Markets won't always respect the DAILY bias. Else, they would always be stuck in a sideways momentum right?
Think about it!
Also, do let me know in the comments what you feel about this trade and also share your analysis!
