Elliott Wave Analysis – XAUUSD 26/08/2025
1. Momentum
• D1 timeframe: Price is currently in the overbought zone. The ongoing bullish cycle has already produced 5 daily candles. Combined with the overbought condition, this suggests that upside momentum is weakening. If no strong breakout occurs within the next 1–2 days, it is likely that the market is still in a larger corrective phase on the daily chart.
• H4 timeframe: Momentum has turned bearish, with strong selling pressure emerging right after wave 2 was considered complete. This is an unusual sign and raises caution for the bullish scenario.
• H1 timeframe: Momentum is also about to turn bearish, which implies an incoming corrective pullback. This is not an encouraging signal at a stage where wave 3 is expected to develop.
2. Wave Structure
• D1: The main scenario still follows the larger corrective triangle. Price is unfolding waves 1–2 (green), and the current bullish leg is expected to be wave 3 (green). However, the strength so far has not been convincing. Having already completed 5 D1 candles without a decisive breakout suggests weakness in the rally.
• H4: The Asian session opened with a strong rally, but this momentum quickly faded and was followed by aggressive selling. Momentum reversed sharply, highlighting abnormal behavior for the expected uptrend.
• H1: At the 3387 level, strong selling pressure appeared, whereas this should have been the breakout zone for wave 3 (black) after surpassing wave 1 (black). Ideally, price should have pushed straight toward 3403 to confirm the impulsive strength of wave 3. This unusual behavior suggests that wave 1 (black) actually completed at 3387, and the market is now in wave 2 (black).
On the lower timeframe (M15), the current decline is forming an ABC structure, with the measured target for wave C at 3364 – a potential buy zone.
If price falls back to 3350 and breaks below, the 1–2–3–4–5 (yellow) count will be invalidated. In that case, the market may be unfolding a larger corrective structure, and the wave count plan will need to be updated.
3. Trading Plan
• Buy Zone: 3365 – 3363
• Stop Loss: 3349
• Take Profit 1: 3387
• Take Profit 2: 3403
⚠️ Note: The stop-loss range is relatively wide, and momentum does not fully support the bullish wave scenario yet. Traders should consider carefully before entering directly.
Xauusd(w)

XAUUSD: Bulls Eyeing a Spark from the 3357 – 3352 Launchpad!We witnessed a strong bullish surge in Gold following Friday's event-driven move. Now, XAUUSD is pulling back toward a key support zone at 3357–3352, where fresh buying interest is likely to emerge. A confirmed bounce from this area could pave the way for a bullish reversal and a push toward higher targets.
🔻 Trade Setup
Entry: Buy at 3357 | Add on dips near 3352
Targets: Refer to marked zones on the chart
Invalidation: Setup becomes invalid on a daily close below 3346
📌 Risk-Reward Outlook
This setup offers a tight downside risk with strong upside potential. Stick to disciplined risk management and adjust your position size accordingly to suit your strategy.
👍 If this idea resonates with your view, drop a like and share your thoughts in the comments — let’s learn and grow together!
Happy Trading,
– The InvestPro Team

Gold's Bullish Run Meets Resistance – Time to Fade the Rally?Gold (XAUUSD) surged strongly after Friday’s event-driven move, but the momentum now appears to be stalling. Price is consolidating in a defined range, and we’re watching a key resistance zone between 3475 – 3488, where fresh sellers may step in to challenge the bulls.
🔻 Short Trade Setup – Fading the Strength
Entry: Sell at 3475
Add on Strength: 3485
Targets: See chart for marked zones
Invalidation: Daily close above 3495
📉 Risk-Reward Outlook
This setup presents a favorable risk-reward ratio, especially for short-term traders aiming to capitalize on a potential rejection at resistance. As always, keep your risk tight and position sizing disciplined.
Gold has had its run — now the odds may favor the contrarian. Keep an eye on momentum and price action at the resistance zone.
👍 If this idea aligns with your view, give it a like and drop your thoughts in the comments — let’s exchange ideas and insights!
🔔 Follow us for more actionable trade setups.
Happy Trading,
– The InvestPro Team

Gold Weekly Plan: Correction or New Rally Ahead? 🇮🇳Gold surprised everyone last week with a strong rally after the Jackson Hole symposium. The weakness in USD gave bulls fresh momentum, and now traders are once again eyeing the possibility of a new ATH in the coming weeks.
But remember — after every big impulse, the market loves to test patience. A short-term correction is possible before the next strong leg up. This is where smart traders prepare, while emotional traders often get trapped.
📊 Technical Outlook (H4 Chart)
Gold is moving inside a tight triangle pattern, signaling that a breakout is close.
Friday’s bullish candle shows the market still favors buyers, but watch out: gold often dips lower before making a major breakout move.
The strategy? Stay disciplined and only enter at confirmed Key Levels.
📌 Key Levels to Watch
Resistance: 3370 – 3383 – 3400 – 3425
Support: 3350 – 3340 – 3326 – 3315
🔥 Trading Plan (MMFlow Strategy)
BUY ZONE 🟢
Entry: 3340 – 3338
SL: 3334
Targets: 3345 – 3350 – 3355 – 3360 – 3370 – 3380 – 3390 – 3400+
SELL ZONE 🔴
Entry: 3400 – 3402
SL: 3407
Targets: 3395 – 3390 – 3385 – 3380 – 3375 – 3370
✨ Question for Indian Traders: Do you think Gold will retest supports first or break 3400 directly? 🚀

Gold SMC Playbook 25/08 – Liquidity Hunt at 3400 & 3325Market Context (SMC Perspective)
Price is consolidating near 3367 after a strong impulsive move upward and is currently reacting around a minor resistance area.
Clear ChoCH and BOS patterns indicate bullish intent on the H1 timeframe; however, liquidity pools still lie below 3343 and 3325 (buy-side liquidity).
Imbalance zones spotted: 3343–3341 and a deeper order block zone around 3325–3323.
Key Levels
Resistance (Supply): 3372 – 3382 – 3389
Support (Demand): 3350 – 3342 – 3325
SMC Bias: Mixed – Opportunities to Play Both Long & Short Around Liquidity
🔴 SELL Scenario (Short-Term Liquidity Grab)
Entry: 3400 – 3403 (above local liquidity sweep)
Stop Loss: 3408
Targets:
TP1: 3390 (partial)
TP2: 3380
TP3: 3370
TP4: 3360 (opens 3350 liquidity zone)
Rationale: Expecting a sweep above 3400 into supply, followed by mitigation and a sell-off.
🟢 BUY Scenario (Bullish Continuation from Demand OB)
Entry 1 (Scalp Buy): 3343 – 3341 (reactive zone), SL 3337
Entry 2 (Main OB): 3325 – 3323 (strong OB), SL 3319
Targets:
TP1: 3330
TP2: 3340
TP3: 3350
TP4: 3370 (opens 3390 liquidity)
Rationale: Price may retrace below 3340 to fill imbalance and mitigate the 3325 OB before the next bullish leg.
Execution Plan (SMC Flow):
Wait for a liquidity sweep at highs or lows (above 3400 or below 3325) with proper confirmation.
Look for ChoCH and BOS signals on LTF (M5–M15) around OB zones for entry confirmation.
Trail stop loss after TP1 is hit; take partial profits and hold the remaining position toward the final liquidity target.

Elliott Wave Analysis – XAUUSD 24/8/2025
Momentum
• D1 timeframe: Momentum is still rising → High probability that price will continue its bullish move on Monday.
• H4 timeframe: Momentum remains bullish → Price is expected to keep rising early in the week to complete wave (3) in yellow.
• H1 timeframe: Momentum is heading into the oversold zone → The short-term correction is nearing its end, we look for buy opportunities.
Wave Structure
• D1 timeframe: Friday’s strong bullish candle reinforces the scenario that wave (1) and (2) in blue are complete, and wave (3) in blue may already be forming. We need price to break above the top of wave (1) in blue to confirm the development of wave (3).
• H4 timeframe: Price rallied sharply and broke above the top of wave (1) in yellow → This confirms price is currently in wave (3) in yellow. With momentum on H4 still rising, wave (3) likely has more room to continue.
• H1 timeframe: The corrective ABC structure has completed, followed by a sharp and steep rally (as projected in Friday’s plan). Price broke above 3350 – the top of wave (1) in yellow → Confirming the scenario that price is in wave (3) in yellow.
o Minimum target for wave (3) in yellow: 3387.
o Principle: Do not counter-trade wave (3); instead, wait for wave (4) correction to look for buy entries in wave (5).
Trading Strategy
With H1 approaching the oversold zone and showing a mild correction, we have two options for entries:
1. Breakout: Wait for price to break above the small descending trendline as shown on the chart → Enter breakout buy.
2. Pullback entry: Wait for price to retrace to the 3362 area → Buy from there.
Trade Plan:
• Buy Zone: 3364 – 3361
• Stop Loss: 3354
• Take Profit:
o TP1: 3378
o TP2: 3387
o TP3: 3403

XAU/USD: Rally Strengthened by News FlowGold remains in a positive stance after the “dovish” signals from the Fed at Jackson Hole, with expectations of a September rate cut gaining traction. As a result, the US Dollar has weakened, providing additional support to XAU/USD.
On the chart, price has rebounded from the 3,313 support zone and is now eyeing the key resistance around 3,405. A decisive break above this level could extend the rally towards 3,440 – an area that has previously attracted heavy selling pressure. On the other hand, any minor pullback would likely be seen as a “buy-the-dip” opportunity within the current uptrend.
With alignment between fundamentals and technicals, XAU/USD is flashing a clear bullish signal, making it favourable for traders to ride the upward momentum.

Technical analysis projection for XAU/USD 25.08.25Chart Overview
Type: Daily candlestick chart of XAU/USD.
Current Price: Around 3,369 USD/oz.
Bias: Bullish (Buy projection).
📊 Key Technical Highlights
Trendline & Pattern
A major ascending triangle pattern is visible.
Price is respecting a major upward trendline (Day Uptrend Line).
Recently, a Double Bullish Engulfing candle formed near the trendline support – a strong bullish reversal signal.
Support & Resistance Levels
Support S1: Around 3,360 – 3,370 (close to current price).
Support S2: Around 3,330 – 3,340 (stronger downside support).
Resistance R1: Around 3,410 – 3,420.
Resistance R2: Around 3,450 – 3,460.
A Flat Resistance Zone exists between 3,400 – 3,420.
Bullish Signals
Bullish Momentum Formed: Price has bounced from support, forming upward momentum.
Major Trendline Obeyed: Price tested the uptrend line and respected it, confirming bullish structure.
Double Bullish Engulfing Pattern: Reinforces buying strength.
🟢 Projection Path (Bullish Scenario)
From the current price (3,369):
Expect a move toward Support S1 confirmation.
Break above Flat Resistance Zone (3,400 – 3,420).
Target Resistance R2 at 3,450 – 3,460.
🔴 Risk (Bearish Scenario)
If price fails to hold Support S1, it may retest Support S2 (~3,340).
A break below 3,330 would invalidate this bullish outlook and may push gold further down.
✅ Summary:
This chart shows a bullish projection for gold with price expected to rise from the current level 3,369 → 3,450, supported by an ascending triangle pattern, bullish engulfing signals, and strong trendline support.

XAUUSD Gold Trading Strategy August 25, 2025XAUUSD Gold Trading Strategy August 25, 2025:
The market revolved around the FED and Trump, gold rose at the end of last week and was limited by the 0.236% Fib level.
Fundamental news: Mr. Powell's unexpectedly dovish remarks reinforced the market's hopes for a rate cut in September. As a result, the US Dollar Index fell sharply on Friday, reversing the upward trend of the first 4 trading days of the week. Moreover, the strong increase on Friday also pushed the gold price to skyrocket nearly 36 USD during the week.
Technical analysis: After a strong increase when it had compressed enough force in the bullish pattern and broke the downtrend channel on the H1 frame, the gold price at the beginning of this week's trading session is having a correction phase. The uptrend of gold is still maintained. The liquidity zones combined with FIB support and MA lines will now be our trading area. The gold price is very likely to return to the old ATH zone of 3500 this week.
Important price zones today: 3345 - 3350 and 3330 - 3335.
Today's trading trend: BUY.
Recommended orders:
Plan 1: BUY XAUUSD zone 3345 - 3347
SL 3342
TP 3350 - 3360 - 3370 - 3390.
Plan 2: BUY XAUUSD zone 3330 - 3332
SL 3327
TP 3335 - 3345 - 3355 - 3390.
Wish you a safe, successful and profitable trading week.🌟🌟🌟🌟🌟

Gold preparing for correction under FED & geopolitic - Vincent🟡 Gold Plan 25/08 – Captain Vincent ⚓
1. Market Context 🌍
Russia – Ukraine: Trump puts pressure on Putin to negotiate within 2 weeks. This looks positive for peace, but also carries escalation risks → Gold keeps its safe-haven role .
FED – Powell at Jackson Hole: Hawkish tone reduced expectations of a September rate cut from 3 to 2. USD strengthened → short-term downside pressure on Gold .
👉 Mix of political support vs FED pressure → Sideways market, Gold may need a pullback to absorb liquidity before showing clear direction.
2. Technical Outlook ⚙️
H4 candle closed bearish → Buying momentum weakens , sellers may return.
Recent FVG created after sharp bounce → Likely pullback for liquidity grab .
Bias of the day: Prioritise Sell, but short Buy Scalp setups possible at support.
3. Key Levels – Captain Vincent’s Map 🪙
Resistance:
Storm Breaker 🌊 (Sell Zone 3398 – 3400)
3376 (intermediate resistance – watch reaction)
Support:
Quick Boarding 🚤 (Buy Scalp 3340 – 3342)
SL: 3333
TP: 3345 → 3349 → 3353 → 3357 → 33xx
Golden Harbor 🏝️ (Buy Zone 3328 – 3326)
SL: 3318
TP: 3332 → 3336 → 3339 → 33xx
Higher Low – 3323
Anchor point of the trend → If broken, need to reassess all Buy setups.
4. Trade Scenarios 📌
🔻 Sell at Storm Breaker 🌊
Entry: 3398 – 3400
SL: 3408
TP: 3395 → 3390 → 3387 → 3384 → 33xx
🚤 Buy Scalp at Quick Boarding
Entry: 3340 – 3342
SL: 3333
TP: 3345 → 3349 → 3353 → 3357 → 33xx
🏝️ Buy at Golden Harbor (3328 – 3326)
SL: 3318
TP: 3332 → 3336 → 3339 → 33xx
5. Captain’s Note ⚓
"Today, the golden sea is full of undercurrents: FED winds blow against, politics push along. Those who pick Storm Breaker 🌊 may ride the wave safely; those who patiently wait at Golden Harbor 🏝️ will find peace. Quick Boarding 🚤 is for sailors seeking fast scalps in narrow waters."

Gold Surges After Fed Remarks: Next Target at $3,370Hello everyone, following Jerome Powell’s speech at the Jackson Hole symposium yesterday, the gold market experienced a sharp rally. Powell hinted at potential rate cuts, weakening the USD and opening a strong opportunity for gold. Currently, gold is trading around $3,345, and if it breaks through the Fair Value Gap between $3,340 – $3,350, the bullish trend will be confirmed, with the next target at $3,370.
Rising trading volumes in recent candles indicate buyers are in control. Meanwhile, Ichimoku cloud signals still confirm an upward momentum as gold prices remain above the cloud, reflecting sustained bullish strength.
With both Fed policy signals and strong technical indicators, gold is likely to extend its rally in the near term. If the price holds above $3,350, reaching $3,370 is just a matter of time.
What’s your view on the current gold trend? Share your thoughts below.

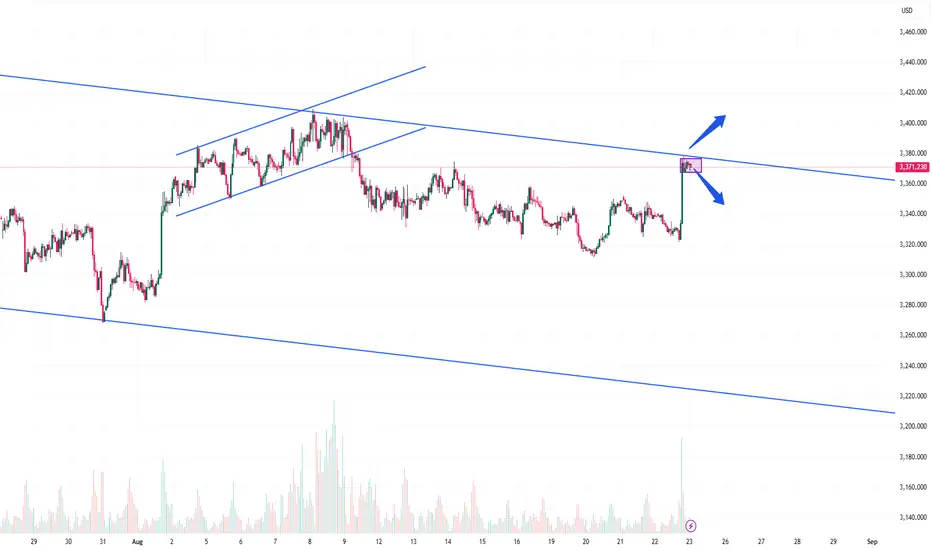
XAUUSD – At Critical Trendline | Breakout vs. RejectionDescription:
Gold has reached a major descending channel resistance where the next move could define short-term direction.
🔹 Market Context:
Price has been respecting the broader descending channel.
Recent sharp rally has brought price into the upper boundary of this structure.
Volume has picked up, showing strong participation at this zone.
🔹 Key Levels to Watch:
Upper Trendline Resistance: Potential breakout zone (monitor for candle closes above with volume).
Immediate Support Zone: Near current consolidation area – holding this level keeps bullish pressure alive.
Mid-Channel Level: Acts as a pivot; rejection could bring price back here as the first downside target.
Lower Channel Support: Remains the major bearish target if rejection extends further.
🔹 Scenarios:
Bullish: A clean breakout above the descending trendline with follow-through momentum could trigger upside continuation.
Bearish: Failure to break higher and rejection from this zone could re-align price back into the channel, targeting mid- and lower boundaries.
👉 This is a high-probability decision point. Confirmation will be key before aligning with either direction.
XAU/USD – Bullish Breakout: Buy Dips Toward $3,409 Target📊 XAU/USD (Gold) – 2H Analysis
Gold has just broken out of its descending channel, showing a clear change of character (CHOH) around the $3,348–$3,358 support zone. This breakout suggests bullish momentum is taking control after weeks of compression.
Key Observations:
✅ Support Zone: $3,348–$3,358 is now a strong demand zone (previous rejection area flipped to support).
✅ Moving Averages: Price is above both the EMA 70 ($3,342) and EMA 200 ($3,346), strengthening the bullish bias.
✅ Projection: A potential continuation rally toward $3,409 (major liquidity target).
⚠️ Risk: If the support zone fails, price could re-test $3,334 or even $3,326.
Trading Plan (Short-Term):
Entry (Buy): Around $3,358–$3,348 (support retest).
Stop Loss: Below $3,342 (under EMAs).
Target 1: $3,390
Target 2: $3,409
👉 In summary: Gold is in a bullish reversal phase, and buying dips into the support zone offers the best risk-reward setup.

XAU/USD SD + OTE + Fractal Reversal TradeHey traders!
Here you can see all the trades taken by me in accordance with some major concepts of ICT.
1. OTE - Optimal Trade Entry
2. SD - Standard Deviation
3. Fractal Nature - If you can't find a pattern on the HTF, you'll surely find something on the LTF and vice versa. For example:
- The SELL entry over here, we had an FVG on the 5 min TF , there was no other valid level to short the markets.
- The other BUY Entries were taken on HTFs , and gave us very good targets as well!
Standard Deviations when combined with PD arrays , work like a charm and can be used as targets for LTF trades and reversals for HTF trades.
Hope you learned something today!
Share your analysis as well in the comments!

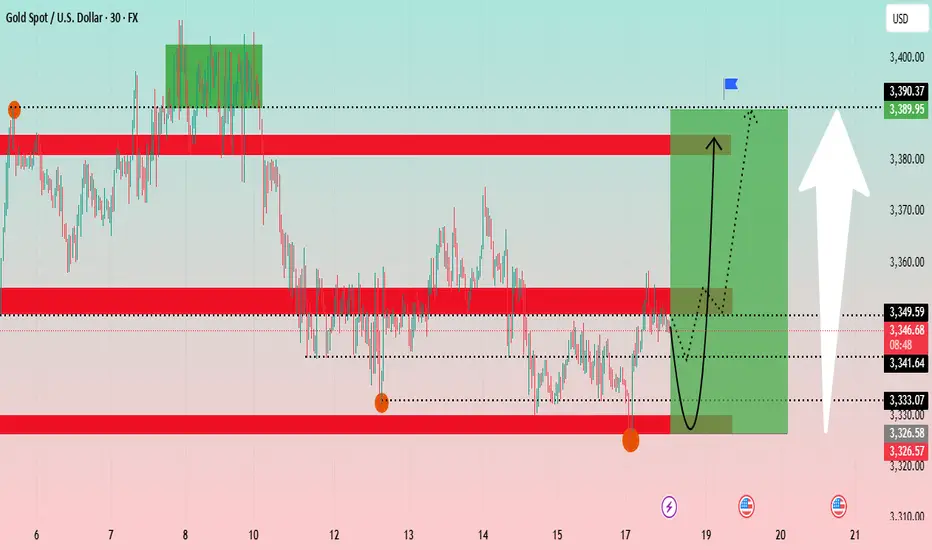
Gold Technical Analysis: Navigating Key Support ?The Gold chart shows a 30-minute timeframe analysis, highlighting recent price consolidation and potential future trends. The analysis suggests a potential V-shape recovery for gold.
Key Levels: The price is currently at a critical juncture, having tested a support zone around 3,326 - 3,333 USD. This zone has proven to be a strong base. Above it, a significant resistance zone is identified between 3,349 - 3,353 USD. Further up, another major resistance is at approximately 3,389 USD.
Price Action: The price has recently experienced a sharp decline and is now in a consolidation phase. The chart projects a potential bounce from the current levels, indicated by the black curved arrow, with the target being the upper resistance zone around 3,389 USD. The green shaded box illustrates the potential upward movement from the current position.
Conclusion: Gold appears to be at a key support level and could be poised for a rally if it successfully breaks above the immediate resistance zone.
Bitcoin (BTC/USDT) 4-Hour Chart Analysis
The Bitcoin chart shows a 4-hour timeframe analysis, focusing on a short-term uptrend channel.
Key Levels: The price is trading within an ascending channel. A significant support zone is identified between 112,000 - 114,000 USDT. A "weak supply zone" is marked around 118,000 USDT, which is currently acting as support. A major resistance is at approximately 124,564 USDT.
Price Action: After a strong push towards the channel's upper boundary, the price has pulled back and is now retesting the "weak supply zone." The blue and red arrows project two possible scenarios: a bounce back up towards the channel's high, or a deeper retracement towards the channel's lower trendline. The price movement appears to be following the blue projected path.
Indicators: The Ichimoku cloud and RSI strategy are used to confirm the trend and identify entry/exit points. The price is above the Ichimoku cloud, indicating a bullish trend.
Conclusion: Bitcoin is at a pivotal point within its uptrend channel. Its ability to hold the 118,000 USDT level will be crucial for a potential re-test of the 124,564 USDT resistance.
Gold: Strong Upside Potential Above $3,350Hello traders,
Looking at the current market setup, gold is hovering near the key resistance zone between $3,340 and $3,350. This area acts as a decisive barrier, and a clear breakout could trigger strong bullish momentum.
Recent price candles with higher trading volumes signal that buyers are becoming more aggressive, suggesting that gold may soon overcome $3,350 and move towards $3,370 or beyond.
On the macro side, expectations of a Federal Reserve rate cut continue to weigh on the US dollar, providing additional support for gold as a safe-haven asset. If the Fed’s meeting minutes or Jerome Powell’s speech at Jackson Hole confirm a dovish stance, it could further fuel the rally.
What’s your view on this move? Do you believe gold can break above $3,350 and extend its rally?
Share your opinion—I’d love to hear your thoughts!

XAUUSD: Downtrend Under Pressure from Strong USDCurrently, XAUUSD is trading around 3,328.400, with resistance at 3,369.000 and support at 3,313.000. The price is forming a downtrend within a price channel, and if it breaks the support at 3,313.000, it could push the price lower towards the 3,300.000 target. The EMA indicators show that the downward momentum continues, and if the price fails to break through the resistance at 3,369.000, the downtrend will remain in place.
Market Context:
Recent news has caused XAUUSD to drop, mainly due to the recovery of the USD after positive economic signals. Higher-than-expected unemployment claims data strengthened the USD, putting downward pressure on XAUUSD.

Gold – Medium-Term Buy StrategyGold – Medium-Term Buy Strategy
Hello traders,
Gold continues to move within wave B under Elliott Wave structure. I expect price to retest the trendline once more, with the strong support around 3325 — which already triggered a sharp bounce yesterday — likely to play a key role before wave C begins.
According to Elliott theory, wave C is often the strongest, and in this case, it could extend towards the 339x region. This offers a swing buy opportunity with a reasonable target of 30–40 dollars.
The MACD also supports this outlook, with volume holding above the average line and the MACD (green) remaining on top.
Key Resistance: 3348–3352, must be broken to open the way towards 339x.
Key Support: 3313, if broken, the scenario shifts and longer-term selling pressure could return.
Buy Zone: Around 3327, with profit potential of 40–60 dollars.
This is my personal outlook for gold this week. I hope it helps you align your trading plan.
What do you think about gold’s direction here? Share your views in the comments below.

Gold (XAUUSD) – Key Support Zone in Play: 3330–3315Gold is currently approaching a critical support zone at 3325–3315, where buying interest is expected to build. A confirmed bounce from this area could trigger a potential bullish reversal and a move toward higher targets.
🔻 Trade Setup
Entry: Buy at 3327 | Add on dips near 3310
Targets: Refer to marked zones on the chart
Invalidation: Setup invalid if price closes below 3304
📌 Risk-Reward Outlook:
Tight downside risk with strong upside potential. Stick to your risk management rules and adjust your position size accordingly.
👍 If this setup resonates with you, give it a like and share your thoughts below. Let’s grow and win together!
Happy Trading,
– The InvestPro Team

XAU/USD Price Action Zones & Trade Setup (Aug 20, 2025)Analysis:
The market recently made a CHoCH (Change of Character), signaling a possible bearish structure.
First Selling Zone (3340 – 3350): Strong resistance area where sellers may push price down.
Second Selling Zone (3350 – 3360): A deeper liquidity grab area for confirmation shorts.
First Buying Area (3308 – 3320): Demand zone where buyers might step in for a short-term bounce.
Second Buying Area (3270 – 3280): Stronger demand, ideal for swing buy opportunities if price dips further.
Price is currently around 3323, hovering near equilibrium, likely to retest selling zones before dropping to buying areas.
📈 Trade Plan:
Sell Entries
🔹 First Short: Around 3340 – 3350 (First Selling Zone).
🔹 Second Short (confirmation): Around 3350 – 3360 (Second Selling Zone).
🎯 Targets:
TP1: 3320 (First Buying Area)
TP2: 3280 (Second Buying Area)
🛑 Stop Loss: Above 3365
Buy Entries
🔹 First Buy: Around 3310 – 3320 (First Buying Area) for a small bounce.
🔹 Second Buy (stronger): Around 3270 – 3280 (Second Buying Area).
🎯 Targets:
TP1: 3340 (back to resistance)
TP2: 3355 (liquidity above first selling zone)
🛑 Stop Loss: Below 3260

XAU/USD: Bearish Bias Ahead of Fed SpeechesHello everyone,
Today the market awaits speeches from Collins, Powell, Hammack, and even the U.S. President. With such anticipation, risk appetite remains cautious and the USD is seeing mild support. In this context, I lean towards a bearish scenario for gold on the daily chart: price is stuck below the dense resistance cluster around 3340–3355 (supply FVG + Ichimoku cloud/volume area), where repeated attempts to push higher have failed.
The sideways–to–downward structure, marked by lower highs since early this month, combined with the latest candle closing under the red FVG zone, signals fading buying momentum. Unless we hear clear dovish tones from the Fed, the 3340–3355 supply zone is likely to continue capping price. My preferred scenario is a pullback to 3315–3305, with an extension to 3295–3285 if USD strength persists. This outlook will be invalidated if we see a daily close above 3350, in which case a move back toward 3370 becomes possible.

Gold Plan 22/08 – Captain Vincent ( IN )Background
On the H1 timeframe , Gold continues to move sideways within the 3328 – 3350 range, sweeping liquidity again and again, making it difficult for retail traders to spot a clear trend.
Currently, Gold has absorbed almost all liquidity from the Nonfarm FVG .
Therefore, the next price action will largely depend on smart money moves and upcoming news catalysts .
Even though the overall trend is still unclear, we can still build trading setups around these key levels .
🪙 Key Levels
🔹 Storm Breaker 🌊 (Sell Zone 3368 – 3370)
SL: 3376
TP: 3365 → 3360 → 3355 → 3350 → 33xx
🔹 Golden Harbor 🏝️ (Buy Zone 3313 – 3315)
SL: 3305
TP: 3320 → 3325 → 3330 → 33xx
📌 Trading Outlook
On higher timeframes, sellers still hold the advantage .
However, Gold may need to test resistance zones again to confirm.
If price reaches Storm Breaker 🌊 → Watch for reaction and prepare to Sell.
If price drops to Golden Harbor 🏝️ → Strong support remains for short-term Buy opportunities.
⚓ Captain Vincent’s Note
"When the sharks sweep the waves, retail traders panic. But those holding the key level map will always know where the safe harbor lies."

XAUUSD – Gold getting ready for a big breakout!Gold is moving exactly as expected: consolidation – breakout – consolidation again. Right now, price is forming a tight triangle pattern, showing strong pressure for the next move.
👉 With both technical setup and global macro headlines creating indecision, the market is waiting for a clear breakout. Once it happens, we can expect a strong trend in either direction.
🔑 Key Levels
Resistance: 3337 – 3343 – 3350 – 3356 – 3365
Support: 3325 – 3320 – 3314
📌 Buy Plan
Buy Zone: 3316 – 3314
SL: 3309
TP: 3320 – 3325 – 3330 – 3335 – 3340 – 3345 – 3350 – 3360 – 3370
📌 Sell Plan
Scalp Sell: 3348 – 3350
SL: 3355
TP: 3344 – 3340 – 3335 – 3330
Sell Zone: 3365 – 3367
SL: 3372
TP: 3360 – 3355 – 3350 – 3345 – 3340
🎯 MMFLOW Note
The tighter the range, the stronger the breakout.
Always prepare for both bullish & bearish scenarios.
Wait for confirmation at the Key Levels before taking positions.
