XAUUSD – Gold under pressure after US retail sales and UoM dataHello traders, today let’s take a look at the XAUUSD chart following the latest news and clear technical signals.
On the H4 timeframe, price is moving within a descending wedge pattern, with multiple rejections at the trendline resistance (red arrows). The 3,346 – 3,373 USD area is acting as the main resistance, while the nearest support is around 3,310 USD. The current market structure leans bearish, with lower highs forming and buying momentum fading.
From a news perspective, Core Retail Sales m/m came in at 0.3% (below the 0.5% forecast), indicating weaker consumer spending. However, UoM Consumer Sentiment rose to 61.9 and inflation expectations surged to 4.5%, leading the market to believe the Fed will keep interest rates higher for longer — strengthening the USD and putting pressure on gold.
If price continues to be rejected around 3,346 – 3,373 USD, XAUUSD is likely to break below 3,310 USD and move toward the deeper support area near 3,285 USD.
A suggested strategy is to prioritize SELL setups if price retests 3,346 – 3,373 USD with strong rejection signals, place stop-loss above 3,380 USD, and target profits around 3,310 and 3,285 USD.
Do you think gold will break 3,310 USD in this move, or will it make one more pullback before heading lower?
Xauusd(w)

XAUUSD – Short-Term Bearish Momentum Strengthens After US DataOANDA:XAUUSD is under clear short-term selling pressure after yesterday’s stronger-than-expected US data. Both PPI and Core PPI for July rose by 0.9% month-on-month, far above the 0.2% forecast, signaling higher producer inflation. At the same time, Initial Jobless Claims fell to 224K, better than the 225K estimate, showing a resilient labor market.
This combination has strengthened expectations that the Fed will stay cautious on rate cuts, boosting the USD and weighing on gold.
Technical picture:
Price has broken out of its previous uptrend and is now moving entirely inside a descending price channel.
The 3,358 USD zone is acting as dynamic resistance, aligned with the upper boundary of the channel and EMA 34/89.
Current structure favors selling on rallies towards resistance, with a target at 3,320 USD – near the recent swing low and lower channel boundary.
If bearish momentum holds, a further drop towards 3,300 USD remains possible in the short term.
Short-term idea: Sell zone 3,355–3,358 USD, stop above 3,365 USD, take profit around 3,320 USD.

Elliott Wave Analysis – XAUUSD – August 15, 2025
1. Momentum
• D1 Timeframe: Momentum is preparing to reverse and the two lines are converging. We need to wait for the daily candle close for confirmation. At this stage, buying pressure is weak, but sudden downward spikes to sweep liquidity are still possible.
• H4 Timeframe: Momentum is rising, suggesting a potential rebound today. If this rebound fails to break above Wave B’s high, another downward move is likely.
• H1 Timeframe: Momentum is turning down, so a short-term drop is possible. If price breaks below 3331 and approaches the lower targets, it will align with H4’s upward momentum, creating the basis for a more stable rally.
2. Wave Structure
• D1 Timeframe: The abcde triangle pattern may have completed. We now have a black 5-wave structure, with Wave 1 formed and price possibly in Wave 2. A break below 3270 would invalidate this 5-wave count.
• H4 Timeframe: The black 12345 5-wave structure appears complete. Price may now be forming a purple ABC correction, with Waves A and B done, and price currently in Wave C. Based on Fibonacci from W12345, Wave C has two potential targets:
o Target 1: 3322 (Fibo 0.618)
o Target 2: 3298 (Fibo 0.782)
• H1 Timeframe: Within Wave C, a black 5-wave structure seems to be developing, and price may now be in Wave 4. Wave 4 has two possible targets: 3343 and 3350, after which price could drop to complete Wave 5.
3. Key resistance zones where Wave 5 may end:
• Target 1: 3322
• Target 2: 3315
• Target 3: 3299
4. Trade Plan
• Scenario 1:
o Buy Zone: 3322 – 3320
o SL: 3312
o TP1: 3332
o TP2: 3357
o TP3: 3381
• Scenario 2:
o Buy Zone: 3300 – 3298
o SL: 3290
o TP1: 3314
o TP2: 3343
o TP3: 3381

Gold Plan 15/08 – Captain VincentBackground
Yesterday, Gold revisited the BUY Scalp – Quick Boarding 🚤 (3332 – 3334) zone and bounced 140 pips.
This is the second consecutive day the zone has shown strong reaction, but today its support strength may weaken.
The main H1 trend is leaning bearish , so the priority is to look for sell setups at major resistance zones.
Zone 1 – Storm Gate 🚪 (Main Sell Zone – SMC Supply)
Entry: 3,355 – 3,357
SL: 3,361
TP: 3,351 → 3,347 → 3,342 → 33xx
Note: SMC Supply zone confluenced with Fibo 0.5 – 0.618. Wait for strong price reaction before entry.
Zone 2 – BUY Scalp – Quick Boarding 🚤
Entry : 3,332 – 3,334
SL: 3,327
TP: 3,336 → 3,339 → 3,342 → 33xx
Note: This zone has reacted twice in a row. Today, only use for quick scalps, avoid holding for long.
Zone 3 – Deep Harbor 🏝️ (Main Buy Zone – SMC Demand)
Entry: 3,290 – 3,292
SL : 3,284
TP: 3,296 → 3,300 → 3,304 → 33xx
Note: Deepest support of the day. Buy only if price drops sharply and clear reversal signals appear.
Today’s Scenarios
If price tests Storm Gate → Look for short-term sells in line with the downtrend.
If price breaks below BUY Scalp → Wait for a retest to sell further, as there’s a high chance of filling the previous Fair Value Gap.
If price reaches Deep Harbor → Attempt a bottom buy, but keep profit expectations short since the overall trend is bearish.
Captain’s Note:
"Today, the golden sea has strong waves and heavy winds. The captain will set sails at Storm Gate to catch the downwind move. Deep Harbor stays open, but will only anchor if the skies are clear. BUY Scalp is like a speedboat – fast, sharp, decisive." 🏴☠️📉
Captain’s Friday Warning ⚠️
"It’s Friday – the wildest day of the week. Trade carefully, manage capital tightly, and protect your treasure chest. The weekend is long; don’t let one impulsive move sink the ship." ⛵💰

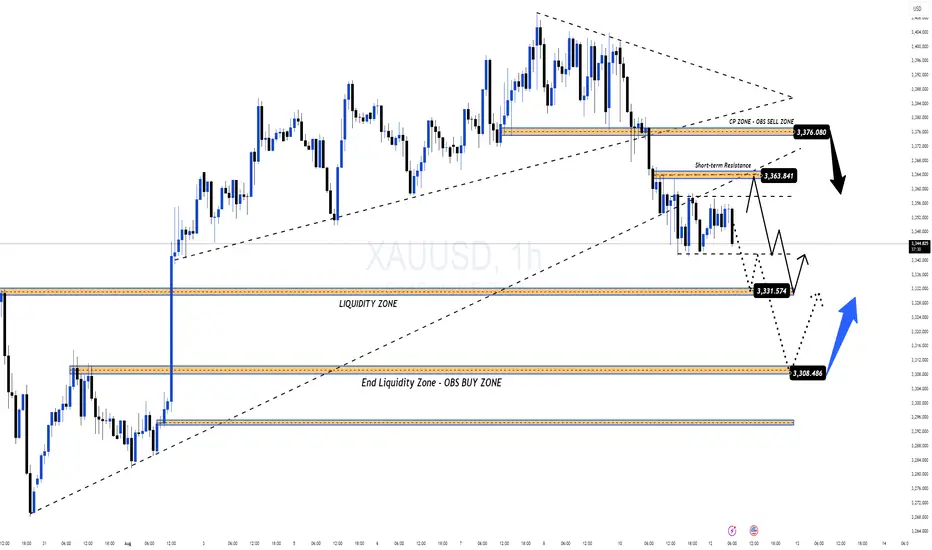
3330 Liquidity Zone – A Fresh Bullish Structure is Emerging!The 3330 liquidity zone continues to prove its strength as gold rebounds sharply from this level, forming a clean new bullish structure on the M30 timeframe. Buyers are now pushing price to trade around 334x, and if this momentum holds, the next upside targets lie at the FIB – CP Zones above 335x and 336x.
On the higher timeframe, the corrective wave is still in play, but short-term price action is opening opportunities for both BUY & SELL setups, provided we time our entries with precision.
Market Context & Key News
Today, the market will be watching the Trump–Putin meeting, which could trigger sharp geopolitical-driven moves.
This Friday also brings the usual liquidity sweep, adding to potential volatility.
That’s why MMFLOW recommends observing the trend closely to pick safe entry points and avoid getting caught in false breaks.
Trading Plan
1. SELL Zones
3355 – Prime OBS SELL ZONE, expecting strong reaction.
3362 – Higher resistance, aligned with the descending trendline. Note: Best to take entries here if reached during Asia or early London; late London/NY session tests are prone to false break traps.
2. BUY Zones
Watch 3334 – 3336 for early BUY entries on lower timeframes.
Safe stop-loss: below 3330.
If 3330 breaks → wait patiently for BUY opportunities around 331x.
Action Strategy
Prioritise early BUYs at 3334–3336 with confirmation signals.
SELL at 3355 or 3362 if clear rejection occurs.
Manage risk strictly – SL below 3330 for BUYs and above 3365 for SELLs.
💡 MMFLOW NOTE: This is gold – volatility can erupt at any moment. Control your emotions, wait for precise setups, and you’ll gain the edge.

Fed Set to Cut 50bps: Gold Gains as the Bullish Wave Forms Again📌 Macro Overview
US Treasury Secretary Bessent gives the green light for a potential 50-basis-point rate cut by the Fed in September.
July CPI remains soft → USD weakens, bond yields fall, boosting gold’s bullish outlook.
Gold briefly touched $3,370/oz, closing at $3,355.9/oz (+0.24%).
Gains capped as US equities continue to break records and geopolitical tensions ease.
Market focus now shifts to PPI data, jobless claims, and the anticipated Trump–Putin meeting for the next directional cues.
🧐 Technical Outlook – MMFLOW Analysis
The bullish recovery wave is clearly re-emerging after a corrective phase, with price hunting liquidity zones left behind in the recent retracement.
Preferred strategy: Trade around key liquidity levels or continuation zones for SELL opportunities; BUY entries will be taken earlier to catch the recovery wave within the current price channel.
Price Structure & Observation Zones:
Short-term uptrend channel intact, primary support at 3336 – 3334 (Liquidity – OBS BUY Zone).
Major resistance at 3394 – 3396 (Liquidity Grab Zone + H1 Supply).
🎯 MMFLOW Trading Plan
🔹 BUY SCALP – Catch the recovery wave
Entry: 3336 – 3334
SL: 3330
TP: 3340 – 3345 – 3350 – 3355 – 3360 – 3365 – 3370 – 3380 – ???
🔹 SELL SCALP – Counter-trend at resistance
Entry: 3394 – 3396
SL: 3400
TP: 3390 – 3385 – 3380 – 3370 – 3360
📊 Key Levels
Resistance: 3365 – 3370 – 3395
Support: 3340 – 3336 – 3330
💡 MMFLOW Strategy Tip:
Wait for price to retest the 3336 – 3334 BUY ZONE for trend-following BUY positions.
Watch for liquidity absorption signals at 339x – a potential SELL reversal zone.
Elliott Wave Analysis – XAUUSD August 14, 2025Elliott Wave Analysis – XAUUSD August 14, 2025
1. Momentum Analysis
• D1 timeframe: Momentum is showing signs of reversal. Although price may not reverse immediately when the two momentum lines converge, this is a clear signal that the current selling pressure is weakening.
• H4 timeframe: Momentum is declining and has only formed 2 H4 candles since the reversal began. It will likely take another 2–3 H4 candles to enter the oversold zone and potentially reverse upward.
• H1 timeframe: Momentum is also falling, suggesting a likely downward move during the Asian session.
________________________________________
2. Wave Structure
• On H1, price is moving in a choppy manner, indicating a corrective phase that has nearly reached its target.
• However, the D1 momentum preparing to reverse upward creates two possible scenarios:
Scenario 1: D1 momentum reverses upward and confirms → The uptrend could last for 4–5 days, conflicting with the current scenario of a corrective wave B. In this case, we would have an alternative scenario of an initial diagonal wave 1 as shown in the right-hand chart.
Scenario 2: D1 momentum enters the oversold zone and stays there → A strong drop would be needed to confirm that the current price action is wave B.
________________________________________
3. Two Potential Price Scenarios
1. WXY corrective pattern → Target for wave Y is around 3381.
2. Initial diagonal wave 1 → Wave 2 could decline toward 3345 before wave 3 rises again. This scenario currently aligns better with the D1 momentum signal.
________________________________________
Conclusion: At present, there is a conflict between momentum signals and wave structure. Further observation is required to determine a clearer trading plan, so no trade recommendation for today.

XAUUSD consolidates, awaiting a reboundFollowing last night’s US PPI data coming in higher than expected (0.2% vs. 0.0%), XAUUSD faced strong selling pressure as markets priced in expectations that the Fed will keep interest rates higher for longer. This boosted the US Dollar and Treasury yields, pushing gold down to around 3,346 USD.
Technically, price is still moving within a wide sideways range between 3,284 and 3,450 USD, but the short-term trend remains capped by a descending trendline from recent highs. The 3,346 USD zone is acting as a trendline touchpoint, potentially leading to a sideways accumulation around 3,312 – 3,346 before a mild rebound.
If the 3,284 USD support holds, the probability of a technical bounce toward 3,346 – 3,379 USD is high, especially as buyers may use the range’s lower boundary to accumulate positions. Conversely, a break below 3,284 USD could trigger stronger selling pressure toward 3,254 USD.

Gold Trading Strategy XAUUSD August 14, 2025Gold Trading Strategy XAUUSD August 14, 2025:
Gold prices continued to rise in the European session on August 13, 2025 as mild US inflation data raised expectations of a Federal Reserve rate cut in September, while a weaker US dollar also boosted demand for gold.
Fundamental news: The US labor market report earlier this month initially weighed on the greenback, but the latest US CPI data added pressure as it did not show a clear acceleration in inflation due to tariffs in July. The inflation data reinforced the possibility that the Fed will take a more dovish stance in September, which is what the market is expecting.
Technical analysis: After a deep correction to the 3330 area, gold prices showed signs of increasing again. On the H1 frame, an upward price channel has been formed, but the current MA lines are still moving sideways, not showing a clear trend. The 3350 - 3355 area will be the important area to decide whether this uptrend channel can hold or not. RSI on H1 and H4 timeframes has entered the buy zone, this is a very good condition for us to trade. We will trade at the support zones and large liquidity zones of gold prices.
Important price zones today: 3350 - 3355, 3335 - 3340.
Today's trading trend: BUY.
Recommended orders:
Plan 1: BUY XAUUSD zone 3350 - 3352
SL 3347
TP 3355 - 3365 - 3375 - 3390.
Plan 2: BUY XAUUSD zone 3335 - 3337
SL 3332
TP 3340 - 3350 - 3370 - 3390.
Plan 3: SELL XAUUSD zone 3388 - 3390
SL 3393
TP 3385 - 3375 - 3365 - 3355 (small volume).
Wish you a safe, successful and profitable trading day.🥰🥰🥰🥰🥰

Gold Plan 14/08 – Captain VincentGold Plan 14/08 – Captain Vincent ⚓
Background
Yesterday, Gold touched the Sell Scalp zone and cruised smoothly for 220 pips 🎯.
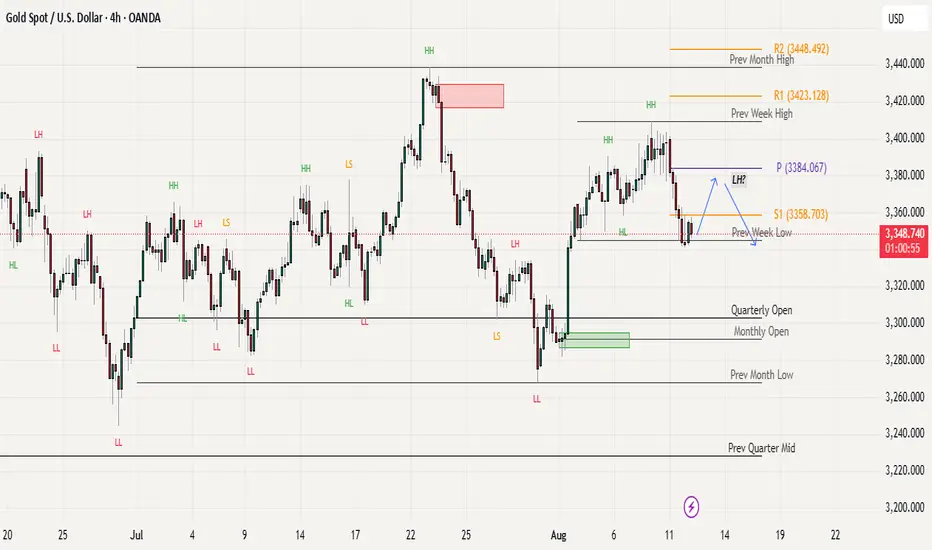
However, it failed to break the previous Buy Zone and is now maintaining a bullish structure on the H1 chart, with higher lows forming.
Today, the market may move slower as traders await the US PPI data , so each entry point must be taken with caution.
Zone 1 – Golden Harbor 🏝️ (Main Buy Zone – SMC Demand)
Entry: 3,334 – 3,332
SL: 3,327
TP: 3,338 → 3,342 → 3,346 → 33xx
Note: This is the main buy zone, aligned with the SMC Demand Zone. Enter only if there’s a clear reversal signal (Pin Bar / Engulfing) on M15/H1.
Zone 2 – Storm Breaker 🌊 (Sell Zone – SMC Supply)
Entry: 3,398 – 3,400
SL: 3,407
TP: 3,394 → 3,390 → 3,386 → 33xx
Note: Strong sell zone. Watch price reaction before entry. Prefer partial profit-taking along the way.
Today’s Scenarios
If price tests Golden Harbor → Wait for pin bar or engulfing, then Buy in line with the uptrend.
If price approaches Storm Breaker → Look for short-term sell setups on reversal signals.
If price stays in the mid-range → Stay on the shore, save energy for the golden moment.
Captain’s Note:
"Today, the golden sea still rides the bullish tide, but the PPI winds may shift without warning. Keep the helm steady, and anchor only at safe harbors." 🏴☠️📈

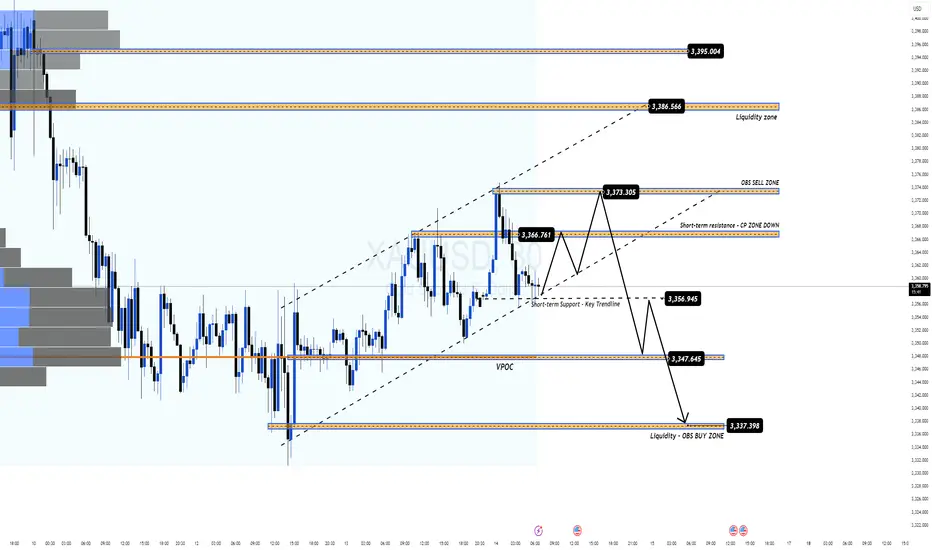
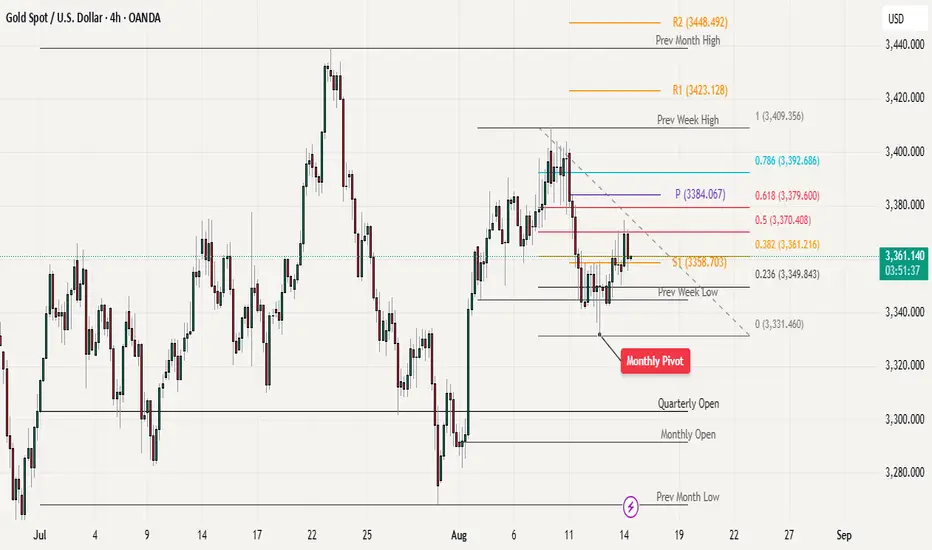
Gold Recovery Stalls at Fibonacci Resistance - Key Levels to WatWe have seen a strong recovery from the monthly pivot point, which acted as solid support. However, the price is now facing significant resistance in the Fibonacci golden zone between 3,370-3,379, based on the recent decline from 3,409 to 3,331. This resistance level presents the main challenge for bulls at this point.
For the bullish momentum to continue, buyers need to push the price above 3,379, which would confirm the upward trend and signal further strength. The positive sign is that gold has been holding steady above the 3,350 level, showing some underlying support at this price point.
Looking at key levels to watch, 3,350 serves as the immediate support level . If this level fails to hold, the next major support comes in at 3,331. A breakdown below these support levels could trigger further selling pressure and lead to additional declines in gold price.
#XAUUSDGOLD start it's correct from 22 April 2025 ,and complete a flat correction on 15 may 2025 , after that the price rise but not able to cross the high of B wave ,so it enter in a complex correction and form a X wave on 16 jun 2025 and make its A wave on 30 june 2025 , and rice to B wave and forming a double flat correction .the price is now in its C wave and expected to come lower to the level of 3200-3100.We can put over SL to the high of B wave.

Elliott Wave Analysis – XAUUSD (August 13, 2025)
1. Momentum
• D1 Timeframe: Momentum is about to enter the oversold zone. By the end of today, it is likely to be fully in oversold territory. This stage often leads to strong price movement – either a sharp decline or a bullish reversal.
• H4 Timeframe: Momentum is preparing to turn upward. We need to wait for the current H4 candle to close for confirmation. If confirmed, a recovery move is likely to occur today.
• H1 Timeframe: Momentum is currently tightening and approaching the overbought zone – a typical sign of sideways price action. This explains why, despite the high probability of a recovery, H1 does not yet provide a good entry signal.
________________________________________
2. Wave Structure
• RSI shows a bullish divergence between price and the indicator – a pattern often seen in wave 3 or wave 5. This supports the view that wave 5 (black) has completed around the 3333 level.
• With a complete 5-wave structure, wave A (red) of the ABC (red) correction may already be in place.
• A recovery in wave B (red) is expected, which aligns with H4 momentum preparing to turn upward. Wave B typically forms a 3-wave corrective structure, where price moves in a choppy, overlapping manner rather than trending strongly.
• Wave B target zones:
1. 3371
2. 3381
These two levels are close to each other, so they can be treated as one combined zone. The plan is to take the first target as the base level while extending the SL to cover the second target. If price approaches these levels, it’s best to watch real-time price action before entering a trade.
• Alternative scenario: If wave 5 (black) is not yet complete, the 3323 zone remains a good Buy opportunity (as per the previous analysis).
________________________________________
3. Trading Plan
Sell Setup:
• Entry Zone: 3371 – 3373
• SL: 3385
• TP1: 3358
• TP2: 3331
• TP3: 3323
Buy Setup:
• Entry Zone: 3323 – 3321
• SL: 3313
• TP1: 3331
• TP2: 3357
• TP3: 3371
2. Wave Structure
• RSI shows a bullish divergence, often seen in wave 3 or 5, suggesting wave 5 (black) may have completed around 3333.
• Wave A (red) of the ABC cycle may be complete; wave B (red) is expected to recover in a 3-wave, choppy pattern.
• Wave B target zone: 3371–3381 (treated as one zone; monitor price action before entry).
• Alternative scenario: If wave 5 (black) is not yet complete, 3323 remains a potential Buy zone.

GOLD SURGES AFTER CPI – TARGETING 337x BEFORE SELL-OFF? MMFLOW TECHNICAL OUTLOOK
📌 Market Overview
Following the CPI release, gold reacted with strong buying momentum (FOMO BUY), pushing prices swiftly from the 333x area up to 335x.
The main driver here is the BUY side taking advantage of remaining liquidity gaps above, aiming to break through the critical 3358 resistance – the first major barrier before reaching 337x, a key equilibrium zone that previously acted as a strong price-holding area for SELL orders.
Current structure indicates:
Short-term trend: Bullish, but approaching key distribution levels.
Liquidity Hunt: A decisive break above 3358 with strong volume could trigger a rapid move towards 337x, activating SELL volume from pending limit orders.
Macro context: No major news events today, with expected daily range ~35–40 points, increasing the chance of range-bound traps before a breakout.
🧐 Technical Outlook – MMFLOW View
Market Structure: Gold has formed a Higher Low around 333x and is now testing short-term resistance.
Key Levels & Liquidity Zones:
Liquidity BUY ZONE at 3338–3336 has reacted well, confirming BUYers are still defending this zone.
Supply Zone / CP Zone at 3375–3377 aligns with an H1 Order Block, holding a high concentration of pending SELL orders.
Volume Flow: Increasing volume as price approaches resistance suggests a potential “last push” before a reversal.
🎯 MMFLOW Trading Plan
🔹 BUY SCALP – Following the main trend
Entry: 3338 – 3336
SL: 3332
TP: 3342 – 3346 – 3350 – 3355 – 3360 – 3370 – 3380
🔹 SELL SCALP – At the distribution zone
Entry: 3375 – 3377
SL: 3382
TP: 3370 – 3365 – 3360 – 3355 – 3350 – 3340
📊 Key Technical Levels
Resistance: 3358 – 3365 – 3376
Support: 3342 – 3337 – 3330 – 3310
💡 MMFLOW Insight: With the current setup, the optimal strategy is to wait for a BUY opportunity near early support (334x) to ride the short-term bullish momentum, then watch for price reaction at 337x to catch potential SELL entries once top-side liquidity is swept.

Gold Trading Strategy XAUUSD August 13, 2025Gold Trading Strategy XAUUSD August 13, 2025:
Gold prices recovered slightly, currently trading around $3,351/oz, positive US inflation data for July has reinforced market expectations that the US Federal Reserve (FED) will cut interest rates in September, while a weaker US dollar has boosted gold's appeal.
Fundamental news: Data from the US Bureau of Labor Statistics showed that the Consumer Price Index (CPI) increased 2.7% year-on-year in July, lower than the expected 2.8% and unchanged from June. Core CPI increased 3.1% year-on-year and 0.3% month-on-month, the largest increase in six months.
Technical analysis: The sideways range of 3,340 - 3,360 has not been broken yet. The MAs are showing signs of moving sideways, showing the tug-of-war between buyers and sellers. RSI H1 has started to move towards the buy zone, RSI H4 is heading towards the average line. There is a high possibility that gold price will have a correction according to RSI of H4 and increase strongly again.
Important price zones today: 3340 - 3345, 3365 - 3370 and 3385 - 3390.
Today's trading trend: SELL.
Recommended orders:
Plan 1: SELL XAUUSD zone 3367 - 3369
SL 3372
TP 3364 - 3355 - 3345.
Plan 2: SELL XAUUSD zone 3387 - 3389
SL 3392
TP 3384 - 3374 - 3364 - 3345.
Plan 3: BUY XAUUSD zone 3340 - 3342
SL 3337
TP 3345 - 3355 - 3365 - 3385 - OPEN.
Wish you a safe, successful and profitable trading day.💗💗💗💗💗

Strong USD, Gold "Holding Its Breath" at Key ResistanceYesterday, gold prices continued to trade within a tight range of 3,340–3,355 USD , reflecting the tug-of-war between buyers and sellers. Selling pressure is still present but not strong enough to break the key support level.
On the news front: Both the U.S. Core PPI m/m and PPI m/m are forecast to rise 0.2% (vs. 0.0% previously), while unemployment claims are expected to dip from 226K to 225K . This signals inflationary pressure from the production side and a resilient labor market , which could prompt the Fed to maintain a tight monetary policy. A stronger USD puts short-term downward pressure on gold.
From the chart: Gold is moving within a sideway range of 3,340 – 3,363 USD after being rejected at the 3,363 USD resistance zone. The price structure shows consolidation with minor technical pullbacks. The 3,312 USD support remains intact; if it holds, buyers may step back in.
Suggested strategy:
Look for buy opportunities around 3,312 – 3,320 USD if support holds, with a target at 3,363 USD. Place stop-loss below 3,305 USD to limit risk.
Question: Do you think gold has enough momentum to break 3,363 USD and start a new bullish leg this week?

Gold Plan 13/08 – Captain VincentGold Plan 13/08 – Captain Vincent ⚓
News Background
📊 Gold is holding steady near $3,350/oz after the US July CPI release.
Headline CPI : 2.7% (below forecast of 2.8%) 📉
Core CPI: 3.1% (up from 2.9%) 📈
➡ This cools down inflation fears from tariffs and increases the probability of a 25 bps Fed rate cut in September , which is bullish for Gold.
Key factors to watch:
💼 Market awaiting more data: PPI, jobless claims, retail sales.
🔍 Tariff drama: Trump says no tariffs, but US Customs just listed 1kg & 100oz gold bars under taxable imports.
🌐 US extends the trade truce with China for another 90 days.
🕊 US–Russia talks on Ukraine scheduled for 15 Aug in Alaska.
News conclusion:
Lower-than-expected CPI + higher Fed cut chances = Gold remains positive.
But tariff and geopolitical risks must be tracked closely.
Yesterday’s Action (12/08)
Gold tapped the Buy Scalp – Quick Boarding 🚤 zone and bounced ~290 pips .
However, it failed to break decisively above the zone and moved sideways around support.
Technical Plan – 13/08
1. Sell Scalp – Quick Boarding Reverse ⚓
Entry: 3,374 – 3,376
SL: 3,382
TP: 3,368 → 3,362 → 3,355 → 3,3xx
Reason: Short-term resistance, suitable for quick sell scalps when price retests higher.
2. Sell Zone – Storm Breaker 🌊
Entry: 3,405 – 3,406
SL: 3,411
TP: 3,395 → 3,385 → 3,375 → 3,365
Reason: Major resistance zone aligned with previous highs and trend channel.
Scenarios:
Price likely to rise from current sideways range to test either Sell Scalp or Storm Breaker.
Priority: Sell if reversal signals (pin bar, engulfing) appear on M15/H1 at these zones.
If price breaks above Storm Breaker and holds above 3,411 → cancel sell plan, wait for new structure.
Captain’s Note:
"The CPI wave has anchored the Gold ship near 3,350. Today, the crew is ready to set sail towards Sell Scalp and Storm Breaker, waiting for the winds to shift for a profitable turn." ⚓🌊

PROACHING LIQUIDITY ZONE – WAITING FOR CPI TO DECIDE NEXT MOVE📌 MARKET RECAP
Gold kicked off the week with a sharp $50 drop, breaking through key trendlines and nearby support zones.
The selling pressure came from:
Profit-taking after the recent strong rally.
USD strength expectations ahead of CPI data (forecast ~0.1% better than the previous reading).
Geopolitical factor: Ukraine–Russia ceasefire talks moving towards a conclusion, fueling risk-off sentiment.
🧐 WHAT’S NEXT?
If CPI beats expectations → USD strengthens → Gold could drop further into the Liquidity Zone 333x – 330x.
If CPI disappoints → USD weakens → Gold may quickly bounce back toward key level 337x (previous breakdown zone) for a retest before deciding direction.
🎯 MMFLOW GAME PLAN
1️⃣ BUY SCALP
📌 Entry: 3331 – 3329
📌 SL: 3325
📌 TP: 3335 – 3340 – 3345 – 3350 – 3360 – 3370 – 3380
2️⃣ BUY ZONE
📌 Entry: 3310 – 3308
📌 SL: 3304
📌 TP: 3314 – 3318 – 3322 – 3326 – 3330 – 3335 – 3340 – 3350 – 3360 – ???
3️⃣ SELL SCALP
📌 Entry: 3363 – 3365
📌 SL: 3370
📌 TP: 3360 – 3356 – 3352 – 3348 – 3344 – 3340
4️⃣ SELL ZONE
📌 Entry: 3376 – 3378
📌 SL: 3382
📌 TP: 3372 – 3368 – 3364 – 3360 – 3355 – 3350 – 3340
⚠️ RISK NOTE
CPI is the market’s dice roll – even a small deviation could trigger massive stop hunts.
Always watch the KeyLevels marked on the chart before entering trades.
Elliott Wave Analysis – XAUUSD August 12, 2025
1. Momentum Analysis
• D1 Timeframe: Momentum is declining → the downtrend remains intact. It may take another 2–3 daily candles for price to reach the oversold zone and potentially reverse.
• H4 Timeframe: Momentum is rising → from now until the U.S. session, price may either retrace upwards or move sideways.
• H1 Timeframe: Momentum is preparing to turn down → a minor pullback could occur in the short term, so this move should be monitored.
________________________________________
2. Elliott Wave Structure
• The green wave structure in the form of an ending diagonal may have been completed. This could mean that Wave 5 or Wave C (black) has formed.
• Personally, I do not want to see the Green 5-Wave Structure end with an ending diagonal at this stage because:
o If this is an impulsive uptrend structure, we are only at Wave 1 of the larger degree.
o An ending diagonal in Wave 5 (black) indicates weak buying pressure, which is not ideal when price hasn’t broken the previous high to confirm a new trend → increasing the probability that this is a corrective wave.
• Looking at the current downward wave structure, I tentatively label it as five black waves 1-2-3-4-5. The current slight rebound is expected to be Wave 4, which could take the form of either a Flat or Triangle.
• Wave 4 targets:
1. 3358
2. 3364
• If price breaks 3381, the current 1-2-3-4-5 bearish count will be invalidated (Wave 4 would overlap Wave 1). In that case, the structure could turn into a corrective ABC or a new 5-wave advance.
• With a Wave 4 target at 3364, the projected Wave 5 target would be 3323.
________________________________________
3. Combining Momentum & Wave Structure
• D1 downtrend → supports the scenario of another drop, forming Wave 5.
• H4 rising + H1 declining → could indicate Wave 4 forming as a triangle, with the key signal being that the current drop does not break 3342.
o If 3342 breaks, Wave 5 may already be in play, targeting 3323.
• Since H4 momentum is still rising, there remains a chance that price breaks above 3381, which would require a full recount—possibly turning into an ABC correction or a 5-wave rally.
________________________________________
4. Trading Plan
• If Wave 4 forms as a triangle → the 3358 area is a good sell zone, or wait for a breakout below 3342.
• Limit Sell Order:
o Entry: 3364 – 3366
o SL: 3374
o TP1: 3342
o TP2: 3333
o TP3: 3323

XAUUSD Drops $55, Bearish Trend Continues!Yesterday, XAUUSD plummeted from $3,398 to $3,342 , losing more than $55 in just one trading session. This sharp decline pushed XAUUSD below a crucial support level , signaling significant weakness .
This drop confirms that gold is under strong selling pressure , with the market struggling to maintain upward momentum .
Additionally, the m/m CPI came in at 0.3% , higher than the expected 0.2% . This indicates inflation is rising faster than anticipated, increasing expectations that the Fed will continue raising interest rates.
This outcome could strengthen the USD , which typically leads to a drop in gold prices. This factor further supports the bearish outlook for XAUUSD.
The price is now approaching a near resistance level at $3,362 , a key point that may limit further upside potential. The near support is located at $3,310, and this will be tested if the price breaks through the resistance at $3,362.
Conclusion: With the combination of strong bearish price action, a stronger USD driven by CPI data, and technical structure supporting the downtrend, XAUUSD appears to be in a strong bearish trend. Risk management should be a priority as the price could test new lows near $3,310, and if this level breaks, the bearish trend could accelerate.

Gold Plan 12/08 – Captain VincentGold Plan 12/08 – Captain Vincent ⚓
Background:
After sliding from the Storm Breaker 🌊, Gold has broken below the 3358 zone and successfully retested it. The ship is now heading straight towards the Buy Scalp – Quick Boarding 🚤 dock.
Today’s Plan: Only buy when price reaches the pre-defined support zones — no chasing in open waters.
Zone 1 – Quick Boarding 🚤 (Buy Scalp)
Entry: 3,333 – 3,331
SL: 3,327
TP: 3,336 → 3,339 → 3,342 → 3,345 → 3,348 → 33xx
Note: Fast in & out. Take partial profits at each TP hit.
Zone 2 – Golden Harbor 🏝️ (Main Buy Zone)
Entry: 3,311 – 3,309
SL: 3,305
TP: 3,315 → 3,319 → 3,323 → 3,327 → 3,331 → 33xx
Note: Main accumulation zone. Hold longer if buying momentum stays strong.
Today’s Scenarios:
If price hits Quick Boarding → Wait for a reversal signal (pin bar, engulfing) on M15/H1 before entering.
If price dips to Golden Harbor → Observe the bounce strength; enter only on clear confirmation.
If neither zone is touched → Stay on the shore; wait for the next voyage.
Captain’s Note:
“The Gold ship has left the 3358 waters, turning its bow towards Quick Boarding 🚤. If docking is smooth, the crew will sail out swiftly to the open seas. Golden Harbor 🏝️ remains the main refuge if stronger waves push deeper.”

Gold Retreats to Range Zone: CPI Data Could Spark Next MoveGold has encountered strong resistance around the 3400 level and pulled back. The price has now re-entered the range zone again.
The technical picture shows gold ltaking support at 3340 support, while the 3400 level continues to act as a concrete resistance barrier above.
Yesterday's correction saw prices close below 3350, which raises some concern about near-term weakness. Today's CPI data release is expected to inject significant volatility into the market. For gold price structure, a pullback would be healthy to establish a lower high pattern as indicated on the chart, particularly if the gold intends to move lower.
On the upside, the weekly pivot at 3384 now is critical level to monitor, followed by the 3400 resistance zone. To the downside, we have to watch the 3330-3335 support area as the next key level that could determine golds immediate direction.
XAUUSD-Gold bearish continuationSince bearish momentum is strong, short positions can be opened.
Entry-$3359
SL-$3363
TP1-$3320
TP2-$3300
4 points SL, 50+ points TP
