XAUUSD – When Buying Pressure FadesGold attempted to break above a key resistance zone but quickly lost momentum, signaling that bullish strength is weakening. Meanwhile, strong U.S. economic data continues to support the dollar: the labor market remains robust and manufacturing activity is expanding — giving the Fed more reason to keep interest rates high for longer. This has put downward pressure on gold.
Currently, the market is approaching a critical support area. If this zone breaks, the bearish trend could accelerate further. Price structure no longer shows clear bullish momentum, and any pullbacks appear to be merely technical corrections.
Given this outlook, I favor a SELL setup if price breaks below support. The downside could expand significantly if buyers fail to return. Gold is now standing on the edge — either it holds the range, or a sharp drop may follow.
Xauusd(w)

Elliott Wave Analysis – XAUUSD July 23, 2025
________________________________________
🔍 Momentum Analysis:
• D1 Timeframe: Daily momentum is showing signs of a potential bearish reversal. We need to wait for today’s daily candle to close to confirm this. It signals that the bullish momentum is weakening.
• H4 Timeframe: Momentum is turning down. It may take around 2 more bearish H4 candles to push momentum into the oversold zone → suggesting continued downside movement today.
• H1 Timeframe: Momentum is already in the oversold zone and the indicators are “clinging” together → implying possible continued minor declines or sideways movement.
________________________________________
🌀 Elliott Wave Structure Update:
• On the H1 chart, a 5-wave structure (yellow) is unfolding.
o Wave 3 (yellow) appears completed, supported by a clear 5-wave internal structure in blue.
o The market is currently in Wave 4 (yellow) – a corrective move.
🔸 Potential Wave 4 (yellow) targets:
• Target zone 1: Around 3412
• Target zone 2: Around 3402
📌 Once Wave 4 (yellow) completes, we anticipate the market will form Wave 5 (yellow).
🔸 Projected Wave 5 (yellow) targets:
• TP1: 3461
• TP2: 3492 (in case of an extension)
________________________________________
🔄 Combining Momentum & Wave Structure:
• The potential bearish reversal in D1 momentum suggests the current bullish trend may be nearing its end – consistent with Wave 5 being the final push before a broader correction.
• H4 and H1 momentum support the ongoing correction in Wave 4.
✅ Wave 4 typically takes the form of a zigzag, flat, or triangle → Wait for a strong bullish H1 candle to confirm the end of Wave 4 and initiate a buy entry.
________________________________________
📊 Trade Plan:
🟩 Buy Zone 1:
• BUY ZONE: 3414 – 3412
• SL: 3407
• TP1: 3439
• TP2: 3461
• TP3: 3492
🟩 Buy Zone 2:
• BUY ZONE: 3403 – 3401
• SL: 3393
• TP1: 3439
• TP2: 3461
• TP3: 3492

XAUUSD – Gold Intraday Market Outlook (22/07)PLan XAUUSD TRADING BY MMFLOW SYSTEM - 22/07
Gold saw a sharp rally yesterday, completing its bullish wave structure for the day. However, as price approached the key psychological resistance around $3400, we started to see signs of exhaustion, with a clear bearish reversal candle forming at the top. This is the first indication of a possible correction in today’s session.
🔍 Technical Analysis
After forming a short-term top, gold is now entering a retracement phase and has tested a major support area – the FVG High Zone on H1 timeframe. If bearish pressure continues and this zone is broken, price may drop further to seek deeper liquidity zones.
🔽 Buy Zones to Watch Today
✅ Zone 1 – EL (End Liquidity within FVG): 3367 – 3350
→ Historically a strong reaction zone – good for short-term bounce entries.
✅ Zone 2 – Confluence of FIBO 0.5 – 0.618 + VPOC (3350 – 3335)
→ Ideal for long-term buy setups, as this zone overlaps key technical signals and previously saw strong buyer interest.
📌 Trade Setup Suggestions
🔸 BUY ZONE: 3351 – 3349
SL: 3344
TP targets: 3355 – 3360 – 3365 – 3370 – 3375 – 3380 – 3390 – 3400 – ???
🔸 BUY SCALP: 3366 – 3364
SL: 3360
TP: 3370 – 3375 – 3380 – 3385 – 3390
🔻 SELL ZONE: 3420 – 3422
SL: 3427
TP: 3415 – 3410 – 3405 – 3400 – 3390 – 3385
⚠️ Risk Reminder
Although there’s no major economic data today, traders should stay cautious. Unexpected volatility could arise from political developments or central bank commentary. In low-news environments, gold tends to consolidate tightly and then break out aggressively.
🔐 Always use Stop Loss and Take Profit to protect your capital – the market can surprise even the most experienced traders.
📈 Trading Strategy
Short-term bias: Favouring a pullback scenario.
Medium to long-term plan: If price drops deeper into key liquidity zones, that could offer excellent opportunities to load up on long positions, anticipating a strong upside move as the market prices in future Fed rate cuts and gold seeks new all-time highs.
💬 Stay focused, trade with confirmation, and always manage your risk. Patience and discipline will separate you from the crowd.

Elliott Wave Analysis – XAUUSD | July 22, 2025
🔍 Momentum Overview
• D1 timeframe: Momentum has entered the overbought zone, signaling a potential reversal within the next 1–2 sessions. That said, the current bullish leg may still extend — it’s important to wait for tomorrow’s D1 candle close for confirmation. Entering overbought territory is a warning that upside momentum is weakening.
• H4 timeframe: Momentum is currently declining. Unless a strong bullish candle closes above 3391 to trigger a reversal, the price is likely to continue moving sideways or downward today.
• H1 timeframe: There are signs of a bullish reversal. If the price holds above 3385 and posts a strong breakout candle above 3391, it could present a short-term buying opportunity.
🌀 Elliott Wave Structure Update
• Price is consolidating within the 3390 – 3402 range — a key zone to monitor closely.
• The 3380 level is a critical threshold, aligned with the 0.382 Fibonacci retracement of Wave (3). A daily close below this level would raise the possibility that the move is part of a correction rather than Wave 4.
• A flat ABC correction is currently unfolding, with the 1.618 extension of Wave A already reached at 3385.
• If price breaks below 3360, it would overlap with the previous Wave 1, invalidating the current impulsive wave count. In that case, we should consider the potential continuation of a larger abcde triangle correction.
🔗 Momentum & Wave Structure Combined
• H1 is showing early signs of a bullish reversal, but H4 momentum remains bearish. Without a strong breakout candle above 3391, price is likely to drift sideways or lower until H4 reaches the oversold zone.
• Conservative approach: Wait for H4 to enter oversold territory before considering any long positions.
• The ideal buy setup would be a bullish reaction from the 3382 – 3380 zone.
📈 Trade Setup
• Buy Zone: 3382 – 3380
• Stop Loss: 3372
• Take Profit 1: 3402
• Take Profit 2: 3412
• Take Profit 3: 3428

Gold surges with explosive breakoutGold prices launched into a powerful rally yesterday, soaring from $3,350 to nearly $3,400 — a stunning $50 move, equivalent to 500 pips.
This surge was supported by a weakening US Dollar and a drop in the 10-year Treasury yield, which fell to its lowest level in over a week. On the macro front, if the Federal Reserve signals an earlier-than-expected rate cut, the bullish momentum could extend further in the long term.
Technical outlook: The H2 chart reveals a strong breakout after gold successfully breached the $3,372 resistance zone ( as highlighted in yesterday’s strategy ). Price is now completing a pullback, which may serve as the base for the next bullish wave.
Do you agree with this view? Share your thoughts and let’s discuss together.
Good luck with your trades! ✨

Gold XAUUSD Trading Strategy on July 22, 2025Gold XAUUSD Trading Strategy on July 22, 2025:
Yesterday's trading session, gold prices rebounded strongly from the 3345 area to the 3402 area after the previous multi-timeframe compression.
Basic news: President Donald Trump's trade stance towards Europe became tougher; Europe plans to develop a retaliation plan.
Technical analysis: After the previous multi-timeframe compression, gold prices rebounded strongly again. The previous resistance zone of 3365 - 3370 has now become a support zone for gold prices. Currently, a strong uptrend is showing in multiple timeframes. However, the RSI on the H1 frame is currently quite overbought, we will wait for a correction to the support zone to trade.
Important price zones today: 3365 - 3370, 3347 - 3352 and 3422 - 3427.
Today's trading trend: BUY.
Recommended orders:
Plan 1: BUY XAUUSD zone 3365 - 3367
SL 3362
TP 3370 - 3380 - 3400 - 3420.
Plan 2: BUY XAUUSD zone 3347 - 3349
SL 3344
TP 3352 - 3362 - 3372 - 3400.
Plan 3: SELL XAUUSD zone 3425 - 3427
SL 3430
TP 3422 - 3412 - 3402 - 3382 (small volume).
Wish you a safe, favorable and profitable trading day.💯💯💯💯💯

XAU/USDChatGPT said:
XAU/USD presents a promising intraday trade setup with a well-defined entry, stop-loss, and exit level. The entry is placed at 3391, targeting an upside move toward 3405, with a protective stop-loss at 3384 to limit downside risk. This setup offers a favorable risk-to-reward ratio, aligning with disciplined trading principles.
Gold remains supported by global uncertainties and a softer dollar, and the price action near 3390 suggests a potential bounce from minor support, confirmed by bullish momentum on lower timeframes. The stop-loss at 3384 is strategically placed below the immediate support zone to avoid getting caught in minor noise, while protecting capital if the trend reverses.
The target at 3405 corresponds with the next resistance zone and a recent swing high, making it a realistic and technically sound exit. Traders should monitor key economic releases during the session, such as US PMI or Fed commentary, as they can trigger volatility in gold.
Stick to the plan: enter at 3391 when price confirms, use the stop-loss at 3384 to cap risk, and exit at 3405 to lock in profits. Avoid chasing moves and ensure proper position sizing to maintain risk discipline on this XAU/USD trade.

XAUUSD – The bullish surge isn't over yetGold just delivered an impressive breakout of nearly 500 pips on July 21, fueled by a weakening USD as U.S. housing and manufacturing data showed signs of slowing down. With a bleaker economic outlook and growing expectations that the Fed may cut interest rates in Q4/2025, investors are flocking back to safe-haven assets – and gold is shining bright.
Technically, XAUUSD remains firmly within a clearly defined ascending channel, with price action bouncing sharply off dynamic support. The metal is currently consolidating around the 3,400 zone – if buyers can hold this ground, the door toward 3,440 and beyond could swing wide open.
As long as gold holds above 3,347, bulls remain in full control. This might just be a healthy pullback before the next leg up – don’t miss out as the market gains momentum!

Gold Price Soars Today Amidst USD WeaknessGold prices surged unexpectedly today, surpassing the 3,350 USD/ounce mark, thanks to the weakening of the USD and falling U.S. Treasury yields. Concerns over U.S. President Donald Trump's unpredictable trade policies have also fueled demand for the precious metal as a safe haven.
Despite gold dipping several times near the 3,300 USD/ounce level in recent days, the support from bargain hunters and the continued demand for gold as a safe investment has helped maintain its high price. If this upward momentum continues, gold may soon break through the next resistance level, with 3,372 USD being the immediate target.

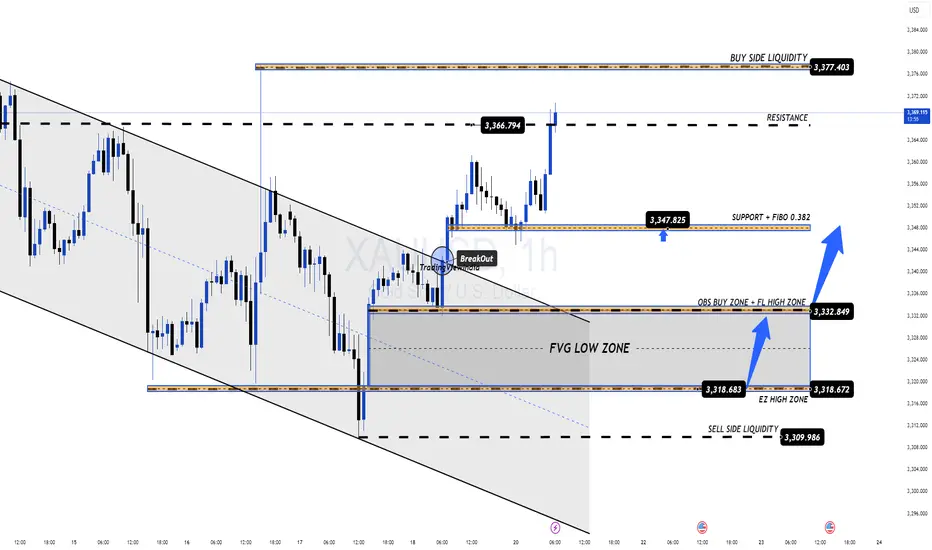
GOLD PLAN 21/07 – START OF THE WEEK FACES STRONG RESISTANCE GOLD PLAN 21/07 – START OF THE WEEK FACES STRONG RESISTANCE – WAIT FOR CONFIRMATION!
Market Overview:
Gold rebounded swiftly after a minor correction late last week, mainly fueled by ongoing geopolitical tensions. While there are no major economic events scheduled this week, macro headlines and global conflicts will likely drive volatility and direction for gold prices in the coming sessions.
Technical Outlook:
Price is quickly approaching a key resistance zone and may retest the Buy Side Liquidity area around 3377 – 3380.
A short-term reaction from sellers is possible, aiming to fill the Fair Value Gaps (FVG) below.
⚠️ Selling at current levels carries higher risk unless clear reversal signals appear. Patience is key!
Trading Plan for Today:
🔹 BUY ZONE: 3331 – 3329
SL: 3325
TP Targets:
3335 – 3340 – 3344 – 3348 – 3352 – 3358 – 3364 – 3370
🔹 SELL ZONE (risky – confirmation needed): 3377 – 3379
SL: 3383
TP Targets:
3372 – 3368 – 3364 – 3360 – 3350
Key Notes:
The 3347 zone currently acts as short-term support for bulls. If this breaks, gold may slide back to fill lower FVG zones.
Watch closely for volume activity during the London session to confirm intraday bias.
Always respect your SL/TP levels to protect your capital, especially early in the week when volatility can spike unpredictably.
💬 Stay patient, trust the structure, and let price come to your zones. Trading is a game of waiting, not chasing!
Good luck, traders!
Elliott Wave Analysis – XAUUSD | July 21, 2025🔍 Momentum Analysis
- D1 Timeframe: Momentum is currently rising → the dominant trend over the next 3 days is likely to remain bullish.
- H4 Timeframe: Momentum is approaching the oversold area → just one more bearish H4 candle could complete the entry into oversold territory.
- H1 Timeframe: Momentum is about to reverse downward → suggesting a short-term corrective pullback in the current session.
🌀 Elliott Wave Structure Update
On the H4 chart, price continues to consolidate within a corrective triangle structure. According to our previous plan, price approached the 3358 zone, and we expect:
- Wave 1 (black) may have completed at the 3358 high.
- Currently, Wave 2 (black) is likely unfolding:
+ Wave A appears to have completed.
+ The current upward leg is part of Wave B.
+ A final drop in Wave C is expected, with two key target zones:
- Target 1: 3342
- Target 2: 3332
🔎 Combining Momentum & Wave Structure
- If price breaks above 3358, we want to see a sharp, impulsive, and steep rally to confirm the beginning of Wave 3.
- If price movement remains choppy or overlapping, the market is likely still in a corrective phase.
- Key resistance zone to monitor: 3390–3402 – a clean breakout above this range would significantly strengthen the Wave 3 scenario.
📌 Trade Plan
1️⃣ BUY Setup #1
Entry Zone: 3343 – 3341
Stop Loss: 3337
Take Profit 1: 3358
Take Profit 2: 3390
2️⃣ BUY Setup #2
Entry Zone: 3333 – 3331
Stop Loss: 3323
Take Profit 1: 3358
Take Profit 2: 3390
📎 Note: Prioritize entries that come with clear confirmation signals from price action and momentum. Avoid buying during choppy or indecisive market conditions.

Gold price increased, broke 3360Plan XAU day: 21 July 2025
Related Information:!!!
Gold prices (XAU/USD) are extending their upward momentum for the second consecutive session on Monday, as buyers remain cautiously optimistic and await a decisive breakout above a multi-week trading range before committing to further gains. The US Dollar (USD) begins the new week on a softer footing amid mixed signals regarding the Federal Reserve’s (Fed) interest rate outlook—an important factor currently supporting the precious metal.
Additionally, persistent concerns over the potential economic consequences of former President Donald Trump’s unpredictable trade policies are bolstering gold’s appeal as a safe-haven asset.
personal opinion:!!!
Short term H1 frame, gold price breaks 3360 forming bullish structure. Uptrend continues to maintain
Important price zone to consider : !!!
resistance zone point: 3377 zone
Sustainable trading to beat the market

XAUUSD – Breakout or Continued Accumulation?Gold continues to respect a solid bullish structure within an ascending price channel. After a healthy pullback from recent highs, the price has retested a key technical support area and is showing signs of a strong rebound.
Current price action reveals that the market is respecting both the FVG zone and the rising support line—clear signals that smart money is still leaning toward the buy side. The next bullish targets lie around the upper resistance zone.
From a macro perspective, weaker-than-expected U.S. retail sales have placed downward pressure on the dollar, fueling speculation that the Fed may soon pivot toward easing. This adds momentum to gold’s upside potential.

Gold Prices Rise Amidst USD WeaknessAmong precious metals, prices are increasing due to the weakening of the USD. There are no negative scenarios for gold in the medium term, considering the current developments: US government spending is out of control, ongoing trade tensions, uncertain inflation, and increasing criticism aimed at the Fed.
As of the time of writing, gold has risen by 0.3% in the past 24 hours, equivalent to an increase of 100 pips, currently trading at 3,350 USD.
The current environment is highly favorable for gold, especially as investors lose confidence in the stability of US monetary policy. If the Fed begins to concede to political pressure, gold prices could break previous highs and head toward 3,440 USD/ounce in the short term.
Do you agree with this view?

XAUUSD: breakout risk is approachingXAUUSD has been consolidating in a tight range since early July. Despite multiple bounces from support, price has failed to deliver a clear breakout, signaling weakening buying pressure. The current structure leans bearish, with momentum turning increasingly negative.
On the news front, the U.S. economy continues to show strong recovery: rising consumer demand, falling unemployment, and surging USD and bond yields. This puts significant pressure on gold – a non-yielding asset in a high-interest environment.
If price breaks below the bottom of the range, the downside could accelerate sharply in the near term. Buyers should remain extremely cautious in this setup.

Gold wavers under pressure from strong U.S. retail dataXAUUSD is currently fluctuating within a price box, showing weaker bullish attempts and failing to break above the nearest resistance zone. Selling pressure is mounting as price continues to be rejected at the top and is approaching the medium-term ascending trendline — a key support level.
On the news front, U.S. core retail sales surged, boosting expectations for a stronger USD, which in turn weighs on gold prices. However, a slight uptick in unemployment claims may help slow the dollar’s momentum.
If buyers fail to defend this critical support, the bullish structure risks being broken, potentially signaling a shift toward a clearer downtrend. On the flip side, the price box could still act as a consolidation phase before another bullish leg.

XAUUSD 1H – Watching for a Bounce Inside the ChannelGold is still moving nicely inside this big ascending channel. After hitting resistance, price is pulling back toward the lower support area and trendline.
👉 My Plan:
Waiting to see if price holds around $3,310–$3,320 zone.
If we get bullish signs (strong candle, rejection wick), I’ll look for longs back up toward $3,350–$3,370 and maybe higher.
✅ Key Levels:
Support: $3,310 area
Resistance: $3,345 – $3,370
Break below support could invalidate this idea.
Just being patient and letting price action confirm the next move. Let’s see how it plays out!

XAUUSD – The Bullish Wave Emerges, Target Closer Than Ever!Gold has broken out of its previous descending channel, confirming a trend reversal. Current price action is forming higher lows while consistently filling Fair Value Gaps (FVGs) – a clear sign that institutional money is flowing back in.
The next key target is the previous high near 3,399, where some short-term profit-taking may occur. However, if buyers can defend the support zone around 3,348, the chances of breaking above resistance will increase significantly.
On the news front, the U.S. dollar is weakening as housing and industrial production data show signs of slowing, fueling speculation that the Fed may pause further rate hikes this year.

EUR/USD: Continuing Downtrend and Key Levels to WatchHello traders, what are your thoughts on EUR/USD?
Today, EUR/USD continues its strong downtrend, currently trading around 1.161. One of the key factors driving this decline is the strong recovery of the USD. Following the release of positive data from the US, especially the unemployment report, the market has reinforced expectations that the Fed will maintain high interest rates for a longer period. This has reduced the appeal of the euro, putting significant pressure on EUR/USD.
From a technical perspective, the price is approaching the trendline's lower limit, and a breakout at this point could push EUR/USD further down. Personally, I expect the EMA 89 area to be an ideal target for this strategy.
What about you, do you agree with my outlook? Feel free to share your thoughts, and let’s discuss!

18/07 Gold Outlook – Final Friday Liquidity Moves Ahead!🟡 Gold Outlook – Final Friday Liquidity Moves Ahead!
Will Gold maintain its bullish pace or face weekend volatility? Stay ahead of the market!Why Gold is Moving – Key Macro Drivers
Gold bounced back sharply after a dip caused by stronger-than-expected US economic data. Here’s what Indian traders need to keep in mind:
📊 Rate cut hopes remain high as US core inflation remains sticky.
💣 Middle East tensions continue, with Israel launching more airstrikes on Syria.
🌐 Trade war risks increase as EU threatens $84B in tariffs on US goods.
🟡 Gold is acting as a safe haven in times of inflation concerns and global uncertainty.
👉 All of these factors support gold’s upside — especially heading into the weekend when low liquidity can cause price swings.
📉 Technical Picture – Zones in Play
Gold reversed from FLZ H2 (3310) — a key liquidity and demand zone. Sellers took profits, triggering a surge in buy volume. The price has since tested the OBS Sell Zone + Continuation Pattern (CP) around 334x with strong resistance.
Today, we expect price to revisit lower liquidity pools on the M30–H2 timeframe before the next breakout.
🧭 Key Levels for Friday – Watch Closely
✅ Buy Zone: 3318 – 3316
SL: 3312
TP Targets: 3322 – 3326 – 3330 – 3335 – 3340 – 3345 – 3350 – 3360
💼 Scalp Buy Zone: 3326 – 3324
SL: 3320
TP: 3330 – 3335 – 3340 – 3345 – 3350 – 3360
⚠️ Sell Zone: 3363 – 3365
SL: 3370
TP: 3360 – 3355 – 3350 – 3346 – 3342 – 3338 – 3335 – 3330
🔔 Important Notes for Indian Traders
Today is Friday, and even though there’s no major economic news, the risk of liquidity sweeps and volatility is high. Protect your capital with solid risk management and stick to your TP/SL strategy.
📌 Plan your entries from strong technical zones and don’t chase price — let the market come to you.

Gold Trading Strategy XAUUSD July 18, 2025
Yesterday's trading session, after a strong correction to the 3310 area, the gold price increased sharply again.
Basic news: FED Governor Christopher Waller supports a 25 basis point interest rate cut later this month. The number of weekly unemployment claims in the US fell to 221,000, lower than the forecast of 233,000 and the previous period's level of 228,000; data shows that the US labor market remains stable, strengthening the economic growth outlook.
Technical analysis: The M30 and H1 time frames have not clearly shown the trend of the gold price, when the tug-of-war between buying and selling is quite large. However, in the H4 and D1 frames, there are signs that the gold price will increase again. If the gold price continues to trade in the 3290 - 3300 area, it shows a new multi-frame compression process. This area is very important as it can be a trading point that brings us great profits.
Important price zones today: 3318 - 3323, 3287 - 3292 and 3352 - 3357.
Today's trading trend: BUY (hold).
Recommended orders:
Plan 1: BUY XAUUSD zone 3318 - 3320
SL 3315
TP 3323 - 3233 - 3343 - 3353.
Plan 2: BUY XAUUSD zone 3288 - 3290
SL 3285
TP 3293 - 3303 - 3320 - 3340 - Open.
Plan 3: SELL XAUUSD zone 3353 - 3355
SL 3358
TP 3350 - 3340 - 3330 - 3310.
Wish you a lucky, safe and profitable weekend trading day.🌟🌟🌟🌟🌟

Elliott Wave Analysis – XAUUSD July 18, 2025
🔍 Momentum Analysis
D1 Timeframe: Momentum is showing signs of a bullish reversal. While we need to wait for today's D1 candle to close for confirmation, it's likely that yesterday’s upward move marks Wave 1, signaling the beginning of a new bullish trend.
H4 Timeframe: Momentum is preparing for a bearish reversal → suggesting a potential corrective pullback, likely forming Wave 2.
H1 Timeframe: Momentum is about to reverse upward → supporting the expectation of a short-term bullish move during the current session.
🌀 Elliott Wave Structure Update
On the H4 chart, the abcde triangle correction structure remains largely unchanged.
However, a strong H4 bullish candle appeared yesterday, indicating unusual market behavior that deserves attention.
There are two main scenarios:
Wave 1 (black) has already completed, and the market is now entering Wave 2 correction.
Alternatively, the current movement could be Wave 4 within Wave 1 (black).
🔎 Combining Momentum & Wave Structure
With D1 momentum signaling a potential uptrend lasting the next 4–5 days, it suggests that Wave e (blue) may have completed.
This opens the door for an impulsive 5-wave advance. Specifically:
If H1 continues its bullish reversal, the current move could be Wave 5 of Wave 1 (black), targeting the 3358 level.
Afterwards, a retracement toward the 3330–3323 zone would form Wave 2 (black).
Alternatively, price might drop directly to 3330–3323, implying Wave 1 has already finished and the current move is Wave 2.
🎯 => Both scenarios converge at the 3330–3323 price zone, making it a high-probability BUY ZONE.
🧭 Trade Plan
BUY ZONE: 3330 – 3327
Stop Loss: 3320
Take Profits:
TP1: 3342
TP2: 3358
TP3: 3402
📌 Note: Since this is a relatively wide entry zone, it's best to wait for price action confirmation at this level before entering.

Gold's Short-Term DeclineHello everyone, what do you think about gold?
Today, gold continues its short-term downtrend. After new data was released at the end of yesterday’s trading session, the USD rose by 0.3%, and U.S. Treasury yields also increased, reducing the appeal of gold. Additionally, the latest unemployment claims data shows improvement in the U.S. economy, which has contributed to the drop in the precious metal.
As of writing, gold is trading around the EMA 34, 89 levels at 3,336 USD. With the recent news, the market is expected to maintain its current stance throughout the day, as no new significant updates are expected.
From a technical standpoint, the downtrend remains in place, with prices continuing to be capped below the trendline. The series of lower highs and lows could likely lead XAUUSD to test lower levels, with the possibility of reaching the 3,300 USD mark.
What do you think about the price of gold today? Let us know in the comments!
