XAUUSD – Range 3735–3755 now serves as trend confirmation zoneXAUUSD – Range 3735–3755 now serves as trend confirmation zone
Technical Analysis
Gold (XAUUSD) is moving within a narrow range of 3735–3755, and this price zone currently acts as a “pivot point” to confirm the next direction.
Short-term resistance: 3755–3772, price has reacted strongly multiple times. If not decisively broken, selling pressure may continue.
Key support: 3735, this is the decisive zone – breaking it will confirm a downward trend, targeting lower levels.
Stronger resistance: 3790–3793, confluence of several previous peaks, where strong selling pressure may form.
EMA200 H1 (3723) still supports the major uptrend, but the price has moved far and is now in the phase of retesting supply – demand zones.
RSI (14) around 45–48, not yet in oversold territory but leaning towards the sellers.
From a technical perspective, this is a market phase that requires confirmation: breaking above 3755 will reopen the upward momentum, while losing 3735 will reinforce short-term downward pressure.
Trading Scenarios
Sell Scenario (preferred if resistance holds):
Sell 3769–3772, SL 3775, TP: 3755 – 3746 – 3737
Sell 3791–3793, SL 3798, TP: 3783 – 3772 – 3760 – 3745
Sell when price confirms below 3735, SL 3742, TP: 3726 – 3715 – 3702 – 3690
Buy Scenario (trend-following on breakout):
Buy when price confirms above 3755, SL 3747, TP: 3766 – 3778 – 3790
Buy 3705–3702, SL 3697, TP: 3717 – 3726 – 3744 – 3763 – 3780 – 3790
Price Zones to Watch
3735–3755: trend confirmation range, most important in the short term.
3769–3772 and 3791–3793: strong resistance zones, potential Sell zone.
3702–3705: deep Buy zone, combined with strong support and EMA200.
3790: key resistance level, breaking it will reinforce the major uptrend.
Outlook
The gold market is in a decisive phase at the 3735–3755 range. Sellers have a short-term advantage, but if the price exceeds 3755, the uptrend may soon return. The best strategy is to trade based on price confirmation at key zones, combining profit-taking at each successive TP level to optimise gains.
This is a reference scenario based on technical analysis, not an investment recommendation. Stay tuned for earlier analyses in upcoming sessions.
Xauusd(w)

Elliott Wave Analysis XAUUSD – September 26, 2025
________________________________________
🔹 Momentum
• D1: Currently decreasing → the corrective trend is likely to continue. It may take about 2 more D1 candles for momentum to enter the oversold zone, after which a reversal could occur.
• H4: Momentum is rising → today we may see a bullish move or sideways range.
• H1: About to enter the oversold zone → a short-term bullish reversal is likely.
________________________________________
🔹 Wave Structure
• D1:
o As analyzed previously, wave 5 (yellow) has already reached its first target at 3789.
o It may take around 2 more D1 candles for momentum to enter oversold → showing that the bearish leg is weakening.
o Considering depth and time, the market is likely within wave 4 of wave 5. Once the correction completes, the uptrend should resume toward the second target.
• H4:
o A WXY corrective structure is developing.
o The ABC (blue) has completed wave W → the market may now be in wave X, followed by a Y-wave decline to finish the correction.
• H1:
o Wave X appears to be forming a triangle, currently in the final wave e.
o However:
If price rises sharply above 3762, it would suggest the corrective phase is already completed.
The target area for wave e is around 3752 → potential Sell zone.
If price breaks below 3729, it confirms wave Y is in play, targeting 3713 and 3698 → potential Buy zones.
⚠️ Note: If the Buy target is reached first, the Sell setup will be canceled.
________________________________________
🔹 Trading Plan
🔻 Sell Zone
• Entry: 3751 – 3753
• SL: 3761
• TP: 3729
________________________________________
🔺 Buy Zone 1
• Entry: 3714 – 3712
• SL: 3704
• TP: 3751
________________________________________
🔺 Buy Zone 2
• Entry: 3699 – 3696
• SL: 3686
• TP: 3751

LiamTrading – Gold may fake a move before dropping
Gold is trading around the 375x region and might exhibit a "fake breakout" upwards before adjusting downwards. The price structure on the H4 chart shows:
Strong resistance is located at the 3770–3773 region, coinciding with the 0.786 – 1.0 Fibonacci extension area. This is a confluence zone prone to a downward reaction.
The main trendline remains upward, but the RSI is gradually weakening, indicating that the buying force is not as strong.
Short-term support is at 3710–3713, also the 0.5 – 0.618 fibo zone, suitable for buy scalping orders.
A larger support area is at 3688–3691, where it converges with the trendline bottom and important Fibonacci, considered a sustainable "buy zone."
Trading Plan Reference
Sell: 3770 – 3773, SL 3778, TP 3756 – 3743 – 3725 – 3710
Buy scalping: 3710 – 3713, SL 3705, TP 3725 – 3736 – 3748 – 3760
Buy zone: 3688 – 3691, SL 3684, TP 3699 – 3710 – 3725 – 3736 – 3745 – 3760
In summary, gold may create a false upward move to the resistance zone 3770–3773 before reversing to adjust. Traders should patiently wait for confirmation signals at key price zones to enter optimal orders and manage risks tightly.
This is my personal view on XAUUSD. If you find it useful, follow for the fastest updates on upcoming scenarios, continuously updated at comulity

Gold under EMA pressure Buy at support,short scalp at resistance🟡 XAU/USD – Captain Vincent ⚓
🔎 Captain’s Log – Context & News
FED : Probability of a 25bps cut in October is 91.09% → almost certain.
US Calendar today : GDP, Jobless Claims, Durable Goods Orders, and especially speeches from 3 FED officials → strong volatility expected.
Gold yesterday : Dropped deeply but reacted precisely at key support → according to Vincent, this sell-off was mainly due to investors being cautious ahead of tomorrow’s CPI data.
⏩ Captain’s Summary : Short-term waves are pressured by EMAs, but the bigger voyage remains bullish – sailors prioritize Buy at Golden Harbor, only Quick Boarding 🚤 when facing Storm Breaker.
📈 Captain’s Chart – Technical Analysis (H30, EMA 34 & EMA 89)
EMA : EMA 34 (yellow) crossing below EMA 89 (red) → short-term bearish signal.
Trend : Overall still bullish, with Bullish OBs and Buy Zones below acting as strong supports.
Storm Breaker (Resistance / Sell Zone)
3,769 – 3,777 (Bearish OB)
Golden Harbor (Support / Buy Zone)
3,734 – 3,718 (Bullish OB)
3,687 – 3,685 (Buy Zone OB)
3,650 – 3,648 (Deeper Buy Zone, confluence with EMA 89)
🎯 Captain’s Map – Trade Plan
⚡ Sell (short-term scalp)
Entry: 3,776 – 3,773
SL: 3,783
TP: 3,770 – 3,765 – 3,760 – 3,755 – 3,750
✅ Buy (main priority)
Buy Zone 1 (OB)
Entry: 3,687 – 3,685
SL: 3,678
TP: 3,700 – 3,705 – 3,710 – 3,715 – 3,720
Buy Zone 2 (Deeper OB)
Entry: 3,650 – 3,648
SL: 3,638
TP: 3,665 – 3,670 – 3,675 – 3,680 – 3,685
⚓ Captain’s Note
“The Golden sails are facing headwinds from short-term EMAs, but Golden Harbor 🏝️ (3,734 – 3,650) remains a solid support dock. Storm Breaker 🌊 (3,769 – 3,777) is only suitable for short Quick Boarding 🚤 scalps. Tonight, the US sea will bring big waves from data & FED speeches – sailors, tighten your sails and manage trades with discipline.”
📢 If you find Captain’s Log useful, don’t forget to Follow for the latest updates.
💬 Do you have a different view on Gold? Drop a comment and join the crew discussion!

LiamTrading XAUUSD Scenario Today Fibo & Volume Profile AnalysisLiamTrading XAUUSD Scenario Today:Fibo & Volume Profile Analysis
Gold, after testing the 375x zone, has shown clear signs of weakening. On the H1 chart, the price structure is forming an adjustment phase aligning with key Fibonacci and Volume Profile levels. This is the time when the market starts to “filter” liquidity, creating opportunities for both short sell orders and buy orders at strong support zones.
Technical Analysis
Fibonacci indicates the 0.786 – 1.0 zone around 3756–3758 coincides with strong resistance and FVG, with a high potential for a reversal.
Volume Profile points out the POC area around 3735–3740, if breached, it will pave the way for deeper downward pressure.
The confluence support zone of 0.618 fibo + large volume around 3688–3691 is suitable for scalping buy.
Further, the area 3648–3651 is reinforced by VAL and the bottom of the volume profile, making it a strong long-term “Buy zone.”
Trading Plan Reference
Sell zone: 3756 – 3758, SL 3763, TP 3750 – 3748 – 3736 – 3710 – 3690 – 3655
Buy scalping: 3688 – 3691, SL 3685, TP 3701 – 3715 – 3728
Long-term Buy zone: 3648 – 3651, SL 3640, TP 3670 – 3688 – 3700 – 3718 – 3733 – 3755
In summary, gold is moving in accordance with the technical structure confirmed by Fibonacci and Volume Profile. Today's scenario prioritises observing reactions around the sell zone 3756–3758 to find short opportunities, and waiting to buy at value zones 369x and 365x for the recovery wave.
This is my personal view on XAUUSD. If you want the fastest updates on the next gold scenarios, follow me and join the community to stay informed.

XAUUSD – Wolfe Waves continue on H4XAUUSD – Wolfe Waves continue on H4, price returns below trendline: prioritise correction scenario
Hello Trader,
Based on the Wolfe Waves structure on the H4 frame and current price behaviour, gold has returned to trading below the trendline, indicating a weakening short-term uptrend and paving the way for a downward correction before the market decides the next trend. The upper zone has created a clear “sell zone”; below, two defensive buy zones appear suitable for both scalping and medium-term.
Main Technical Picture
Wolfe Waves: wave 5 completes near resistance, then price falls back below the trendline — aligning with the correction scenario along Wolfe's target line 1–4.
Trendline & price box zone: the close below the rising trendline indicates “acceptance” below; immediate resistance lies at the 375x–376x cluster (sell zone).
Momentum: H4 MACD slows, histogram narrows → high probability of a pullback – retest before a new decision.
Detailed Trading Scenarios
1) Sell according to correction trend (priority)
Entry: 3756 – 3759
SL: 3764
TP: 3745 → 3732 → 3715 → 3690 → 3672
Reason: the 375x zone coincides with the sell zone + upper trendline; selling at retest offers a good R:R ratio.
Confirmation/Negation: if H4 closes above 3764 and holds, the short-term sell scenario weakens.
2) Buy scalping in buffer zone
Entry: 3701 – 3703
SL: 3695
TP: 3715 → 3732 → 3745 → 3766
Note: this is just a rebound in the correction phase; lock each step and move SL according to TP1.
3) Buy medium-term (strong base zone)
Entry: 3648 – 3651
SL: 3644
TP: 3672 → 3698 → 3708 → 3722 – 3727
Reason: the 365x zone coincides with the demand/accumulation volume on H4; suitable for catching a deep rebound along with the larger trend.
Management: this is a medium-term order, so divide volume, lock each step and move SL to breakeven after TP1.
Refer to my scenario if you find it reasonable, trade accordingly, and if you enjoy trading gold with high-quality scenarios, follow me.

XAUUSD – The downward trend continues to be prioritisedThe downward trend continues to be prioritised (Wolfe Waves Pattern H4)
Hello Trader,
Gold is following the Wolfe Waves structure on the H4 chart, after bouncing off the upper resistance zone and returning below the trendline. This indicates that the short-term upward momentum has weakened, and the scenario of a downward adjustment continues to be prioritised at this stage.
Technical Analysis
Wolfe Waves are clearly formed, wave 5 has hit resistance and a reversal signal has appeared.
The price failed to hold above the upper trendline, while the MACD shows weakening upward momentum.
The 3746 – 3748 zone is considered the main “sell zone” in the short term.
Nearby support zones: 3709 – 3711 and deeper at 3675 – 3678. Further, the area around 3650 is an important “buy zone” in the medium term.
Trading Scenario
Sell following the trend (priority)
Entry: 3746 – 3748
SL: 3754
TP: 3733 → 3720 → 3702 → 3690
Buy Short-term Scalping
Entry: 3709 – 3711
SL: 3705
TP: 3722 → 3730 → 3745
Buy Deep Support Scalping
Entry: 3675 – 3678
SL: 3670
TP: 3688 → 3696 → 3710 → 3725
Medium-term Buy Zone
Entry: around 3650
This is a high-volume accumulation zone, coinciding with strong support on H4. This area is suitable for considering medium-term buy orders if the price adjusts deeply.
Conclusion
In the short term, the bearish scenario continues to be prioritised, especially when the price remains below the 3748 zone.
Buy strategies should only be considered in the form of scalping or at the important buy zone around 3650.
The current gold market is still in a distribution phase, so patience is needed to observe candle confirmations at entry zones to optimise the R:R ratio.
This is today's XAUUSD trading scenario according to Wolfe Waves on H4. You can refer to and combine with personal strategies for the best risk management.
Follow me to receive the latest scenarios when the price structure changes.

Gold Neowave Stuctural UpdateNamaskaram Everyone
Welcome to intelligent investor, we provide market insights by synchronising and combining all the price action waves from different time frames and gives you single trend.
How To Read My Charts...Click Below
FX:XAUUSD FX:XAUUSD OANDA:XAUUSD MCX:GOLD1!

Gold 1H – Will Gold Correction Extend Toward Discount Zones?Gold on the 1H timeframe is trading close to 3,745 after a series of bearish pushes, with premium resistance placed at 3,780–3,778 and another resistance pocket at 3,748–3,746. On the downside, discount demand is noted at 3,713–3,706, with a deeper support near 3,665. Recent CHoCH signals highlight short-term bearish bias, indicating that liquidity sweeps into resistance zones may occur before price retraces towards discount areas.
Today’s headlines around renewed U.S. inflation concerns and expectations of a slower Fed pivot are dampening sentiment, while geopolitical tensions in the Middle East continue to support safe-haven bids. This combination is likely to keep intraday volatility elevated, with liquidity grabs around resistance zones expected before a clearer directional move emerges.
________________________________________
📌 Key Structure & Liquidity Zones (1H):
• 🔴 SELL GOLD LIQUIDITY 3,780–3,778 (SL 3,787): Premium resistance where sweeps may trigger rejection toward 3,760 → 3,740 → 3,730.
• 🔴 SELL GOLD 3,748–3,746 (SL 3,755): Intraday resistance aligned with 0.5–0.618 retracement, targeting 3,730 → 3,720 → 3,715.
• 🟢 BUY ZONE 3,697–3,699 (SL 3,692): Discount demand with liquidity confluence, offering upside targets at 3,715 → 3,730 → 3,745+.
________________________________________
📊 Trading Ideas (Scenario-Based):
🔻 Sell Setup – Liquidity Run (3,780–3,778)
• Entry: 3,780–3,778
• Stop Loss: 3,787
• Take Profits:
TP1: 3,760
TP2: 3,740
TP3: 3,730
🔻 Sell Setup – Intraday Rejection (3,748–3,746)
• Entry: 3,748–3,746
• Stop Loss: 3,755
• Take Profits:
TP1: 3,730
TP2: 3,720
TP3: 3,715
🔺 Buy Setup – Discount Demand (3,697–3,699)
• Entry: 3,697–3,699
• Stop Loss: 3,692
• Take Profits:
TP1: 3,715
TP2: 3,730
TP3: 3,745+
________________________________________
🔑 Strategy Note
With U.S. inflation concerns and geopolitical risks creating mixed drivers for gold, intraday strategies can look to fade liquidity sweeps into premium resistance while keeping an eye on buy opportunities from well-defined discount demand zones. Expect sharp moves around 3,780 liquidity grabs before corrections extend down into the 3,713–3,706 area.

XAUUSD Facing Downward PressureHello traders, XAUUSD is currently facing downward pressure following recent economic news. The lower-than-expected unemployment claims data suggests economic stability, reducing the demand for gold. The higher-than-expected PCE core index increases the likelihood that the Fed will maintain high interest rates, putting pressure on gold prices. While the US GDP remains stable , there is no strong breakthrough.
Technically, XAUUSD is in an uptrend but has encountered resistance at $3,790 . The price of gold is currently testing support at $3,700. If this level is broken, gold could fall to the $3,635 region.
Given the current fundamental and technical factors , the likelihood of XAUUSD continuing to decline is high. If support doesn't hold, gold could continue to drop.
Wishing you successful trading!

Hi Traders, Anfibo here!Hi Traders, Anfibo here!
Market Overview – XAUUSD
Gold (XAUUSD) is currently holding steady within the H4 bullish channel, showing that the overall uptrend remains intact. While there has not been a major breakout in recent sessions, the technical structure still suggests buyers have the upper hand.
That said, the market is slowing down around a key resistance zone. For short-term opportunities, it’s important to focus on reactions at support and resistance levels to capture profits effectively.
Key Levels
Support: 3748 – 3733 – 3703
Resistance: 3768 – 3777 – 3788 – 3799
Trading Plan for Today
Sell Scalp Setup
Entry: 3770 – 3765
Stop Loss: 3780
Take Profit: 3720 – 3705
Buy Zone Setup
Entry: 3700 – 3705
Stop Loss: 3695
Take Profit: 3760 – 3800
⚠️ Always use stop-loss and follow strict money management rules to protect your capital.
Wishing you all successful trades!

Every time gold falls back, it is to reboundGold is no longer in a one-sided rally. Technically, it's undergoing a major correction. Our strategy is to follow the trend and prioritize both long and short positions. Now that we're seeing a major trend, the most common question we receive is whether a major decline has begun or whether gold has peaked. Yesterday's daily chart closed with a negative candlestick pattern, and the previous trading day also saw a vague tombstone candlestick pattern. Currently, we can only confirm short-term resistance, but we can't confirm a major trend peak or a bullish weekly trend. Furthermore, the short-term correction hasn't disrupted the bullish trend, so today we'll maintain a long strategy on pullbacks.
From a 4-hour analysis, effective support remains near the 3718-23 area, with upward pressure focused on the 3756-65 area. Our strategy is to primarily buy on pullbacks. In the intermediate range, be cautious and watchful.
Gold Trading Strategy:
Buy on pullbacks to the 3718-23 area, with a stop-loss at 3709 and a target of 3756-3765.

XAUUSD – The SELL trend has been confirmed
Technical Analysis
After a strong rally hitting the resistance zone of 3770–3780, gold (XAUUSD) failed to maintain momentum and began forming consecutive declines. This signals that selling pressure is dominant in the short term.
The 3767–3769 zone coincides with a local resistance, where the market has reacted multiple times → confirming its role as a distribution zone.
Fibonacci Retracement levels from the most recent upward wave show the 0.618 area around 3700–3705 acting as short-term support, where a technical rebound may occur.
The 3673–3675 zone confluences with Fib 2.618 and EMA200 → strong support, considered the main Buy zone for long-term buyers.
RSI (14) is currently below 50, momentum leans towards a decline, confirming that a corrective trend is prevailing.
Trading Scenario
SELL Scenario (trend-following priority):
Entry: 3767–3769
SL: 3775
TP: 3755 – 3740 – 3733 – 3710 – 3694
Buy scalping Scenario (short-term support reaction):
Entry: 3701–3704
SL: 3698
TP: 3710 – 3722 – 3736
Buy zone Scenario (priority for medium-term rebound):
Entry: 3673–3675
SL: 3666
TP: 3688 – 3696 – 3705 – 3720 – 3736
Price zones to watch
3767–3769: important resistance, priority Sell zone.
3700–3705: short-term support, potential Buy scalping area.
3673–3675: main Buy zone, confluence of support + Fibonacci.
3694 and 3736: key intermediate levels, where partial profit-taking is advisable.
The main short-term trend is leaning towards SELL, however, important support zones may offer opportunities for counter-trend Buy or trend-following Buy after price correction.
This is a reference scenario based on resistance – support and Fibonacci. Follow me if you love trading gold and want to read the latest analyses in the community.

Fed Cuts & Geopolitical Risks Keep Gold Strong📊 Market Overview
Gold is holding firm above 3750 USD/oz, extending gains and refreshing daily highs in the European session. Expectations that the Federal Reserve will continue cutting rates this year are supporting bullish sentiment, while ongoing geopolitical tensions keep safe-haven demand elevated. For Indian traders, this combination of softer USD and global uncertainty keeps gold attractive both as a hedge and a short-term trading instrument.
🔎 Technical Analysis (H1/H4)
Price structure remains bullish while holding above 3750.
Buy Zones: 3742–3740 (main support) and 3757–3755 (scalp setup).
Resistance nearby at 3778, with extended upside potential towards 3813–3815 (liquidity sell zone).
A rejection at 3813–3815 could trigger a short-term pullback to demand levels.
🔑 Key Levels
Resistance: 3778 - 3813 - 3815
Support / Buy Zones: 3757 - 3755 - 3742 - 3740
📈 Scenarios & Trading Plan
✅ BUY ZONE (Main Setup): 3742–3740
SL: 3735
TP: 3748 - 3752 - 3756 - 3760 - 3770 - 3780 - …
✅ BUY SCALP (Quick Entry): 3757–3755
SL: 3750
TP: 3762 - 3766 - 3780 - …
✅ SELL ZONE (Liquidity Trap): 3813–3815
SL: 3820
TP: 3810 - 3805 - 3800 - 3795 - 3790 - 3780 - …
⚠️ Risk Management Notes
Watch out for false breakouts at 3813–3815 — liquidity sweeps are likely before reversals.
Focus on buying confirmed pullbacks rather than chasing price mid-range.
Keep trade size moderate — volatility can increase on Fed comments or geopolitical updates.
✅ Summary
Gold’s bullish trend remains intact, supported by Fed cut expectations and geopolitical risks. Trading plan: buy dips at 3757–3755 and 3742–3740, aiming for 3770–3780, while monitoring the 3813–3815 zone for short-term sell opportunities if rejection occurs.
📢 Follow MMFLOW TRADING on TradingView for intraday setups, liquidity-based strategies, and high-probability trade ideas tailored for global traders.

Gold shakes violently | Priority Buy on dip to support🟡 XAU/USD – 24/09 | Captain Vincent ⚓
🔎 Captain’s Log – Context & News
Geopolitics : Trump unexpectedly supported Ukraine reclaiming full territory and called on NATO to be tougher on Russia → defensive sentiment returned, supporting Gold.
US Economy : Housing data due today, no FED speeches.
Earlier: Weak US PMI + dovish FED tone → no momentum for a prolonged downtrend.
Price Action : Gold dropped more than 20 points overnight, then quickly rebounded to 3,76x → likely profit-taking pressure at higher levels.
⏩ Captain’s Summary : Main trend stays bullish, but the voyage will remain choppy as Gold absorbs profit-taking near resistance.
📈 Captain’s Chart – Technical Analysis (H45)
Golden Harbor (Support / Buy Zone)
Buy Scalp OB: 3,754 – 3,757
OB Harbor: 3,741 – 3,744
Storm Breaker (Resistance / Sell Zone)
Sell Scalp Zone: 3,797 – 3,800
Higher Sell Zone: 3,813 – 3,815
Market Structure
After the deep drop, Gold rebounded and held above 3,76x.
Bullish trend remains intact, but waves of volatility may occur near higher resistance zones.
🎯 Captain’s Map – Trade Plan
✅ Buy (priority)
Buy Scalp OB
Entry: 3,754 – 3,757
SL: 3,747
TP: 3,762 – 3,767 – 3,772 – 3,777 – 3,782
Buy Zone OB
Entry: 3,741 – 3,744
SL: 3,732
TP: 3,749 – 3,754 – 3,759 – 3,764 – 3,769
⚡ Sell (short scalp – lower RR)
Sell Scalp Zone
Entry: 3,797 – 3,800
SL: 3,806
TP: 3,795 – 3,790 – 3,785 – 3,780 – 3,775
Higher Sell Zone
Entry: 3,813 – 3,815
SL: 3,823
TP: 3,810 – 3,805 – 3,800 – 3,795 – 3,790
⚓ Captain’s Note
“The Golden ship rocked violently overnight but still anchored firmly at Golden Harbor 🏝️ (3,754 – 3,741) . Profit-taking waves may still rise at Storm Breaker 🌊 (3,797 – 3,815) , suitable for short Quick Boarding 🚤 scalps. Yet the main voyage continues north – Buy the Dip remains the compass to follow the strong winds.”
📢 If you find the Captain’s Log useful, don’t forget to Follow for the latest signals.
💬 Got your own view on Gold? Share it in the comments and join the crew discussion!

Gold Trading Plan: After Record High Pullback📊 Market Context
Gold is struggling to recover after the pullback from its all-time high near 3791 USD/oz. During the Asian session on Thursday, price action turned cautious as traders await US mid-tier data and further comments from Federal Reserve officials. While the long-term outlook remains bullish, in the short-term, XAU/USD faces potential liquidity sweeps and sharp volatility around key zones.
🔎 Technical Analysis (H1/H4)
ATH zone 3791 triggered heavy selling pressure.
Price is currently moving below the 3755–3757 downtrend reaction zone, signaling short-term weakness.
Strong demand/liquidity sits at 3712 and deeper at 3688–3686 (CP + OBS Buy Zone).
Sell-side liquidity lies at 3775–3777, likely to trigger reactions on retests.
A broader Liquidity Sell Zone is visible at 3824–3830, only valid if 3777 breaks cleanly.
🔑 Key Technical Levels
Resistance / Sell Zones: 3775–3777 - 3791 - 3824–3830
Support / Buy Zones: 3712 - 3688–3686
📈 Trading Scenarios & Plan
✅ BUY ZONE (priority): 3688–3686
SL: 3680
TP: 3696 - 3700 - 3705 - 3710 - 3720 - 3730 - …
✅ SELL ZONE (scalp): 3775–3777
SL: 3782
TP: 3770 - 3765 - 3760 - 3750 - 3740 - 3730 - …
⚠️ Risk Notes
Be careful with false breakouts at 3775–3777 before reversals.
Avoid chasing price in the middle of the range; wait for price action confirmations at zones.
US data and Fed speeches can bring volatility – adjust position sizes accordingly.
✅ Summary
Gold is consolidating after its sharp rally to 3791 ATH, waiting for new catalysts from the US and Fed. Main plan: buy dips at 3688–3686 aiming for 3720–3730, while a short-term sell opportunity at 3775–3777 remains valid if rejection signals appear. If bulls clear 3777, the upside opens towards 3824–3830 liquidity.
📢 Follow MMFLOW TRADING for real-time liquidity setups and BIGWIN strategies!

LiamTrading – XAUUSD IN-DEPTH ANALYSIS OF CURRENT TRENDLiamTrading – XAUUSD Scenario Today: Opportunities at Key Price Levels
Gold continues its strong upward momentum, currently fluctuating around the 376x–377x range after a series of breakthroughs. The technical structure on the H1 chart shows the market is forming clear resistance and support zones, suitable for short-term trading plans.
Technical Analysis
RSI is cooling off from high levels, indicating the possibility of a short-term correction.
The upper price range around 3818–3821 is a strong confluence of resistance, coinciding with wave peaks and Fibonacci extensions, making it prone to selling reactions.
Conversely, the support zones at 373x and 370x exhibit dense liquidity, serving as potential buying points when prices adjust.
The short-term Dow structure still leans towards an uptrend, but attention is needed for the sell confirmation zone if gold fails at the peak.
Reference Trading Plan
Sell Zone: 3818 – 3821, SL 3828, TP 3805 – 3785 – 3760 – 3732 – 3650
Buy Scalping: 3728 – 3731, SL 3723, TP 3750 – 3777 – 3790
Buy Zone: 3706 – 3709, SL 3700, TP 3725 – 3738 – 3750 – 3777 – 3790
In summary, the main trend still leans towards an increase, but with gold approaching strong resistance zones, the likelihood of a correction is very high. Traders need to patiently wait for reactions at the marked zones for optimal entries, while managing risk tightly.
This is my personal view on XAUUSD. If you're interested in gold scenarios, follow me for the fastest updates.

Elliott Wave Analysis XAUUSD – September 25, 2025
________________________________________
🔹 Momentum
• D1: Momentum on the daily chart has turned bearish, indicating that the main downtrend may continue.
• H4: Momentum on H4 is about to turn bullish, suggesting a possible upward move today. However, if this bullish reversal fails to break the previous high, the downtrend will remain intact.
• H1: Momentum on H1 is declining and about to enter the oversold zone. This downward move may need around 2 more H1 candles before entering oversold territory and reversing.
________________________________________
🔹 Wave Structure
• D1:
o The first target of wave 5 (yellow) was reached at 3789.
o Price is currently reacting at this level. With D1 momentum turning bearish, there is a strong possibility that wave 5 (yellow) has already completed, meaning price could move towards 3632 and potentially break below it.
• H4: An ABC corrective structure (blue) has formed, opening three scenarios:
1. The correction is complete → price rallies strongly, breaking the previous high to continue the uptrend.
2. Price rallies but with overlap, forming a Flat 3-3-5 pattern → price may rise toward the previous high at 3793.
3. Price remains in a zigzag structure → another decline may occur to complete wave C.
👉 Given the bearish momentum on D1, I lean more towards scenario 2 and 3.
👉 Note: In scenarios (1) and (2), price must hold above 3729, then break 3752, which could lead to a minimum rally towards 3777.
• H1: Under scenario 3 (further decline to complete wave C):
o Price may break below 3718.
o Wave 5 (black) targets:
3713 (first target).
3698 (second target).
________________________________________
🔹 Trade Plan
• Buy Zone 1: 3729 – 3726
o SL: 3717
o TP: 3751
• Buy Zone 2: 3714 – 3711
o SL: 3703
o TP: 3751
________________________________________
⚠️ Important Note
The market is likely in a corrective wave at a higher structure.
• Characteristic: Price often shows overlapping moves.
• Therefore: Manage trades carefully, avoid over-risking, as reversals can happen at any time – this is typical of corrective waves.

GOLD TREND TODAY - Support and Resistance - Simple Analysis📈 Trend & Market Structure
XAUUSD
Gold is still in a clear uptrend, respecting higher highs and higher lows on H4.
Recent breakout structures (BOS) confirm bullish order flow, but price is approaching a liquidity zone near $3,800.
On the downside, unmitigated Fair Value Gaps (FVG) and Order Blocks (OB) remain potential buy zones if price retraces.
🔑 Key Levels
Resistance: 3800 – 3830
Support: 3765 – 3760 – 3755
Liquidity Buy Zone: 3715 – 3712
📌 Trade Ideas
🔴 SELL Setup (Countertrend / Scalping)
Entry: 3855 – 3858
Stop Loss: 3863
Take Profit:
TP1: 3850
TP2: 3840
TP3: 3820
TP4: 3800
Open TP: 3780
🟢 BUY Setup (Trend-following / SMC zones)
Entry: 3715 – 3712 (Liquidity + Strong OB)
Stop Loss: 3705
Take Profit:
TP1: 3725
TP2: 3735
TP3: 3755
TP4: 3775
Open TP: 3800
🎯 Strategy Note
Main bias: Look for buys on retracements in line with the uptrend.
Shorts at 3855 – 3858 are countertrend scalps only; use tight stops.
Apply scalping entries once price reacts at the defined S/R levels with confirmation (candlestick rejection, BOS, or volume shift).
Always use SL/TP for risk management.
⚡ Gold remains bullish overall; the plan favors buy opportunities from demand zones, while countertrend shorts should be quick and managed tightly.

Gold Finds Support at R1 , buy the Dip stills looks good We have seen a solid pullback (of over 72 points from the highs) in yesterday’s session, yet the broader structure on the H4 and higher timeframes remains firmly bullish, maintaining its HH-HL pattern. Price has so far rejected the 3720 zone (Weekly R1), confirming it as near-term support, and is now retesting the immediate resistance at 3750 along with the descending trendline overhead.
As long as gold holds above the PWH / 3700–3680 demand zone, this looks like a healthy consolidation rather than a trend reversal. A sustained breakout above 3750 and the descending trendline could trigger momentum toward the 3790–3800 zone once again.
For the short- to mid-term outlook, buying dips remains the preferred strategy, with invalidation coming only on a clean breakdown and H4 close below 3700 with strong volume.

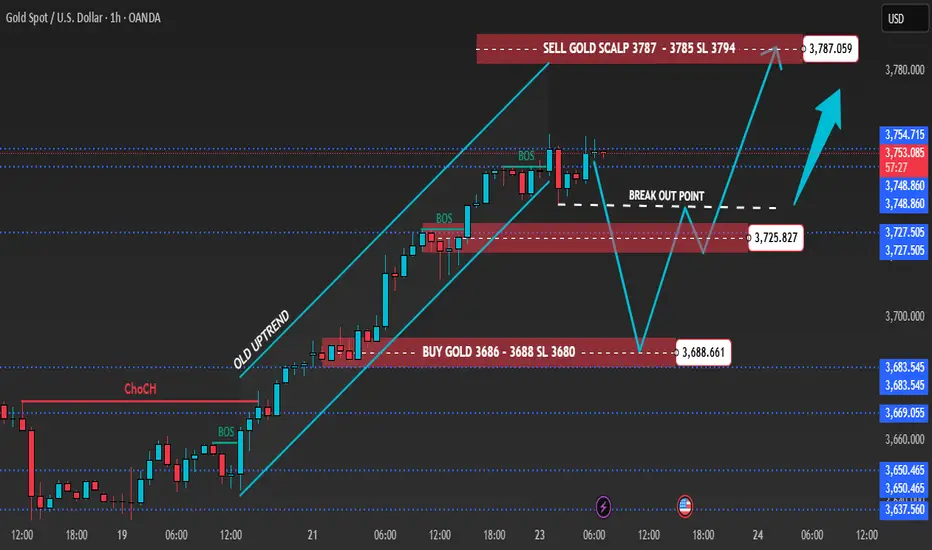
Gold 1H – Inflation Worries & Risk Sentiment Guide MovesGold on the 1H chart is hovering near 3,753 after multiple BOS confirmations, holding a firm bullish bias yet approaching premium resistance. Liquidity sits above 3,787–3,785, while fresh demand zones are placed at 3,725–3,723 and deeper at 3,688–3,686.
Today’s narrative around sticky U.S. inflation expectations and renewed geopolitical tensions in Eastern Europe is boosting safe-haven appetite. Still, intraday price action suggests possible liquidity sweeps into resistance before price retraces back towards demand zones.
________________________________________
📌 Key Structure & Liquidity Zones (1H):
• 🔴 SELL SCALP 3,787–3,785 (SL 3,794): Premium resistance where liquidity runs may spark short-term selling towards 3,780 → 3,775 → 3,770.
• 🟢 BUY ZONE 3,725–3,723 (SL 3,718): Pullback demand aligned with structure, favouring longs towards 3,740 → 3,755 → 3,770+.
• 🟢 BUY ZONE 3,688–3,686 (SL 3,680): Deeper discount demand area, attractive for positional buys targeting 3,700 → 3,715 → 3,730+.
________________________________________
📊 Trading Ideas (Scenario-Based):
🔺 Buy Setup – Pullback Demand (3,725–3,723)
• Entry: 3,725–3,723
• Stop Loss: 3,718
• Targets:
TP1: 3,740
TP2: 3,755
TP3: 3,770+
🔺 Buy Setup – Discount Demand (3,688–3,686)
• Entry: 3,688–3,686
• Stop Loss: 3,680
• Targets:
TP1: 3,700
TP2: 3,715
TP3: 3,730+
🔻 Sell Setup – Liquidity Sweep (3,787–3,785)
• Entry: 3,787–3,785
• Stop Loss: 3,794
• Targets:
TP1: 3,780
TP2: 3,775
TP3: 3,770
________________________________________
🔑 Strategy Note
Rising inflation concerns and safe-haven flows from geopolitical risks are keeping gold buyers in play. However, smart money could drive engineered stop-hunts near premium resistance before retracements set in. The bias remains buy-on-dips around key supports, while short-term scalps against liquidity sweeps near 3,787–3,785 should be approached with caution. Volatility is expected as markets digest U.S. inflation updates and risk headlines.
Gold Neowave UpdateFX:XAUUSD Namaskaram Everyone
Welcome to intelligent investor, we provide market insights by synchronising and combining all the price action waves from different time frames and gives you single trend.
GOLD & BTCUSD Video Analysis
How To Read My Charts...Click Below

Gold & BitCoin (Neowave Forecast)Namaskaram Everyone
Welcome to intelligent investor, we provide market insights by synchronising and combining all the price action waves from different time frames and gives you single trend.
How To Read My Charts...Click Below
