Elliott Wave Analysis XAUUSD – September 18, 2025
Momentum
• D1: Currently, D1 momentum is declining, therefore a downward move is likely to extend over the next 4–5 days.
• H4: Momentum is falling, so today we may see further downside to push momentum into the oversold zone before a potential reversal.
• H1: Momentum is still heading down, suggesting the bearish move is likely to continue.
________________________________________
Wave Structure
• D1: With momentum turning lower, it is highly probable that wave v black has completed and price has entered a corrective ABC phase. If this is the case, the correction will likely last for at least more than one week.
• H4: A 5-wave structure (1–2–3–4–5) within wave v black has been completed. The current decline could be wave A of the correction. We need to observe closely to confirm whether wave A is done. Note: during corrective phases, trading becomes more difficult; targets beyond 500 pips are rarely achieved as price tends to overlap. Toward the end of corrections, price often compresses and whipsaws both sides, so trade with smaller positions and manage risk carefully.
• H1:
o Scenario 1: Wave 1 of wave (5) black has formed, and the market is now in wave 2. This scenario is invalidated if price breaks below 3626.
o Scenario 2: Wave v black has already completed with a 5-wave structure. Price is now in a larger corrective phase (i–ii–iii–iv–v black on the D1). In this case, the correction will likely last longer than previous waves ii and iv – an important guide to prepare for an extended bearish or sideways phase.
On H1, the current drop is steep and impulsive, likely part of a 5-wave structure. The recovery was capped at the 38.2% Fibonacci retracement, which indicates:
• If this is wave 4 of the decline, price will break below 3649, with wave 5 of A projected toward 3632 → Buy zone.
• If price breaks above the minor high at the 38.2% Fibonacci level, it is more likely wave B of an ABC correction. In that case, the upside targets would be 3677 or 3694 → Sell zones.
⚠️ Note: Once price hits one target, the opposite entry setup will be canceled.
________________________________________
Trading Plan
Buy Zone:
• Entry: 3633 – 3630
• SL: 3620
• TP: 3649
Sell Zone 1:
• Entry: 3676 – 3679
• SL: 3686
• TP: 3657
Sell Zone 2:
• Entry: 3693 – 3696
• SL: 3703
• TP: 3677
Xauusd(w)

LiamTrading – XAUUSD OutlookSharing my personal view on the possible next move for gold.
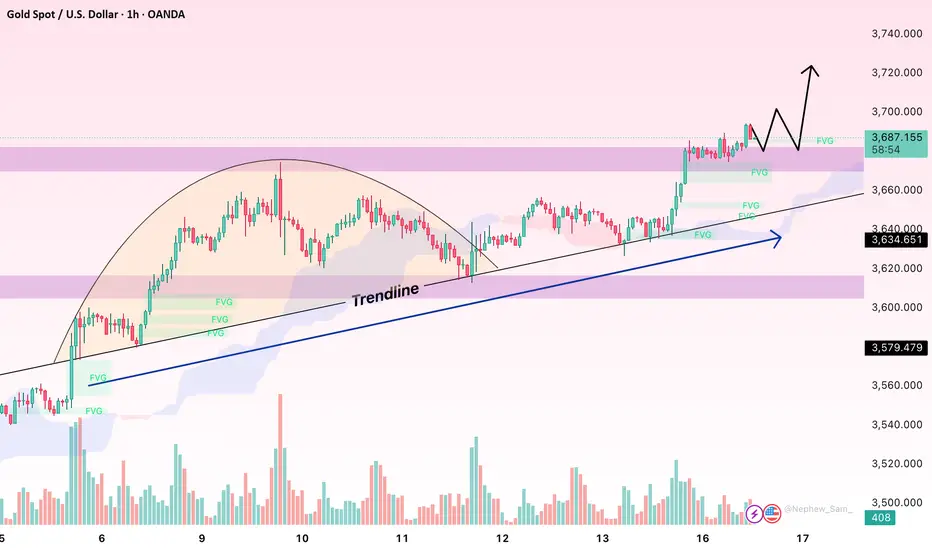
Based on the current chart structure, the wave formation suggests that XAUUSD is most likely in Wave 4. The correction started yesterday after price touched the 3,700 mark – a round resistance level which also coincides with the 1.618 Fibonacci extension. This area often attracts heavy liquidity, and the subsequent pullback further supports the view that Wave 4 has been activated.
At present, the key support to watch is 3,675. If this level breaks, the corrective structure could complete around 3,656. On the H1 timeframe, the RSI has moved below the 30 level, indicating oversold conditions. In my view, while the market remains in this phase, it is still preferable to look for selling opportunities, though patience is needed until clearer confluence signals appear.
Trading plan (short-term focus):
Sell entry 3685–3687, SL 3693, TP 3670 – 3656
Buy entry 3656–3654, SL 3648, TP 3675 – 3690 – 3702 – 3721 – 3740
I will continue to share further updates if there are significant moves in price. Wishing everyone successful and effective trading.

FOMC XAUUSD: Time to Hold Super SELL before FOMC🟡 XAUUSD Daily Trading Plan – Ahead of FOMC
📊 Market Context
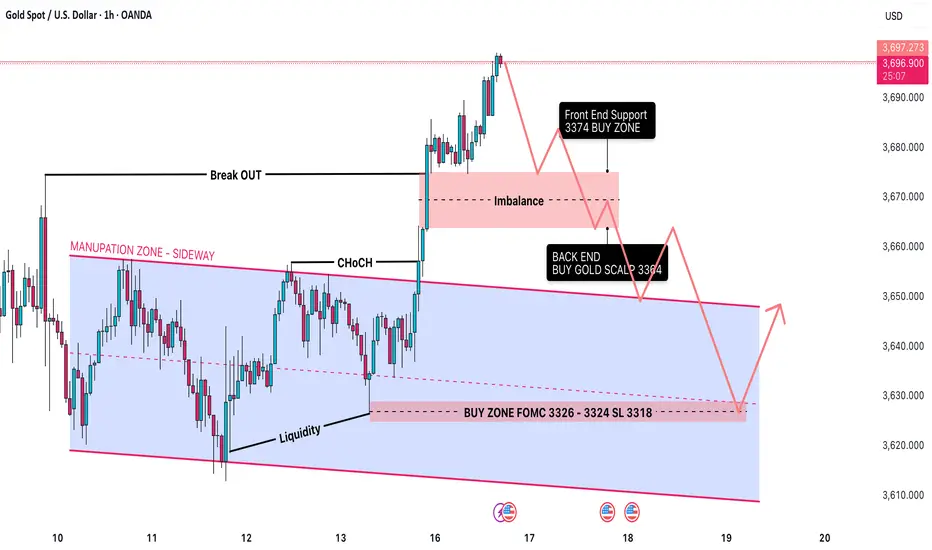
Gold (XAUUSD) has recently moved out of its accumulation/manipulation zone and is now trading in the 3,684–3,690 range.
The market structure is bullish after a Change of Character (CHoCH) followed by a Break of Structure (BOS).
Still, imbalances remain below the present price level, suggesting the possibility of a retracement before further upside continuation.
Liquidity pools are forming around 3,721–3,725, which increases the risk of false breakouts (liquidity traps) near the FOMC.
🔎 Technical Analysis (SMC Perspective)
Structure: Bullish bias on H1/H4, confirmed by higher highs and BOS.
Imbalance Zone: 3,674 → 3,664 (likely to be revisited).
Liquidity Pools:
Buy-side liquidity: 3,721–3,725 (Sell Zone).
Sell-side liquidity: 3,626–3,624 (Equal Low Zone).
🔑 Key Levels
Resistance / Sell Zones
3,686.88 (Immediate resistance)
3,721–3,725 (Liquidity Sell Zone)
Support / Buy Zones
3,668 (Front End Buy – imbalance retest)
3,656–3,654 (Back End CP Buy Zone)
3,626–3,624 (Equal Low Liquidity Zone)
✅ Priority Scenario – BUY
Entry 1
Buy Limit: 3,668 (Front End Zone – imbalance retest)
SL: 3,661
TP: 3,690 → 3,700 → 3,721
Entry 2
Buy Limit: 3,656–3,654 (Back End CP Buy Zone)
SL: 3,648
TP: 3,690 → 3,700 → 3,721
Entry 3
Buy Limit: 3,626–3,624 (Equal Low Liquidity)
SL: 3,618
TP: 3,690 → 3,700 → 3,721
🔻 Alternative Scenario – SELL (Counter-trade)
If the price touches 3,721–3,725 (Liquidity Zone) before revisiting the lower buy zones → look for rejection patterns.
Enter SELL if bearish confirmation appears.
SL: 3,730
TP: 3,698 → 3,690 → 3,676
⚠️ Risk Management & Notes
Expect high volatility during FOMC – liquidity traps are very likely.
Reduce lot size before the news release to minimise risk.
Take trades only with confirmation (avoid blind buys/sells).
Main directional bias: Bullish as long as 3,648 holds.
Gold (XAUUSD) FOMC Forecast – 17 Sept 2025Gold (XAUUSD) FOMC Forecast – 17 Sept 2025
Current Price: ~3666
Key Levels Identified:
Resistance R1: ~3700
Trendline Resistance R2: ~3780
Support S1: ~3623
Support S2: ~3540
📰 News Impact Projection:
If the Federal Reserve Cuts the Funds Rate
Expect bullish momentum.
Strategy: Buy after a retest above Resistance R1 (~3700).
Target: Trendline Resistance R2 → ~3780.
If the Federal Reserve Increases the Funds Rate
Expect bearish momentum.
Strategy: Sell after a retest below Support S1 (~3623).
Target: Support S2 → ~3540.
⚠️ Stop Loss (SL):
Around 3658, near current consolidation zone.
🎯 Summary
Bullish case (Rate Cut): Buy above 3700 → Target 3780.
Bearish case (Rate Hike): Sell below 3623 → Target 3540.
Market direction will strongly depend on FOMC Funds Rate decision.

XAUUSD H1 – Pennant + Head & ShouldersXAUUSD H1 – Pennant + Head & Shoulders: Two Key Levels 3657 / 3627
Hello Traders,
Gold opened the week with a bounce of over 20 points from the rising trendline and is now consolidating within a Pennant, which aligns with a small Head & Shoulders structure on the H1 chart. At the moment, the market is waiting for a breakout and confirmation to establish a clearer direction.
Pattern: A narrowing Pennant Flag alongside an H&S (left shoulder – head – right shoulder).
Key Zones to Watch
3655–3660: Crucial reaction zone (trendline + Pennant top).
3627: Critical support — a break below would invalidate the short-term bullish structure.
Fibonacci Levels:
1.618 in the mid-range, 2.618 lower — possible targets for a deeper correction.
MACD (12,26,9): Histogram has turned negative → short-term bearish momentum has the edge, though clear confirmation is still pending.
Trading Scenarios
Bullish Setup
Entry: Retest around 3654–3657
Targets: 3663 – 3670 – 3680 → 3695
Stop: Below 3648
Bearish Setup
Entry: Sell directly on breakdown, or wait for a retest near 3671–3674
Targets: 3663 – 3650 – 3633 – 3615 → 3595 → 3568 → 3540
Stop: Above 3679
the market is currently pricing in near certainty of a 0.25% Fed rate cut on 17th September, while the probability of a 0.50% cut still remains on the table.
If you find this analysis helpful, feel free to share your thoughts in the comments. I’ll update the outlook as soon as the price structure changes — follow me to get the latest setups first.

Elliott Wave Analysis XAUUSD – September 17, 2025
Momentum
• D1 timeframe: Momentum is currently rising. As of today, the upward move has lasted for 3–4 daily candles. Therefore, in the next 1–2 days, momentum is likely to enter the overbought zone.
• H4 timeframe: Momentum is in the oversold area and starting to reverse. Once confirmed, we can expect at least 4–5 bullish H4 candles.
• H1 timeframe: Momentum is already in the oversold zone and has turned upward, suggesting an immediate short-term rally.
Wave Structure
• D1 timeframe: Price is moving within black wave v. Since black wave iii was extended, black wave v is likely to be approximately equal in length to black wave i.
• H4 timeframe: Inside black wave v, we expect a 5-wave green structure to form. Currently, green wave 1 seems to have completed, and price is correcting within green wave 2.
• H1 timeframe: Within green wave 1, a 5-wave black structure has been completed. Price is now developing a corrective black ABC pattern.
Target zones for black wave C:
• Target 1: 3675
• Target 2: 3657
Note: Wave 2 usually retraces to the 0.618 Fibonacci level of wave 1, which coincides with the 3657 zone. This is the key level to consider for a buy setup.
Trading Plan
• Buy Zone: 3658 – 3655
• Stop Loss: 3645
• Take Profit (TP1): 3677

FED shaken by politics | Gold eyes new ATH🟡 XAU/USD – 16/09 | Captain Vincent ⚓
🔎 Captain’s Log – News Context
FED & US Politics :
S. Miran elected to the FED Board but still serves as Trump’s economic advisor → concerns FED may face White House influence.
Michelle Mills elected with a narrow 48–47 margin.
Appeals Court blocked Trump from firing L. Cook, affirming FED’s independence, but raising the risk of a legal battle at the Supreme Court.
US Economy :
6:30 AM (US time): Retail Sales release – key consumer spending indicator.
Probability of a -50bps FED cut this week is down to 1.2% , nearly ruled out. FED is almost certain to deliver -25bps next week.
⏩ Captain’s Summary : Politics create noise, but the macro backdrop (FED easing + weak US data) remains the tailwind supporting Gold’s journey toward new ATH.
📈 Captain’s Chart – Technical Analysis
Storm Breaker (Resistance / Sell Zone) :
3706 – 3714 (Fibonacci resistance)
3722 – 3724 (Strong Sell Zone, potential ATH test)
Golden Harbor (Support / Buy Zone) :
FVG Dock: 3666 – 3668
OB Harbor: 3643 – 3645
Strong Low: 3611 (deep support)
Market Structure :
After a series of BoS , Gold broke out of sideways EqH/EqL and surged.
Preferred scenario: retrace to FVG 3666 , then bounce toward 3714 – 3722.
If 3722 breaks successfully → confirms new ATH and extends bullish momentum.
🎯 Captain’s Map – Trade Plan
✅ Buy (priority)
Buy 1 (FVG)
Entry: 3666 – 3668
SL: 3657
TP: 3690 – 3706 – 3714 – 372x
Buy 2 (OB)
Entry: 3643 – 3645
SL: 3632
TP: 3666 – 3700 – 3714 – 372x
⚡ Sell (short scalp at resistance)
Sell Zone
Entry: 3722 – 3724
SL: 3732
TP: 3714 – 3706 – 3690
⚓ Captain’s Note
“The Golden ship has broken free from sideways waters and is heading toward new peaks. Golden Harbor 🏝️ (3666 – 3643) is the safe dock for sailors to gather strength before sailing further. Storm Breaker 🌊 (3722 – 3724) is the big wave, suitable only for short Quick Boarding 🚤 . With dovish winds from the FED, the Golden sails are set toward new ATH.”

LiamTrading – XAUUSD Strategy for TodayI would like to share my personal view on gold for the day.
The overall trend in XAUUSD continues to be very strong, with the price consistently making fresh highs over the past two weeks. Buying interest has remained steady across sessions, while any corrections have been short-lived, mostly visible on the M15–M30 timeframes.
Yesterday, gold broke out of the Pennant pattern on the upside and is now consolidating near 3,680. On the H4 chart, this level aligns with an important Fibonacci zone, providing further technical confirmation.
From an Elliott Wave perspective, I expect Wave 3 to conclude near 3,700, followed by a corrective Wave 4 towards 3,660 – a level which has acted as reliable support in the past. After that, gold may enter its final Wave 5, with the potential to move towards the 3,740+ region.
Trading setups for consideration:
Buy 3658 – 3656, SL 3651, TP 3674 – 3688 – 3700 – 3715 – 3730 – 3744
Sell 3697 – 3700, SL 3705, TP 3688 – 3672 – 3660 – 3650
Sell 3740 – 3744, SL 3748, TP will be decided based on the price structure at that time
Important levels to keep in focus: 3673 – 3663 – 3635 and 3721, as these zones may trigger price reactions and could be useful for intraday scalping opportunities.
This is my personal outlook on gold for today. I hope it will be helpful to fellow traders in making better trading decisions. Kindly share your feedback in the comments.

GOLD LONG IDEA AT BOTTOM 1400PIPS IN NONFARM
BUY GOLD 3314 +900PIPS
BUY GOLD 3344 +500PIPS
📊 Today’s Non-Farm Payrolls (NFP) – USD
Average Hourly Earnings m/m:
✅ 0.3% (same as forecast and previous).
→ Wage growth is steady, no extra inflation pressure.
Non-Farm Employment Change:
❌ Actual: 22K vs Forecast: 75K vs Previous: 79K
→ Job creation has fallen sharply, showing slowdown in the US economy.
Unemployment Rate:
✅ Actual: 4.3% (as expected, higher than 4.2% previous).
→ Labour market conditions are getting weaker, unemployment rising.
🔎 Market Impact
US Dollar (USD):
Weak NFP data is negative for the dollar.
Higher unemployment increases chances of the Fed cutting rates earlier.
Gold (XAU/USD):
Positive for gold: Weak USD supports higher gold prices.
If the Fed turns dovish, safe-haven demand for gold will strengthen.
Gold may gain strong momentum on expectations of rate cuts.
Equities:
Wage inflation is stable, so no fresh inflation worries.
Equity markets may take it positively as Fed could soften policy.
📌 Key Takeaway
NFP weak → Bearish USD
Gold bullish, upside momentum possible
EUR, GBP likely to gain on USD weakness
Equities may stay supported

Gold 4H Outlook – Buy the Dip or Fade the Drop?On the 4H timeframe, Gold is consolidating just below 3,600 after a strong bullish rally. The current structure shows price pausing near premium levels, with liquidity building both above 3,600 and below 3,530. This indicates engineered sweeps are likely before the next major move.
📌 Key Structure & Liquidity Zones (4H):
🔼 Buy Zone 3,572 – 3,574 (SL 3,565): Fresh demand zone at intraday discount; potential continuation level.
🔽 Sell Scalp Zone 3,530 – 3,526 (SL 3,537): Short-term supply/pivot area; scalp opportunity if rejection happens.
📍 Liquidity Magnet 3,603 – 3,605: Upside imbalance area likely to get filled.
📊 Trading Ideas (Scenario-Based):
🔺 Buy Setup – Demand Zone Reaction
Entry: 3,572 – 3,574
Stop Loss: 3,565
Take Profits:
TP1: 3,585
TP2: 3,595
TP3: 3,605
👉 Demand block in line with bullish order flow. Watch for a liquidity sweep and rejection to fuel trend continuation.
🔻 Sell Scalp Setup – Short-Term Reaction
Entry: 3,530 – 3,528
Stop Loss: 3,537
Take Profits:
TP1: 3,520
TP2: 3,510
TP3: 3,500
👉 Intraday supply/pivot area. Best suited for quick scalp trades against the trend, targeting downside liquidity.
🔑 Strategy Note
Overall bias stays bullish, but intraday shorts can work for scalping purposes. The cleaner setup is to buy from 3,572–3,574 for continuation towards 3,600+. Smart money may attempt a liquidity sweep at 3,530 before pushing higher.

XAUUSD – Wave (4) Pullback Could Launch Wave (5)Namaste Traders
Gold on the M30 chart remains bullish, but the push into the upper channel line signals short-term profit booking. For those trading Gold/USD or tracking Gold in INR terms on MCX, here’s my plan for the upcoming sessions:
🔍 Technical Overview
Price completed Wave (3) around 3697.40, tagging the upper trend channel – a natural zone for sellers to take profits.
The 3666–3670 region has acted as a pivot/support multiple times. I expect a Wave (4) correction into this zone before a fresh rally.
3657 is deeper support and also serves as the invalidation level for the bullish scenario.
If Wave (4) holds, Wave (5) could push towards 3720–3725.
📈 Key Levels
Type Price Level Notes
Resistance 3695–3700 Wave (3) top + upper channel edge – watch for rejection
Support (1) 3666–3670 Primary buy zone for Wave (4)
Support (2) 3657 Strong support & invalidation
Target (5) 3720–3725 Expected Wave (5) extension target
⚙️ Trading Plan
✅ Primary Setup – Buy the Dip (Trend Continuation)
Entry Zone: 3666–3670 (or a small sweep to ~3657).
Confirmation: Look for a bullish engulfing candle, pin bar, or MACD crossover on the M30 chart.
Take Profit:
TP1: 3695–3700 (previous high/resistance)
TP2: 3720–3725 (Wave (5) projection)
Stop Loss: Below ~3652.
Risk/Reward: Aim for 1:2 to 1:3.
⚠️ Secondary Setup – Countertrend Short
If price retests 3695–3700 and forms a strong rejection, a quick countertrend short is possible.
Targets: 3670 → 3657.
Stop Loss: Above ~3703–3707.
Use small position sizing, as this is against the primary trend.
🛡 Risk & Invalidation
A close below 3656 plus a break of the lower trend channel invalidates the bullish Wave (5) scenario.
For Indian traders watching MCX Gold (in INR), keep in mind USD/INR fluctuations – a weaker rupee can amplify gold gains even if spot prices pause.
Always keep risk ≤1–1.5% per trade and avoid chasing late entries.
🧭 Final Thoughts
Gold’s trend is still bullish on the short-term chart. A healthy correction into 3666–3670 could offer a prime entry for Wave (5). Be patient, wait for confirmation, and let the price come to your zone.
Countertrend shorts are valid only on a clear rejection at 3695–3700 – otherwise, stick with the trend.
Good luck and happy trading,

Gold Ahead of FOMC: Holding the Bullish Structure, Eyeing 3,700Hello everyone, gold is heading into a very sensitive week with the upcoming FOMC decision on rates and policy guidance. On the H1 chart, price just broke out to 3.68xx with a strong candle and improved volume, now consolidating just below 3,690–3,700 – a psychological barrier and session high. The broader trend remains upward as gold trades above a rising Ichimoku cloud, while clear support steps form below: 3,662–3,665 as the nearest floor, 3,648–3,642 as a deeper defense, and the 3,635–3,625 cloud zone as intraday trend protection. As long as gold holds above 3.66x, I favour a high-probability accumulation setup to retest 3,690–3,700; if H1/H4 candles close above 3,700, the next target could extend to 3,715–3,730.
On the news side, the midweek FOMC is the key trigger. A dovish Powell and dot-plot could soften USD and yields, giving gold a chance to break 3,700. A hawkish tone, however, may spark profit-taking and pull gold back to 3,662–3,665 or even 3,648–3,642 to test demand. Labour data, manufacturing reports, and the BoE decision will also shape sentiment. With US figures lately underwhelming, markets lean toward a softer Fed stance, which underpins gold. I tilt bullish, watching reactions around 3,665 and 3,645 as FOMC headlines hit.
Do you think the Fed will sound dovish or hawkish this week? Drop your thoughts!
GOLD Bullish continuation (new highs, momentum sustain) :
Probability: around 60–65%
The breakout has strong support from macro conditions. Real yields look like they are peaking, inflation expectations remain sticky, and the Fed is leaning toward easing. On top of that, the US dollar is softening and central banks are continuing to add gold to reserves. These combined factors increase the odds that the breakout holds and the trend continues higher.
Sideways consolidation or retest of breakout :
Probability: about 25–30%
A pullback or cnsolidation wouldn’t be surprising, especially if the Fed sounds less dovish or if inflation data cools faster than expected. In that case, gold could spend some time chopping between support and resistance before deciding its next big move.
Major correction or deep mean reversion :
A deep selloff looks like the least likely path right now. Real yields aren’t rising sharply, inflation isn’t collapsing, and the dollar is still under pressure. But nothing is guaranteed. A surprise hawkish turn from the Fed or a sudden global disinflation shock could knock gold back toward old structural levels.but this remains the least likely scenario in the near to medium term.

Gold 1H – Breakout Liquidity Trap Ahead of ExpansionGold on the 1H timeframe is consolidating around 3,652 after sweeping discount liquidity and reclaiming structure. Price has tapped the breakout zone and is currently trading between the scalp supply in premium and the higher liquidity pools. The structure indicates engineered moves into 3,656–3,658 or deeper liquidity around 3,672–3,674 before the next expansion. Discount demand remains protected at 3,614–3,612.
________________________________________
📌 Key Structure & Liquidity Zones (1H):
• 🔴 SELL ZONE 3,672 – 3,674 (SL 3,679): Premium supply pocket for engineered rejection, targeting 3,660 → 3,650 → 3,640.
• 🔴 SELL SCALP 3,656 – 3,658 (SL 3,663): Short-term premium sweep zone for intraday liquidity grabs, targeting 3,645 → 3,640.
• 🟢 BUY ZONE 3,614 – 3,612 (SL 3,607): Discount demand block aligned with bullish order flow, targeting 3,630 → 3,640 → 3,655.
________________________________________
📊 Trading Ideas (Scenario-Based):
🔻 Sell Setup – Premium Scalp Rejection
• Entry: 3,656 – 3,658
• Stop Loss: 3,663
• Take Profits:
TP1: 3,645
TP2: 3,640
👉 Intraday scalp opportunity if price sweeps into shallow premium liquidity.
🔻 Sell Setup – Deeper Premium Sweep
• Entry: 3,672 – 3,674
• Stop Loss: 3,679
• Take Profits:
TP1: 3,660
TP2: 3,650
TP3: 3,640
👉 Expect an engineered sweep into higher premium before reversal.
🔺 Buy Setup – Discount Demand Reaction
• Entry: 3,614 – 3,612
• Stop Loss: 3,607
• Take Profits:
TP1: 3,630
TP2: 3,640
TP3: 3,655
👉 A high R:R trade if price retraces to the protected demand before expansion.
________________________________________
🔑 Strategy Note
Smart money is likely to manipulate both premium and discount zones near the breakout point. The directional bias favours:
• Scalp sells at 3,656–3,658
• Swing sells at 3,672–3,674
• Discount buys at 3,614–3,612
Strict risk management is essential — expect liquidity sweeps on both sides before the actual expansion.

Fresh Highs, Hot Headlines , Is a Pullback Next?Gold broke out of its recent range yesterday and is now trading at new all-time highs, showing strong follow-through momentum. On the weekly pivot chart, price is currently testing Weekly R1, with the next key level being the psychological 3700 resistance.
While the technical structure remains bullish, today’s headlines from major gold newsletter are a reminder that sentiment is running extremely hot. When you start seeing mainstream media comparing gold rally to 1979 and celebrating retail traders wins, it often signals that we’re entering a frothy phase.
With the FOMC decision approaching, the risk of a short-term shakeout or healthy correction is definitely on the table. A close back below the breakout zone could trigger profit-taking, while holding above R1 would keep the path open for 3700 and beyond.
For now, 3625–3650 remains the key support area, and as long as price holds above this zone, the trend stays firmly bullish but we should stay cautious and avoid chasing too aggressively at these levels until we get clarity from the Fed.
Personally I am expecting some cool down after FOMC .

GOLD DAILY PLAN 15/09: SMC & Wyckoff Logic🔎 Market Overview
Market Structure (SMC): Price is currently moving inside a short-term descending channel but is showing signs of Wyckoff accumulation around the 3620–3635 zone (Liquidity BUY). This is a key support area.
Wyckoff: After a supply test, price is likely to consolidate and then push higher to sweep liquidity above (Liquidity SELL at 3688–3703).
Liquidity Zones
Liquidity BUY: 3595–3592 (major demand area)
Liquidity SELL: 3688–3703 (profit-taking & potential reversal zone)
📌 Key Levels
Resistance: 3668 – 3688 – 3703
Support: 3634 – 3629 – 3622 – 3617
🟢 BUY Plan (Primary Setup)
Entry: 3595–3592
Stop Loss (SL): 3587 (below Liquidity BUY)
Take Profit (TP) targets:
TP1: 3615
TP2: 3625
TP3: 3635
TP4: 3645
Open TP: 3685 (extended Wyckoff target)
🔴 SELL Plan (Counter-trade)
Entry: 3698–3701 (Liquidity SELL zone)
Stop Loss (SL): 3706 (just above breakout trap)
Take Profit (TP) targets:
TP1: 3690
TP2: 3680
TP3: 3670
TP4: 3660
Open TP: 3650
⚡ Scalping Strategy
Enter only on confirmation signals at Order Blocks (OB) or Liquidity Zones.
Prioritise BUY trades at support and SELL trades at resistance.
Apply strict risk management: risk no more than 1–2% per trade.
✅ Conclusion
Main directional bias for the day: BUY from 3595–3592, targeting the 3685–3700 region.
At Liquidity SELL 3688–3703, short-term SELL setups can be considered with targets back to 3660–3650.

Elliott Wave Analysis XAUUSD – September 16, 2025
Momentum
• D1: Momentum is currently in an uptrend, suggesting that price may continue to rise for the next 5–6 days.
• H4: Momentum is turning downward, indicating the possibility of a correction today.
• H1: Recently showed a bullish reversal signal, but now there are signs of weakening again. This suggests that the downward move on H1 may not yet be complete.
Wave Structure
• D1: Yesterday’s daily candle created a new high, which indicates that wave iv (black) has likely been completed. The market is now developing in wave v (black).
• H4: Wave iv (black) is likely finished. With H4 momentum turning lower, wave 1 of wave v (black) may already be completed, and the market is now entering a corrective phase.
• H1: Wave v (black) is unfolding into a 5-wave structure (green). Combined with weakening H4 momentum, there are two possible scenarios:
1. This is wave 4 (green), with a maximum correction level around 3662.
2. This is wave 2 of wave v (black – D1), with a potential correction target around 3657.
Since both scenarios point to a similar price zone, we select 3662–3660 as the buy entry zone.
Trading Plan
• Buy Zone: 3662 – 3660
• SL: 3650
• TP: 3698

Gold 1H – Fed Week: Liquidity Sweeps Before FOMCGold on the 1H timeframe is range-bound around 3,643 after a series of ChoCH/BOS prints. Liquidity is stacked above the intraday buy zone at 3,658–3,656 and higher at 3,676–3,678, while discount liquidity sits near 3,615–3,613. With markets pricing a possible Fed cut this week and the dot-plot in focus, expect engineered spikes into premium followed by mean reversion before any sustained move.
________________________________________
📌 Key Structure & Liquidity Zones (1H):
• 🔴 SELL ZONE 3,676 – 3,678 (SL 3,683): Premium resistance for an engineered sweep/rejection targeting 3,665 → 3,655 → 3,645.
• 🟢 BUY ZONE 3,658 – 3,656 (SL 3,651): Intraday demand within prior consolidation targeting 3,665 → 3,670 → 3,675+.
• 🟢 BUY SUPPORT 3,615 – 3,613 (SL 3,610): Discount demand at the base of structure targeting 3,630 → 3,645 → 3,655+.
________________________________________
📊 Trading Ideas (Scenario-Based):
🔺 Buy Setup – Intraday Reclaim (3,658–3,656)
• Entry: 3,658 – 3,656
• Stop Loss: 3,651
• Take Profits:
TP1: 3,665
TP2: 3,670
TP3: 3,675+
👉 Look for a sweep into the zone and an H1 close back above 3,656 to confirm order-flow continuation.
🔺 Buy Setup – Deep Discount Sweep (3,615–3,613)
• Entry: 3,615 – 3,613
• Stop Loss: 3,610
• Take Profits:
TP1: 3,630
TP2: 3,645
TP3: 3,655+
👉 High R:R if liquidity runs into protected demand before the New York session.
🔻 Sell Setup – Premium Sweep to Resistance (3,676–3,678)
• Entry: 3,676 – 3,678
• Stop Loss: 3,683
• Take Profits:
TP1: 3,665
TP2: 3,655
TP3: 3,645
👉 Expect a stop-run above recent highs into premium; invalidate on a firm H1 close above 3,683.
________________________________________
🔑 Strategy Note
Into Fed week, smart money often runs both sides of the book. Bias today favours: discount buys at 3,658–3,656 and 3,615–3,613, and a premium fade at 3,676–3,678. Use reduced size, wait for structure confirmation, and avoid holding through any unexpected Fed headlines or USD spikes.

Elliott Wave Analysis XAUUSD – 15/09/2025
1. Momentum
• D1 timeframe: Momentum is about to enter the oversold zone. At the beginning of next week (Monday), D1 may officially enter the oversold area and start reversing upward.
• H4 timeframe: Momentum is also approaching the oversold zone and preparing to reverse. This opens the expectation of a bullish move within the next 1–2 sessions.
• H1 timeframe: Momentum is currently declining, so there may be one more short-term drop to push H1 into oversold conditions before a potential reversal.
________________________________________
2. Wave Structure
• D1 timeframe:
Price is still within wave iv (black). In terms of time, wave ii (black) took 7 daily candles to complete. According to the principle of alternation, waves 2 and 4 often differ in nature. With D1 momentum about to reach oversold, there is a high probability that wave iv (black) is near completion.
• H4 timeframe:
Price is moving sideways, which is consistent with the characteristics of wave iv. If in the next session H4 momentum reverses upward and reaches overbought while price still fails to break above 3657, then the corrective structure may evolve into a triangle or a double three (WXY).
• H1 timeframe:
An ABC corrective structure seems completed, but instead of rallying, price continues to consolidate within the liquidity block at 3657 – 3631. This suggests a more complex structure is unfolding, either a triangle or a WXY combination.
With D1 momentum heading into oversold, the expected downside range is 3631 – 3595, which also aligns with the nearest high-liquidity zones on the chart.
________________________________________
3. Price Zones & Targets
• Breakout level:
o 3657 → A strong candle close above this level would confirm a buy signal.
• Support / Buy zones:
o 3631 – 3632 → Possible bottom of the current correction.
o 3593 – 3596 → Scenario if wave iv develops into a WXY structure.
• Wave v (black) target:
o Projection: 3709 (main target).
________________________________________
4. Trading Plan
1. Buy Breakout 3657
o SL: below breakout candle
o TP: 3709
2. Buy Zone 3632 – 3630
o SL: 3622
o TP: 3709
3. Buy Zone 3596 – 3593
o SL: 3585
o TP: 3709
________________________________________
👉 Summary: Both D1 and H4 momentum are approaching oversold, signaling that wave iv (black) may soon complete. The preferred strategy is to wait for confirmation at liquidity zones (3631 – 3595), or for a strong breakout above 3657, to join the next bullish wave v (black) targeting 3709.

XAUUSD Gold Trading Strategy September 15, 2025XAUUSD Gold Trading Strategy September 15, 2025: Weekly trend outlook, gold still has enough conditions for the possibility of continued price increases.
Basic news: After surpassing the 3670 USD/ounce mark, the highest level in history, the gold price has entered a correction phase, in the context of the market focusing on monitoring the policy moves of the US Federal Reserve (Fed). According to CME's FedWatch tool, investors are almost certain that the Fed will cut interest rates by 25 basis points, bringing the margin to 4 - 4.25%. However, the scenario of the Fed cutting 50 basis points is still considered, because this could cause the USD to plummet and push gold to skyrocket.
Technical analysis: The sideway range of 3600 - 3660 is still holding. Currently, we will wait for trading points at the 2 edges of the sideway range, but the priority is still mainly trading according to the trend.
Important price zones today: 3600 - 3605 and 3660 - 3665. Today's trading trend: Sideway.
Recommended orders:
Plan 1: BUY XAUUSD zone 3600 - 3602
SL 3597
TP 3605 - 3615 - 3635 - 3665 - OPEN.
Plan 2: BUY XAUUSD zone 3618 - 3620
SL 3615
TP 3623 - 3630 - 3650 - 3665.
Plan 3: SELL XAUUSD zone 3663 - 3665
SL 3668
TP 3660 - 3650 - 3640 - 3630 (small volume).
Wish you a new week of safe, effective and profitable trading.🥰🥰🥰🥰🥰

Gold faces early selling pressure | Main trend still Buy🟡 XAU/USD – 15/09 | Captain Vincent ⚓
🔎 Captain’s Log – News Context
FED rate cut probabilities this week :
-25bps : 96.4% (up from 89.1%).
-50bps : only 3.0% (down sharply from 10.9%).
Trump : Announced more sanctions on Russia, urged NATO to stop buying Russian oil; also emphasized “the possibility of significant FED rate cuts.”
Key event today : New York Manufacturing Index at 1:30 (US time).
⏩ Captain’s Summary : The sharp drop in -50bps expectations caused early selling pressure on Gold this morning. But overall, FED is still certain to cut rates and inflation is cooling → the bigger trend continues to favor Buy .
📈 Captain’s Chart – Technical Analysis
Storm Breaker (Resistance / Sell Zone) : 3665 – 3670 (Weak High & upper cap).
Golden Harbor (Support / Buy Zone) : 3623 – 3603 – 3587.
Market Structure :
On H1, Gold is moving within a tightening triangle with EqH and EqL .
Main trend stays bullish, but needs a retest of support before rallying toward 3665 – 3670.
🎯 Captain’s Map – Trade Plan
✅ Buy (priority)
Buy Zone 1
Entry: 3623 – 3625
SL: 3612
TP: 3640 – 3650 – 3660 – 3665+
Buy Zone 2 (FVG)
Entry: 3603 – 3605
SL: 3592
TP: 3620 – 3640 – 3655 – 3665
Deep Buy Zone
Entry: 3587 – 3590
SL: 3575
TP: 3610 – 3630 – 3650
⚡ Sell (short scalp at resistance)
Sell Zone
Entry: 3665 – 3670
SL: 3678
TP: 3655 – 3645 – 3635 – 36xx
⚓ Captain’s Note
“The Golden ship faces headwinds this morning as sailors reduce expectations for a -50bps cut. But the larger sail remains filled with dovish FED winds, steering the voyage north. Golden Harbor 🏝️ (3623 – 3603 – 3587) is the safe dock to gather strength. Storm Breaker 🌊 (3665 – 3670) may raise waves, suitable for short Quick Boarding 🚤 . The main journey still favors Buy , waiting for the FED to blow more tailwind into the Golden sails.”

Gold Stuck in 3620–3655 Range – All Eyes on Fed DecisionGold is still consolidating between 3620–3625 support and 3650–3655 resistance, respecting this week’s pivot level around 3632. As highlighted in the weekly outlook, this week’s trading action is likely to remain muted until the FOMC rate decision and press conference on Wednesday.
Until then, we can expect price to stay range-bound, with quick scalps working better than trend trades.
Once the Fed outcome is out, we should see a clearer short-term direction.
A higher-timeframe close above 3655 could open the door for a move toward 3675+ and potentially new highs.
On the flip side, a break below 3620 could trigger a deeper pullback, but so far there’s no sign of reversal pressure bulls remain firmly in control on higher timeframes.

XAUUSD – Pennant Pattern Waiting for ConfirmationXAUUSD – Pennant Pattern Waiting for Confirmation
Hello Traders,
Gold started the week with a strong bounce of nearly 20 dollars after testing the ascending trendline. This move further confirms the Pennant Flag formation that is currently in play. The key now is to wait for a clear breakout from this structure to position trades effectively.
Bullish Scenario
A break above the upper trendline, with confirmation ideally above 3657, would signal continuation of the uptrend.
Best entry: around 3650, targeting 3680 in the short term.
Bearish Scenario
The 3627 level is critical. A breakdown below this zone, along with a close under nearby support, would validate the bearish case.
Traders can either enter directly on the break or wait for a retest around 3630 for a cleaner entry.
Downside targets could extend to 356x or even lower.
Medium-Term Buy Setup
The 3560 – 3564 zone remains an attractive area, aligning with an FVG and strong volume accumulation.
This is a medium-term buying opportunity, with stop-loss placed below 3544.
Requires larger account size (above $1000) due to wider stop distance, but offers higher reward potential while aligning with the broader bullish trend.
This is my outlook for gold today. Traders can take it as a reference and align it with their own setups.
If you trade gold regularly, you can follow me here and join my community to receive updates quickly when the price action changes.
👉 Wishing everyone a profitable and disciplined trading week with Gold.
