XAUUSD: PCE signals strengthen bullish momentumHello traders, let’s take a quick look at XAUUSD today.
The US Core PCE index for this month is projected at just 0.2%, lower than the previous 0.3%. This points to cooling inflation, which reduces the pressure on the Fed to hike rates further. And when rate hike expectations ease, gold usually benefits.
On the H4 chart, XAUUSD is still holding within its uptrend channel. The 3,714 zone is acting as a solid support base for price action. If buying interest continues, gold could retest the 3,823 level and even aim for the upper boundary of the channel.
In short: softer PCE data + strong technical structure = gold has room to push higher in a positive trend.
Xauusd(w)

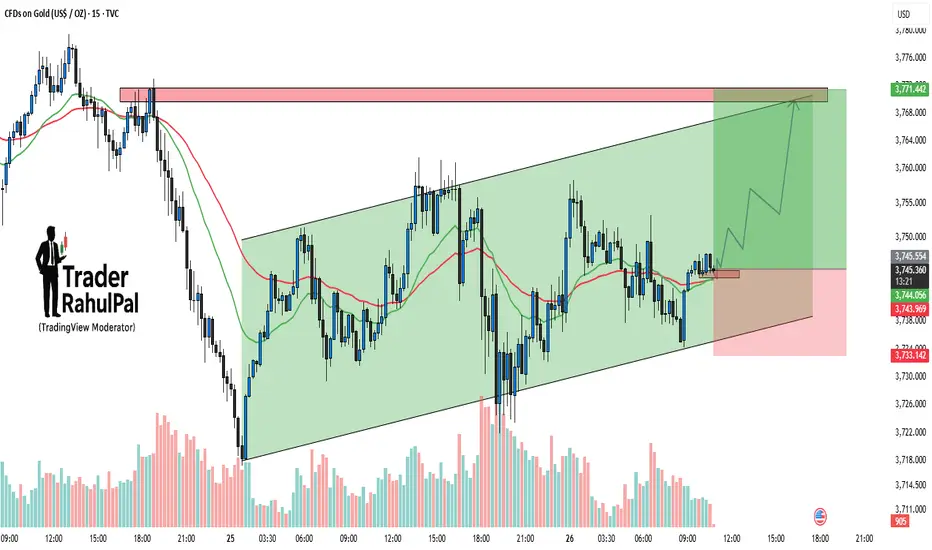
Gold – Channel Support Holding, Upside Target Towards 3770Gold is trading within a well-defined ascending channel on the 15-min chart. Price action has repeatedly respected both support and resistance lines, which makes this pattern highly reliable in the short term. Currently, the price is bouncing from the lower channel support and holding firmly above the 3740–3743 zone. As long as this support area is protected, the bullish momentum remains intact and the next upside target comes in around 3770, aligning with the channel resistance. A breakout above 3770 could trigger an even stronger rally, while a failure to hold below 3733 would invalidate the setup and shift the bias to the downside.
Disclaimer: This analysis is for educational purposes only and should not be taken as financial advice. Please do your own research or consult your financial advisor before investing.
Analysis By @TraderRahulPal (TradingView Moderator) | More analysis & educational content on my profile
👉 If you found this helpful, don’t forget to like and follow for regular updates.
XAUUSD SHOWING A GOOD UP MOVE WITH 1:10 RISK REWARD GOLD SHOWING A GOOD UP MOVE WITH 1:10 RISK REWARD
DUE TO THESE REASON
A. its following a rectangle pattern that stocked the market
which preventing the market to move any one direction now it trying to break the strong resistant lable
B. after the break of this rectangle it will boost the market potential for break
C. also its resisting from a strong neckline the neckline also got weeker ald the price is ready to break in the outer region
all of these reason are indicating the same thing its ready for breakout BREAKOUT trading are follws good risk reward
please dont use more than one percentage of your capitalfollow risk reward and tradeing rules
that will help you to to become a bettertrader
thank you

Wave 5 is about to start – today just time your Buy right!📊 Wave Perspective
The market is still following the scenario of one more wave 5 increase.
It is expected that on Friday morning, the price may move around 3765 to confirm the continuation trend.
After confirmation, there will be 2 important zones to time your Buy for the big wave.
✅ Trading Plan
Zone 1: High Entry – Main Priority
Entry: 3749 – 3751
SL: 3746
TP: 3792
This is the first buying point, suitable for those who want to enter the wave early following the trend.
Zone 2: Backup Entry – Last Support
Entry: 3738 – 3736
Maximum SL: 3730
TP: 3792
This is a strong support zone, if the price breaks zone 1, this will be the "timing" zone to re-enter.
Note: Since this is a backup entry, reduce Lot size, widen SL a bit, and tighten SL when the price matches to optimize risk.
📌 Capital Management Note
Every order must comply with SL to avoid risks.
Prioritize entering orders according to the big wave plan, avoid FOMO.
EA setup: should be set to Only Buy according to the upward wave perspective.
Analysis perspective is for reference only, combine with personal view before entering orders.
🎯 Expectation
If the scenario is correct, the price may complete wave 5 at target 3792.
Upon reaching TP, partial take profit can be done to secure profits.

Traders Watch Gold Surge Ahead of Fed’s Next MoveGold 1H – Consolidation Before Fed Clarity
Gold on the 1H timeframe is currently trading around 3,746, moving within a well-defined consolidation range. Price action highlights a premium supply zone at 3,775–3,773 and a discount demand zone at 3,723–3,725. The market structure shows earlier signs of BOS and ChoCH, with engineered liquidity sweeps becoming evident. A potential Mitigation → Expansion sequence is in play, where a liquidity grab near discount demand could fuel a bullish leg toward premium supply.
From a macro perspective, today’s headlines underscore the cautious stance across financial markets as investors await the Federal Reserve’s upcoming guidance. Lingering inflationary concerns, coupled with speculation around the timing of future rate cuts, have kept volatility elevated. Meanwhile, geopolitical risks continue to underpin safe-haven demand for gold, adding an extra layer of support at discount levels.
This combination of technical liquidity zones and macro uncertainty sets the stage for tactical plays: fading moves into the supply zone while remaining prepared for dip-buying opportunities at defined demand areas.
________________________________________
📌 Key Structure & Liquidity Zones (1H):
• 🔴 SELL GOLD 3,775–3,773 (SL 3,782): Supply zone coinciding with a buy-side liquidity pool above 3,780, offering downside targets at 3,760 → 3,745 → 3,730.
• 🟢 BUY GOLD 3,723–3,725 (SL 3,718): Discount demand aligned with liquidity grab potential, with upside targets at 3,745 → 3,760 → 3,775+.
________________________________________
📊 Trading Ideas (Scenario-Based):
🔻 Sell Setup – Supply Rejection (3,775–3,773)
• Entry: 3,775–3,773
• Stop Loss: 3,782
• Take Profits:
TP1: 3,760
TP2: 3,745
TP3: 3,730
🔺 Buy Setup – Demand Mitigation (3,723–3,725)
• Entry: 3,723–3,725
• Stop Loss: 3,718
• Take Profits:
TP1: 3,745
TP2: 3,760
TP3: 3,775+
________________________________________
🔑 Strategy Note
With the Fed’s next move looming, traders should anticipate engineered sweeps into both premium and discount liquidity pools before the market establishes clearer direction. The tactical edge comes from aligning intraday setups with liquidity hunts:
• Fade supply at 3,775–3,773 if rejection confirms.
• Buy dips into 3,723–3,725 if liquidity is swept cleanly.
The broader narrative of inflation concerns, dollar sensitivity, and safe-haven flows reinforces the case for two-sided opportunities. Expect gold to remain volatile within this consolidation range, with sharp moves likely as liquidity is targeted ahead of Fed clarity.

Gold awaits PCE | EMA squeeze, big waves ahead🟡 XAU/USD – 26/09 | Captain Vincent ⚓
🔎 Captain’s Log – Context & News
Trump : Announced a 100% tariff on branded drugs if not produced in the US → escalating trade tensions.
PCE tonight : The FED’s most important inflation gauge, key to shaping October rate cut expectations (current probability 91.09%).
The market is in “hold breath” mode, awaiting the PCE spark to decide the next direction.
⏩ Captain’s Summary : Gold is squeezed between two winds – short-term EMA pressure and major expectations from PCE.
📈 Captain’s Chart – Technical Analysis
EMA : EMA 34 (yellow) remains below EMA 89 (red) → short-term bearish pressure persists, but narrowing gap signals big volatility ahead.
Golden Harbor (Support / Buy Zone)
3,738 – 3,730
3,718
3,687
3,651
Storm Breaker (Resistance / Sell Zone)
3,755 – 3,773
🎯 Captain’s Map – Trade Plan
⚡ Sell (scalp at resistance)
Entry: 3,773 – 3,776
SL: 3,783
TP: 3,755 – 3,745 – 3,734
✅ Buy (trend-follow priority)
Buy Zone 1 (Scalping)
Entry: 3,72x – 3,718
SL: 3,710
TP: 3,750 – 3,769 – 3,776
Buy Zone 2 (Deeper OB)
Entry: 3,685 – 3,683
SL: 3,675
TP: 3,690 – 3,695 – 3,700 – 3,705 – 3,7xx
⚓ Captain’s Note
“The Golden sails are being squeezed between EMA 34 & 89. Golden Harbor 🏝️ (3,734 – 3,683) remains the safe dock for sailors to await the big wave. Storm Breaker 🌊 (3,773 – 3,776) is raising fierce waves, only suitable for short Quick Boarding 🚤 scalps. Tonight’s PCE will be the decisive wind – either pushing the ship beyond 3,78x or forcing it back to retest 3,72x.”
📢 If you find Captain’s Log useful, don’t forget to Follow for the latest updates.
💬 What do you think? Will Gold break through 3,78x or retest 3,72x first?

Elliott Wave Analysis XAUUSD – September 26, 2025
________________________________________
🔹 Momentum
• D1: Currently decreasing → the corrective trend is likely to continue. It may take about 2 more D1 candles for momentum to enter the oversold zone, after which a reversal could occur.
• H4: Momentum is rising → today we may see a bullish move or sideways range.
• H1: About to enter the oversold zone → a short-term bullish reversal is likely.
________________________________________
🔹 Wave Structure
• D1:
o As analyzed previously, wave 5 (yellow) has already reached its first target at 3789.
o It may take around 2 more D1 candles for momentum to enter oversold → showing that the bearish leg is weakening.
o Considering depth and time, the market is likely within wave 4 of wave 5. Once the correction completes, the uptrend should resume toward the second target.
• H4:
o A WXY corrective structure is developing.
o The ABC (blue) has completed wave W → the market may now be in wave X, followed by a Y-wave decline to finish the correction.
• H1:
o Wave X appears to be forming a triangle, currently in the final wave e.
o However:
If price rises sharply above 3762, it would suggest the corrective phase is already completed.
The target area for wave e is around 3752 → potential Sell zone.
If price breaks below 3729, it confirms wave Y is in play, targeting 3713 and 3698 → potential Buy zones.
⚠️ Note: If the Buy target is reached first, the Sell setup will be canceled.
________________________________________
🔹 Trading Plan
🔻 Sell Zone
• Entry: 3751 – 3753
• SL: 3761
• TP: 3729
________________________________________
🔺 Buy Zone 1
• Entry: 3714 – 3712
• SL: 3704
• TP: 3751
________________________________________
🔺 Buy Zone 2
• Entry: 3699 – 3696
• SL: 3686
• TP: 3751

XAUUSD – Wolfe Waves continue on H4XAUUSD – Wolfe Waves continue on H4, price returns below trendline: prioritise correction scenario
Hello Trader,
Based on the Wolfe Waves structure on the H4 frame and current price behaviour, gold has returned to trading below the trendline, indicating a weakening short-term uptrend and paving the way for a downward correction before the market decides the next trend. The upper zone has created a clear “sell zone”; below, two defensive buy zones appear suitable for both scalping and medium-term.
Main Technical Picture
Wolfe Waves: wave 5 completes near resistance, then price falls back below the trendline — aligning with the correction scenario along Wolfe's target line 1–4.
Trendline & price box zone: the close below the rising trendline indicates “acceptance” below; immediate resistance lies at the 375x–376x cluster (sell zone).
Momentum: H4 MACD slows, histogram narrows → high probability of a pullback – retest before a new decision.
Detailed Trading Scenarios
1) Sell according to correction trend (priority)
Entry: 3756 – 3759
SL: 3764
TP: 3745 → 3732 → 3715 → 3690 → 3672
Reason: the 375x zone coincides with the sell zone + upper trendline; selling at retest offers a good R:R ratio.
Confirmation/Negation: if H4 closes above 3764 and holds, the short-term sell scenario weakens.
2) Buy scalping in buffer zone
Entry: 3701 – 3703
SL: 3695
TP: 3715 → 3732 → 3745 → 3766
Note: this is just a rebound in the correction phase; lock each step and move SL according to TP1.
3) Buy medium-term (strong base zone)
Entry: 3648 – 3651
SL: 3644
TP: 3672 → 3698 → 3708 → 3722 – 3727
Reason: the 365x zone coincides with the demand/accumulation volume on H4; suitable for catching a deep rebound along with the larger trend.
Management: this is a medium-term order, so divide volume, lock each step and move SL to breakeven after TP1.
Refer to my scenario if you find it reasonable, trade accordingly, and if you enjoy trading gold with high-quality scenarios, follow me.

Gold under EMA pressure Buy at support,short scalp at resistance🟡 XAU/USD – Captain Vincent ⚓
🔎 Captain’s Log – Context & News
FED : Probability of a 25bps cut in October is 91.09% → almost certain.
US Calendar today : GDP, Jobless Claims, Durable Goods Orders, and especially speeches from 3 FED officials → strong volatility expected.
Gold yesterday : Dropped deeply but reacted precisely at key support → according to Vincent, this sell-off was mainly due to investors being cautious ahead of tomorrow’s CPI data.
⏩ Captain’s Summary : Short-term waves are pressured by EMAs, but the bigger voyage remains bullish – sailors prioritize Buy at Golden Harbor, only Quick Boarding 🚤 when facing Storm Breaker.
📈 Captain’s Chart – Technical Analysis (H30, EMA 34 & EMA 89)
EMA : EMA 34 (yellow) crossing below EMA 89 (red) → short-term bearish signal.
Trend : Overall still bullish, with Bullish OBs and Buy Zones below acting as strong supports.
Storm Breaker (Resistance / Sell Zone)
3,769 – 3,777 (Bearish OB)
Golden Harbor (Support / Buy Zone)
3,734 – 3,718 (Bullish OB)
3,687 – 3,685 (Buy Zone OB)
3,650 – 3,648 (Deeper Buy Zone, confluence with EMA 89)
🎯 Captain’s Map – Trade Plan
⚡ Sell (short-term scalp)
Entry: 3,776 – 3,773
SL: 3,783
TP: 3,770 – 3,765 – 3,760 – 3,755 – 3,750
✅ Buy (main priority)
Buy Zone 1 (OB)
Entry: 3,687 – 3,685
SL: 3,678
TP: 3,700 – 3,705 – 3,710 – 3,715 – 3,720
Buy Zone 2 (Deeper OB)
Entry: 3,650 – 3,648
SL: 3,638
TP: 3,665 – 3,670 – 3,675 – 3,680 – 3,685
⚓ Captain’s Note
“The Golden sails are facing headwinds from short-term EMAs, but Golden Harbor 🏝️ (3,734 – 3,650) remains a solid support dock. Storm Breaker 🌊 (3,769 – 3,777) is only suitable for short Quick Boarding 🚤 scalps. Tonight, the US sea will bring big waves from data & FED speeches – sailors, tighten your sails and manage trades with discipline.”
📢 If you find Captain’s Log useful, don’t forget to Follow for the latest updates.
💬 Do you have a different view on Gold? Drop a comment and join the crew discussion!

XAUUSD – Need confirmation before placing orders
Hello everyone,
Last week, gold experienced a strong surge, but after hitting the resistance at 378x, a noticeable selling pressure emerged, causing the price to drop and the weekly candle to close in a corrective direction. This indicates a market sentiment of hesitation, especially for those trading on margin, who are more susceptible to fear-driven decisions.
Technical Analysis
Currently, the price is returning to test the trendline around 3752. This is a crucial area where a reactive Buy can be considered, with a safe stop loss placed below 3743. However, this is merely a trade based on crowd psychology, so careful observation of price action is necessary.
In the event the price breaks the upward channel, we will wait for a pullback around 3760 to enter a Sell order. Should this scenario unfold, the downtrend will become clearer, with the target potentially reaching the 366x–367x region.
Additionally, pay special attention to the support area of 3717–3723. This is a significant price zone, and if breached, gold is likely to enter a medium-term downtrend. In this context, a reactive Buy at 3715 could also be a reasonable scalping option for those who prefer short-term trading.
Trading Scenarios
Buy around 3752, SL 3743.
Sell upon breaking the trendline and pulling back to 3760, expecting a decline to 366x–367x.
Buy scalping at 3715, SL 3709, short TP towards 3723–3735.
📌 As the new week begins, be patient and observe the price reactions at key areas to obtain clear confirmation signals before placing orders.
Hopefully, this scenario will be helpful for everyone's trading process. I will continue to share more so that everyone can keep a better track of the market.

LiamTrading – Medium-term Gold Outlook H4Let's prepare the scenario for the new week, folks!
In my opinion, gold in the coming week may start to show a medium-term correction phase. However, it is important to note that nothing is absolutely certain on a larger timeframe. If you are trading intraday, stay closely aligned with price action to ensure higher accuracy.
Gold closed the weekly candle at 3759.85 – a price level that clearly indicates hesitation. The end-of-week session showed a rejection of price increase, mainly due to profit-taking pressure, so it cannot be immediately confirmed that a downtrend will begin.
The upward price channel is still strong, so it is essential to maintain a buying trend mindset to ensure the confidence in holding profits remains firm.
The upward structure is still stable, but the RSI has reflected a weakening in buying sentiment. To confirm a medium-term correction, gold needs to break 3720. At that point, a reasonable strategy would be to wait to sell around 3737–3740 (retracing to the trendline), targeting the support area coinciding with the highest volume profile cluster at 3645.
Conversely, the buying scenario will occur when:
- Price touches the 3735 boundary and a candle rejection reaction appears.
- Or gold breaks above the minor resistance at 3780, in which case you can buy immediately, with expectations towards the 3850 area.
Next week, be patient and wait for market confirmation to increase the probability of success. I will continue to share detailed scenarios in each trading session for everyone to stay updated.

XAUUSD – New Week Scenario on D1 FrameXAUUSD – New Week Scenario on D1 Frame: Prioritise buying, the 3790 – 3720 zone decides the trend
Hello Trader,
Trading is a journey, and the most important destination is conquering oneself.
On the D1 frame, gold has experienced a series of consecutive strong increases, indicating that buyers still maintain the advantage. The buying force shows no clear signs of weakening, even though gold has recently reacted with a slight decrease around 3790. Currently, the price is accumulating around 3760 – the closing candle zone for this week.
Basic Outlook
Political pressure from President Trump on the Fed is increasing, as the market expects an easing move soon. However, Chairman Powell remains cautious, prioritising price stability over inflation issues.
This factor may continue to keep gold in the position of an important safe-haven asset, especially in the context of policy uncertainty.
Technical Outlook
The price zone of 3790 – 3720 will play a decisive role in the medium-term trend for next week.
If 3790 is broken, gold will have the opportunity to advance to the Fibonacci Extension zone of 3822. Further, strong resistance lies around 3840 – 3860.
If 3720 is breached, selling pressure will retest the strategic support zone at 3650. This is also the confluence area with the upward trendline on D1.
MACD Indicator: continues to support buyers, the histogram remains positive, not showing a clear decrease signal.
Volume: no significant selling pressure has appeared, indicating that gold is entering an accumulation phase, waiting for a breakout.
Trading Scenario for Next Week
Buying Scenario (priority):
Buy around 3650 – 3660 (if there is an adjustment).
SL: below 3640.
TP: 3720 – 3790 – 3822.
Selling Scenario at Resistance:
Sell around 3822 – 3830 (Fibo + strong resistance).
SL: above 3840.
TP: 3790 – 3760 – 3720.
Conclusion
In the medium term, the upward trend still prevails. Next week, gold will revolve around the 3790 – 3720 mark, and reactions here will pave the way for the next trend. The priority strategy is to buy at the support zone of 3650, while observing reactions at 3822 to consider short-term selling orders.
Short-term scenarios will be updated during the day, helping you be more proactive with market fluctuations.
Follow me and the community to update the earliest scenarios

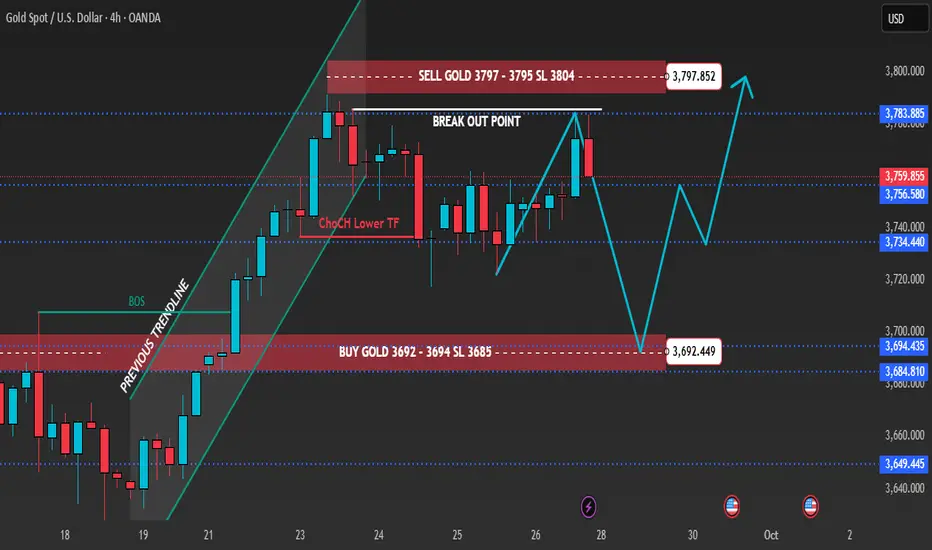
Back to 4H Frame – Fed & Inflation Shape Gold PathGold on the 4H timeframe is consolidating near premium supply after multiple liquidity sweeps. Recent U.S. inflation data kept the dollar resilient, while traders anticipate upcoming Fed commentary for clearer policy direction. Price rejected from the 3,795 supply pocket and is now retracing toward discount demand zones. Market structure suggests engineered sweeps below support before bullish continuation into Q4.
________________________________________
📌 Key Structure & Liquidity Zones (4H):
• 🔼 Buy Zone 3,692 – 3,694 (SL 3,685): Discount demand aligned with liquidity grab, ideal for continuation longs.
• 🔽 Sell Zone 3,795 – 3,797 (SL 3,804): Premium supply pocket where liquidity sweeps may trigger short-term rejections.
________________________________________
📊 Trading Ideas (Scenario-Based):
🔺 Buy Setup – Discount Demand Reaction
• Entry: 3,692 – 3,694
• Stop Loss: 3,685
• Take Profits:
TP1: 3,715
TP2: 3,740
TP3: 3,760+
👉 Smart money may engineer a sweep below 3,694 before reversing higher. Watch for bullish rejection patterns at demand.
🔻 Sell Setup – Premium Supply Reaction
• Entry: 3,795 – 3,797
• Stop Loss: 3,804
• Take Profits:
TP1: 3,780
TP2: 3,765
TP3: 3,750
👉 Short-term liquidity scalp opportunity against trend. Valid if price fails to break above breakout point.
________________________________________
🔑 Strategy Note
Bias remains bullish medium-term, but intraday sweeps into demand zones are expected as Fed officials continue to push cautious monetary guidance. Liquidity hunts around 3,795 supply and 3,694 demand will likely define the week’s volatility before a decisive breakout.
XAUUSD – FIBO MATRIX Trading Plan | Key Levels for TodayMarket Snapshot
Gold is attracting steady buying interest as dovish Fed expectations keep the USD capped near 3-week highs.
At the same time, geopolitical tensions and tariff concerns add to safe-haven demand.
Focus now shifts to US PCE inflation data, which could trigger the next big move.
📍 Important Price Zones (M30)
🔴 SELL Reaction Zones
3767 – 377x → Major rejection area (Fibo 0.786).
3810 – 3817 → Strong SELL zone (Fibo 1.5 – 1.618).
🟢 BUY Support Zones
3725 → First support zone.
3690 – 3695 → Deep pullback support (Fibo confluence).
🎯 Trading Ideas
1️⃣ SELL Setup
Entry: 3767 – 377x (if rejection signal shows).
Targets: 3750 → 3725.
SL: Above 3778.
2️⃣ BUY Setup
Entry: 3725 with bullish confirmation.
Targets: 3760 → 377x.
SL: Below 3715.
3️⃣ Deep BUY Opportunity
Entry: 3690 – 3695 zone.
Targets: 3725 → 3760.
SL: Below 3685.
⚡ Trading Insights
Respect the Fibo reaction levels for clean entries.
Risk range: 6–8 USD to avoid stop hunts.
Book profits in steps: 1R → 2R → 3R for strong RR balance.
💬 Community Talk
Do you see gold breaking above 3770 first, or dropping to 3725/3695 before bouncing back? Share your chart view 👇

XAUUSD – Range 3735–3755 now serves as trend confirmation zoneXAUUSD – Range 3735–3755 now serves as trend confirmation zone
Technical Analysis
Gold (XAUUSD) is moving within a narrow range of 3735–3755, and this price zone currently acts as a “pivot point” to confirm the next direction.
Short-term resistance: 3755–3772, price has reacted strongly multiple times. If not decisively broken, selling pressure may continue.
Key support: 3735, this is the decisive zone – breaking it will confirm a downward trend, targeting lower levels.
Stronger resistance: 3790–3793, confluence of several previous peaks, where strong selling pressure may form.
EMA200 H1 (3723) still supports the major uptrend, but the price has moved far and is now in the phase of retesting supply – demand zones.
RSI (14) around 45–48, not yet in oversold territory but leaning towards the sellers.
From a technical perspective, this is a market phase that requires confirmation: breaking above 3755 will reopen the upward momentum, while losing 3735 will reinforce short-term downward pressure.
Trading Scenarios
Sell Scenario (preferred if resistance holds):
Sell 3769–3772, SL 3775, TP: 3755 – 3746 – 3737
Sell 3791–3793, SL 3798, TP: 3783 – 3772 – 3760 – 3745
Sell when price confirms below 3735, SL 3742, TP: 3726 – 3715 – 3702 – 3690
Buy Scenario (trend-following on breakout):
Buy when price confirms above 3755, SL 3747, TP: 3766 – 3778 – 3790
Buy 3705–3702, SL 3697, TP: 3717 – 3726 – 3744 – 3763 – 3780 – 3790
Price Zones to Watch
3735–3755: trend confirmation range, most important in the short term.
3769–3772 and 3791–3793: strong resistance zones, potential Sell zone.
3702–3705: deep Buy zone, combined with strong support and EMA200.
3790: key resistance level, breaking it will reinforce the major uptrend.
Outlook
The gold market is in a decisive phase at the 3735–3755 range. Sellers have a short-term advantage, but if the price exceeds 3755, the uptrend may soon return. The best strategy is to trade based on price confirmation at key zones, combining profit-taking at each successive TP level to optimise gains.
This is a reference scenario based on technical analysis, not an investment recommendation. Stay tuned for earlier analyses in upcoming sessions.

LiamTrading – Gold may fake a move before dropping
Gold is trading around the 375x region and might exhibit a "fake breakout" upwards before adjusting downwards. The price structure on the H4 chart shows:
Strong resistance is located at the 3770–3773 region, coinciding with the 0.786 – 1.0 Fibonacci extension area. This is a confluence zone prone to a downward reaction.
The main trendline remains upward, but the RSI is gradually weakening, indicating that the buying force is not as strong.
Short-term support is at 3710–3713, also the 0.5 – 0.618 fibo zone, suitable for buy scalping orders.
A larger support area is at 3688–3691, where it converges with the trendline bottom and important Fibonacci, considered a sustainable "buy zone."
Trading Plan Reference
Sell: 3770 – 3773, SL 3778, TP 3756 – 3743 – 3725 – 3710
Buy scalping: 3710 – 3713, SL 3705, TP 3725 – 3736 – 3748 – 3760
Buy zone: 3688 – 3691, SL 3684, TP 3699 – 3710 – 3725 – 3736 – 3745 – 3760
In summary, gold may create a false upward move to the resistance zone 3770–3773 before reversing to adjust. Traders should patiently wait for confirmation signals at key price zones to enter optimal orders and manage risks tightly.
This is my personal view on XAUUSD. If you find it useful, follow for the fastest updates on upcoming scenarios, continuously updated at comulity

LiamTrading XAUUSD Scenario Today Fibo & Volume Profile AnalysisLiamTrading XAUUSD Scenario Today:Fibo & Volume Profile Analysis
Gold, after testing the 375x zone, has shown clear signs of weakening. On the H1 chart, the price structure is forming an adjustment phase aligning with key Fibonacci and Volume Profile levels. This is the time when the market starts to “filter” liquidity, creating opportunities for both short sell orders and buy orders at strong support zones.
Technical Analysis
Fibonacci indicates the 0.786 – 1.0 zone around 3756–3758 coincides with strong resistance and FVG, with a high potential for a reversal.
Volume Profile points out the POC area around 3735–3740, if breached, it will pave the way for deeper downward pressure.
The confluence support zone of 0.618 fibo + large volume around 3688–3691 is suitable for scalping buy.
Further, the area 3648–3651 is reinforced by VAL and the bottom of the volume profile, making it a strong long-term “Buy zone.”
Trading Plan Reference
Sell zone: 3756 – 3758, SL 3763, TP 3750 – 3748 – 3736 – 3710 – 3690 – 3655
Buy scalping: 3688 – 3691, SL 3685, TP 3701 – 3715 – 3728
Long-term Buy zone: 3648 – 3651, SL 3640, TP 3670 – 3688 – 3700 – 3718 – 3733 – 3755
In summary, gold is moving in accordance with the technical structure confirmed by Fibonacci and Volume Profile. Today's scenario prioritises observing reactions around the sell zone 3756–3758 to find short opportunities, and waiting to buy at value zones 369x and 365x for the recovery wave.
This is my personal view on XAUUSD. If you want the fastest updates on the next gold scenarios, follow me and join the community to stay informed.

XAUUSD – The downward trend continues to be prioritisedThe downward trend continues to be prioritised (Wolfe Waves Pattern H4)
Hello Trader,
Gold is following the Wolfe Waves structure on the H4 chart, after bouncing off the upper resistance zone and returning below the trendline. This indicates that the short-term upward momentum has weakened, and the scenario of a downward adjustment continues to be prioritised at this stage.
Technical Analysis
Wolfe Waves are clearly formed, wave 5 has hit resistance and a reversal signal has appeared.
The price failed to hold above the upper trendline, while the MACD shows weakening upward momentum.
The 3746 – 3748 zone is considered the main “sell zone” in the short term.
Nearby support zones: 3709 – 3711 and deeper at 3675 – 3678. Further, the area around 3650 is an important “buy zone” in the medium term.
Trading Scenario
Sell following the trend (priority)
Entry: 3746 – 3748
SL: 3754
TP: 3733 → 3720 → 3702 → 3690
Buy Short-term Scalping
Entry: 3709 – 3711
SL: 3705
TP: 3722 → 3730 → 3745
Buy Deep Support Scalping
Entry: 3675 – 3678
SL: 3670
TP: 3688 → 3696 → 3710 → 3725
Medium-term Buy Zone
Entry: around 3650
This is a high-volume accumulation zone, coinciding with strong support on H4. This area is suitable for considering medium-term buy orders if the price adjusts deeply.
Conclusion
In the short term, the bearish scenario continues to be prioritised, especially when the price remains below the 3748 zone.
Buy strategies should only be considered in the form of scalping or at the important buy zone around 3650.
The current gold market is still in a distribution phase, so patience is needed to observe candle confirmations at entry zones to optimise the R:R ratio.
This is today's XAUUSD trading scenario according to Wolfe Waves on H4. You can refer to and combine with personal strategies for the best risk management.
Follow me to receive the latest scenarios when the price structure changes.

Gold Neowave Stuctural UpdateNamaskaram Everyone
Welcome to intelligent investor, we provide market insights by synchronising and combining all the price action waves from different time frames and gives you single trend.
How To Read My Charts...Click Below
FX:XAUUSD FX:XAUUSD OANDA:XAUUSD MCX:GOLD1!

Gold 1H – Will Gold Correction Extend Toward Discount Zones?Gold on the 1H timeframe is trading close to 3,745 after a series of bearish pushes, with premium resistance placed at 3,780–3,778 and another resistance pocket at 3,748–3,746. On the downside, discount demand is noted at 3,713–3,706, with a deeper support near 3,665. Recent CHoCH signals highlight short-term bearish bias, indicating that liquidity sweeps into resistance zones may occur before price retraces towards discount areas.
Today’s headlines around renewed U.S. inflation concerns and expectations of a slower Fed pivot are dampening sentiment, while geopolitical tensions in the Middle East continue to support safe-haven bids. This combination is likely to keep intraday volatility elevated, with liquidity grabs around resistance zones expected before a clearer directional move emerges.
________________________________________
📌 Key Structure & Liquidity Zones (1H):
• 🔴 SELL GOLD LIQUIDITY 3,780–3,778 (SL 3,787): Premium resistance where sweeps may trigger rejection toward 3,760 → 3,740 → 3,730.
• 🔴 SELL GOLD 3,748–3,746 (SL 3,755): Intraday resistance aligned with 0.5–0.618 retracement, targeting 3,730 → 3,720 → 3,715.
• 🟢 BUY ZONE 3,697–3,699 (SL 3,692): Discount demand with liquidity confluence, offering upside targets at 3,715 → 3,730 → 3,745+.
________________________________________
📊 Trading Ideas (Scenario-Based):
🔻 Sell Setup – Liquidity Run (3,780–3,778)
• Entry: 3,780–3,778
• Stop Loss: 3,787
• Take Profits:
TP1: 3,760
TP2: 3,740
TP3: 3,730
🔻 Sell Setup – Intraday Rejection (3,748–3,746)
• Entry: 3,748–3,746
• Stop Loss: 3,755
• Take Profits:
TP1: 3,730
TP2: 3,720
TP3: 3,715
🔺 Buy Setup – Discount Demand (3,697–3,699)
• Entry: 3,697–3,699
• Stop Loss: 3,692
• Take Profits:
TP1: 3,715
TP2: 3,730
TP3: 3,745+
________________________________________
🔑 Strategy Note
With U.S. inflation concerns and geopolitical risks creating mixed drivers for gold, intraday strategies can look to fade liquidity sweeps into premium resistance while keeping an eye on buy opportunities from well-defined discount demand zones. Expect sharp moves around 3,780 liquidity grabs before corrections extend down into the 3,713–3,706 area.

XAUUSD Facing Downward PressureHello traders, XAUUSD is currently facing downward pressure following recent economic news. The lower-than-expected unemployment claims data suggests economic stability, reducing the demand for gold. The higher-than-expected PCE core index increases the likelihood that the Fed will maintain high interest rates, putting pressure on gold prices. While the US GDP remains stable , there is no strong breakthrough.
Technically, XAUUSD is in an uptrend but has encountered resistance at $3,790 . The price of gold is currently testing support at $3,700. If this level is broken, gold could fall to the $3,635 region.
Given the current fundamental and technical factors , the likelihood of XAUUSD continuing to decline is high. If support doesn't hold, gold could continue to drop.
Wishing you successful trading!

Hi Traders, Anfibo here!Hi Traders, Anfibo here!
Market Overview – XAUUSD
Gold (XAUUSD) is currently holding steady within the H4 bullish channel, showing that the overall uptrend remains intact. While there has not been a major breakout in recent sessions, the technical structure still suggests buyers have the upper hand.
That said, the market is slowing down around a key resistance zone. For short-term opportunities, it’s important to focus on reactions at support and resistance levels to capture profits effectively.
Key Levels
Support: 3748 – 3733 – 3703
Resistance: 3768 – 3777 – 3788 – 3799
Trading Plan for Today
Sell Scalp Setup
Entry: 3770 – 3765
Stop Loss: 3780
Take Profit: 3720 – 3705
Buy Zone Setup
Entry: 3700 – 3705
Stop Loss: 3695
Take Profit: 3760 – 3800
⚠️ Always use stop-loss and follow strict money management rules to protect your capital.
Wishing you all successful trades!

Every time gold falls back, it is to reboundGold is no longer in a one-sided rally. Technically, it's undergoing a major correction. Our strategy is to follow the trend and prioritize both long and short positions. Now that we're seeing a major trend, the most common question we receive is whether a major decline has begun or whether gold has peaked. Yesterday's daily chart closed with a negative candlestick pattern, and the previous trading day also saw a vague tombstone candlestick pattern. Currently, we can only confirm short-term resistance, but we can't confirm a major trend peak or a bullish weekly trend. Furthermore, the short-term correction hasn't disrupted the bullish trend, so today we'll maintain a long strategy on pullbacks.
From a 4-hour analysis, effective support remains near the 3718-23 area, with upward pressure focused on the 3756-65 area. Our strategy is to primarily buy on pullbacks. In the intermediate range, be cautious and watchful.
Gold Trading Strategy:
Buy on pullbacks to the 3718-23 area, with a stop-loss at 3709 and a target of 3756-3765.
