Gold Range Compression — Breakout Imminent🟥 Resistance Zone (Key Supply Zone): 4028 – 4045
Price has tested this zone multiple times but failed to break through.
A clean break above this red zone will signal strong bullish continuation.
🟦 Support Zone (Key Demand Zone): 3995 – 4005
This is the immediate support keeping price from falling lower.
A break below this blue zone will confirm bearish momentum.
✅ Bullish Scenario
If price breaks and retests the red zone (4028–4045):
Expect upward continuation
Target 1: 4060
Target 2: 4095 – 4105
This matches the upward blue arrows on your chart.
✅ Bearish Scenario
If price breaks below 3995 and retests the blue zone as resistance:
Expect strong downward momentum
Target 1: 3960
Target 2: 3925
This matches the downward blue arrows shown.
✅ Current Bias
Market is neutral right now — sitting between support and resistance.
A breakout from either zone will decide the next direction.
Xauusdanalysis

Gold Pauses Below $4,000 as Markets Digest Hawkish Fed Tone🔍 Market Context
Gold struggles to find direction in early Asia, hovering just below the $4,000 psychological level after the Fed’s hawkish remarks dampened bullish momentum.
Chair Jerome Powell reaffirmed that another rate cut this year is “not a given”, keeping yields supported and safe-haven demand balanced.
Meanwhile, ISM Manufacturing PMI fell to 48.7, signalling cooling momentum but not enough to alter the Fed’s cautious stance.
With odds of a December rate cut near 70%, gold remains trapped between policy uncertainty and soft macro sentiment.
📊 Technical Outlook (H1–H4)
Price is consolidating within a tight structure between 3,963$ and 4,024$, showing compression before a potential expansion move.
The 3,984$–3,963$ zone acts as short-term liquidity support, aligning with the rising intraday trendline.
Key Levels
• 💎 Liquidity Support: 3,963$ – 3,984$
• 🎯 Immediate Resistance: 4,024$
• ⚙️ Bullish Target: 4,046$ (liquidity sweep + expansion zone)
• ⚠️ Invalidation: Below 3,923$, bias shifts to neutral
A clean breakout above 4,024$ could trigger a move toward 4,046$, while failure to hold above 3,963$ may invite another liquidity grab before buyers re-enter.
🎯 MMFLOW View
Smart money remains patient.
As long as 3,963$ holds, dips are seen as accumulation rather than weakness.
But conviction only returns when liquidity confirms above 4,024$ — that’s where momentum aligns with intent.
⚜️ MMFLOW Insight:
“Liquidity doesn’t chase price — it creates the path for it.”

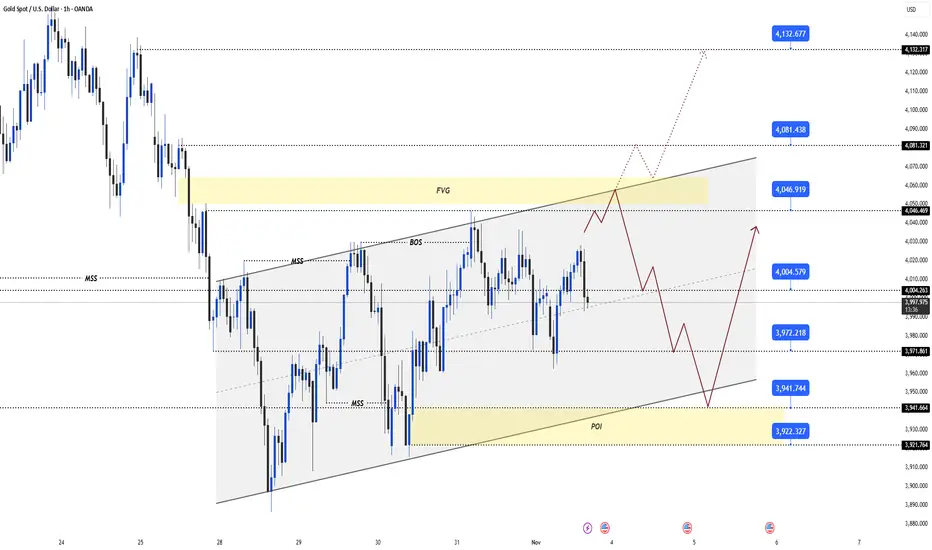
Elliott Wave Analysis – XAUUSD | November 04, 2025
🔹 Momentum
D1 timeframe:
D1 momentum has entered the overbought zone — this signals that the bullish momentum is weakening and a potential reversal could occur today or tomorrow.
H4 timeframe:
H4 momentum is currently in the oversold zone and preparing for a bullish reversal. This suggests that the market may produce 4–5 consecutive bullish H4 candles to lift momentum back toward the overbought region.
H1 timeframe:
H1 momentum is also turning upward, indicating that a short-term bullish phase may be forming.
________________________________________
🔹 Wave Structure
D1 timeframe:
A WXY corrective structure is forming. Wave W appears to be completed, and the current move is part of wave X.
However, this X wave seems relatively shallow, and with D1 momentum already in the overbought zone, there’s likely only one final upward push left to complete wave X before a possible reversal.
H4 timeframe:
Given that D1 is already overbought, the yellow wave (4) scenario remains the primary outlook.
Still, since H4 momentum is about to turn upward, there’s a high probability of one last upward movement to finish wave X before resuming a downward move.
H1 timeframe:
On H1, price action is forming a red WXY structure for wave X.
Wave W has already completed, and price is currently developing within wave X (red).
Inside this X wave, a black abcde triangle is taking shape, with price currently hovering near the lower boundary (ac line) of the triangle.
• If wave e (black) ends near the ac line, the triangle pattern will be complete → price is expected to break above the upper boundary, triggering an upward continuation as wave Y.
→ This aligns with the bullish reversal signals seen in H4 and H1 momentum.
• Conversely, if price breaks below the ac line and drops under 3927, it would suggest that the purple X wave on D1 has already completed, and the market may resume a downtrend following D1 momentum.
________________________________________
🔹 Trading Plan
• Buy Stop: 4000
• Stop Loss: 3973
• Take Profit 1: 4050
⚠️ Note: The current candle range is quite wide → stop loss is relatively large, so it’s advisable to reduce position size and manage trades carefully.

GOLD TRADING INSIGHTS TODAY WITH LUCYGOLD TRADING INSIGHTS TODAY WITH LUCY 💛
Hello everyone 🌸
The gold market (XAUUSD) today is showing many interesting signals as the price continues to test the crucial trendline area. Traders' sentiment is quite cautious at the moment – both buyers and sellers are “squaring off” around the liquidity balance zone.
🔍 Technical Analysis
On the chart, gold is moving within a narrowing triangle price channel – this indicates momentum is accumulating, and when the price breaks in either direction, the subsequent volatility will be very strong ⚡
Currently, the price is reacting around the main trendline, but there is no clear breakout signal yet.
In my personal view, the probability of a decline remains higher, however, further confirmation is needed before entering a trade.
The important point to note is the support area at 3965, which is the key boundary to confirm a clear downtrend.
If the price breaks through this area, the possibility of extending towards the Fibonacci 2.618 area around 3890 is entirely possible.
⚙️ Price Levels to Watch
Currently, the 3990 – 4012 area is short-term resistance, where sellers may reappear.
Meanwhile, the 3965 – 3945 – 3920 areas are the main supports that need close observation.
If the price continues to hold above 3945, the likelihood of a short-term rebound is quite high.
🎯 Today's Trading Scenario
💼 Buy: 3945
⛔ SL: 3938
🎯 TP: 3958 – 3977 – 3992 – 4012
💼 Sell: When the price clearly breaks below support 3965
⛔ SL: Above the breakout area
🎯 Expected TP: extending towards the Fibonacci 2.618 area around 3890
I still prefer to observe the price reaction at the trendline area, and only act when there is clear confirmation — because in a triangle pattern, the patient one will always be the winner 🌙
⚠️ Note & Conclusion
The above analysis reflects only Lucy's personal perspective, based on Trendline – Fibonacci – ICT factors 📊
This is not investment advice.
Please share your views on gold in the comments section 💬
And don't forget to follow Lucy for daily updates on insightful analyses —
where technical analysis merges with market emotions 💫🌸

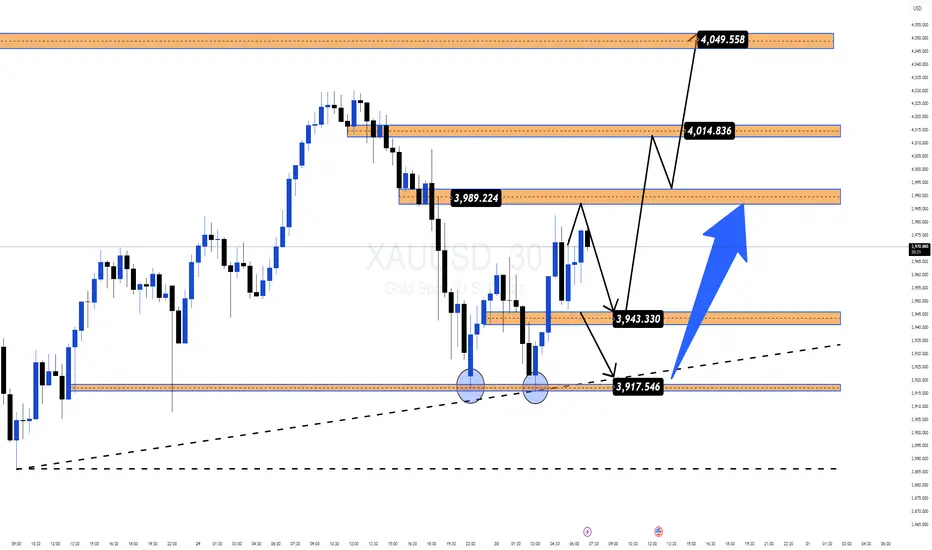
XAU/USD – Gold Accumulating Before Breakout, Target 4,096 USD🔍 Market Context
Gold is trading within a symmetrical triangle pattern , indicating short-term accumulation before forming a new breakout wave.
Following a sharp decline from the peak region of 4,096 USD, the market has shown two instances of Change of Character (ChoCH) – early signs of buying pressure returning.
As long as the price holds above the 3,959 – 3,917 USD zone, the short-term bullish structure remains intact. This support zone acts as a crucial “discount zone” in the current accumulation cycle.
💎 Key Technical Zones
• Support Zone 1: 3,959 USD → main structure holding zone, coinciding with the lower trendline.
• Support Zone 2: 3,917 USD → final liquidity reaction zone.
• Resistance Zone: 4,040 USD → potential break & retest zone.
• Liquidity Zone: 4,096 USD → expansion target if the peak is breached.
🎯 Trading Scenarios
1️⃣ BUY Setup – Prioritise bullish structure
• Entry: 3,959 – 3,917 USD
• Stop Loss: 3,905 USD
• Take Profit:
– TP1: 3,985
– TP2: 4,040
– TP3: 4,072
– TP4: 4,096
✳️ “Buy the discount” – prioritise buy orders at the confluence support zone of trendline + FVG to follow the SMC flow.
2️⃣ SELL Scalp – Secondary strategy when price reacts at the peak
• Entry: 4,096 USD
• Stop Loss: 4,108 USD
• Take Profit:
– TP1: 4,072
– TP2: 4,040
– TP3: 3,985
✳️ “Sell the premium” – only activate if there is a strong price rejection signal at the liquidity peak.
💬 Summary
The short-term trend of gold remains bullish as the price stays above the trendline and continuously forms higher lows.
The main strategy is buy the dip – sell reaction around the 3,959 → 4,096 USD zone.
The confirmation of a strong uptrend will be when the price closes steadily above 4,040 USD .
“Smart money accumulates in silence before the market makes noise.”
⏰ Time Frame: 1H
📅 Update: 03/11/2025
✍️ Analysis by: Captain Vincent

GOLD (XAU/USD): ISM DHAMAKA Awaited! Ready for the Big Move, BosI. MACRO KA SCENE (Current Situation):
Mind you, Gold is in a TIGHT SPOT, caught between two heavy-duty forces:
⬆️ BULL CASE (Buy Power): Safe-Haven demand is on because of US Political TENSION (shutdown issues) and global uncertainty (like that Nvidia chip drama). Good for paisa up.
⬇️ BEAR CASE (Sell Power): USD is showing STRENGTH! Hawkish Fed guys are pushing rate cut hopes away, which is putting pressure on our Gold.
🔥 MAIN GAME-CHANGER: The US ISM Manufacturing PMI tonight. This data is the main trigger for the next BIG move. Wait and watch, folks!
II. APNA TRADING PLAN (Actionable Zones):
We are sticking to two high-probability zones. Remember: Only trade after proper Price Action Confirmation! No JUMPING.
🔴 SELL SCENARIO
SELL ZONE (Supply/FVG): $4,050 - $4,055
Reason: We're hunting a SOLID rejection where the Smart Money (Bade Khiladi) is waiting to sell off.
SL (Stop Loss): $4,065
TP Targets (Book Profit): $4,045 - $4,035 - $4,025 - $4,015
🟢 BUY SCENARIO
BUY ZONE (POI/Demand): $3,952 - $3,948
Reason: Looking for the market to find STRONG support here and give a sharp bounce.
SL (Stop Loss): $3,940
TP Targets (Book Profit): $3,958 - $3,968 - $3,978 - $3,988
🚨 FINAL WORD (Very Important, Yaar!):
Risk Management is the ultimate key. Boss, wait for a CLEAR Price Action Confirmation in these zones. NO gambling on the news release.
#XAUUSD #Gold #ISM #PriceAction #TradingIndia #ForexIndia #IndianTrader #SmartMoneyConcept #USD #SafeHaven #Paisa
LiamTrading - $XAUUSD$: Second Scenario – BUY UP Priority ...LiamTrading - OANDA:XAUUSD $: Second Scenario – BUY UP Priority After BREAKING RESISTANCE $4002$
With the Support of the US Treasury Secretary
Hello traders community, LiamTrading is back with detailed OANDA:XAUUSD $ analysis for the start of the week!
The Gold market is receiving strong support from policy: US Treasury Secretary Scott Bessent calls on the Fed to continue cutting interest rates as the PCE inflation is currently at $2.7\%$.
This call, aimed at reducing mortgage rates and supporting the housing market, strengthens the long-term outlook for Gold.
Technical Analysis: We prioritize continuing to buy up following the main trend. The best strategy is to enter orders at strong resistance/support zones to ensure the lowest risk.
📰 MACRO FUNDAMENTALS: CALL FOR RATE CUT
Impact: The Treasury Secretary's statement on cutting interest rates to support the "transitioning" economy increases expectations of policy easing, which is a strong support factor for Gold (although not yet an official decision).
Suitable Strategy: Market sentiment is being driven by expectations of easing policy, reinforcing the priority for a BUY (Long) position.
📊 TECHNICAL ANALYSIS: IMPORTANT PIVOT POINT
Resistance Zone $4002$: This area acts as an important pivot point.
Buy Entry will be triggered after the price breaks resistance $4002$ and retests.
Sell Entry: Look for short-term scalping at the resistance zone $4030$ to secure profits. Highlighted Zone: Prioritize entering orders at confirmed Trendline zones.
🎯 DETAILED TRADING PLAN (ACTION PLAN)
We will wait for Gold to break structure and create a BUY setup.
🟢 Main BUY Scenario (BUY Break & Retest)
Logic: Buy at $4002$ after breaking resistance and retesting, leveraging new upward momentum.
Entry (BUY): $4002$
SL: $3995$ (tight SL)
TP1/TP2: $4020$ | $4035$
TP3: $4070$
🔴 SELL Scalping Scenario
Logic: Short-term scalping at the strong resistance zone $4030$ (near Sell Liquidity zone).
Entry (SELL): $4030$
SL: $4038$
TP1/TP2: $4015$ | $4004$
TP3: $3990$
📌 SUMMARY & DISCIPLINE (Liam's Note)
Our BUY strategy is reinforced by policy outlook and technical break at $4002$. Strictly adhere to SL $3995$ to manage risk before the upward structure is confirmed.
Are you ready for Gold's movement at $4002$? Please LIKE and COMMENT!

Elliott Wave Analysis – XAUUSD | November 3, 2025
🔹 Momentum
D1 Timeframe:
Daily momentum is currently rising and approaching the overbought zone.
At the current pace, it is expected that within 2–3 more D1 candles, momentum will reach the overbought area — increasing the risk of a potential reversal.
However, in the short term, the bullish trend still dominates.
H4 Timeframe:
H4 momentum is reversing upward, and if a strong bullish candle breaks above the 4028 resistance level, it will confirm a bullish reversal, potentially leading to a 5-candle H4 uptrend within today’s session.
H1 Timeframe:
H1 momentum is preparing to turn downward, suggesting a short-term pullback may occur before the next upside continuation aligned with the broader H4 trend.
________________________________________
🔹 Wave Structure
D1 Timeframe:
Current data still supports the scenario that the market is forming Wave (4) in yellow.
However, more time is needed for a clear confirmation.
If D1 momentum enters the overbought zone without price creating a new high, that would give us additional confirmation of this wave count.
In the short term, price may continue rising for another 2 days.
H4 Timeframe:
The scenario of Wave (4) in purple within Wave (3) in yellow remains valid and has not been invalidated.
If price breaks above the 4379 high, it would confirm the formation of Wave (5) in purple, signaling the start of a strong bullish move.
At present, price movement remains choppy and overlapping, showing no clear trend direction — hence, we need to monitor price action closely.
With H4 momentum turning upward and resistance around 4028 forming a symmetrical triangle pattern, I expect a bullish move of 4–5 H4 candles today.
A decisive breakout above 4028 would further reinforce this bullish scenario.
H1 Timeframe:
The current H1 structure may be forming either:
• Wave X within the larger D1 structure, or
• Wave (5) in purple within the H4 structure.
In either case, we can expect a short-term upward move in line with H4 momentum.
Currently, price is hovering around the 4017 resistance zone, while H1 momentum is preparing to turn downward — therefore, a short-term correction toward the 3953 liquidity zone is expected.
This area will serve as a potential buy zone.
________________________________________
🎯 Trading Plan
• Buy Zone: 3954 – 3952
• Stop Loss: 3944
• Take Profit 1: 4050

LiamTrading - $XAUUSD$: NEW WEEK TRADING SCENARIO...LiamTrading - OANDA:XAUUSD $: NEW WEEK TRADING SCENARIO – PRIORITISE SELLING After BREAKING THE TRENDLINE
Hello traders community,
The new week opens with a clear strategy: Prioritise SELLING after Gold has broken the previous upward trendline.
Although fundamental economic news (like interest rate policies and politics) supports Gold potentially reaching the $5,000$ USD mark, we must trade according to the current Price Action. The technical selling pressure is strong. We will SELL at key resistance zones and continue SELLING as the price breaks the downward structure.
📰 FUNDAMENTALS & LONG-TERM OUTLOOK
$5,000$ Prospect: Fundamental and political factors continue to support the scenario of Gold reaching $5,000$ USD in the long term (due to geopolitical risks and potential loss of Fed independence).
Short Term 🔴: Gold is under technical selling pressure after breaking through the $4,000$ USD mark.
📊 TECHNICAL ANALYSIS: TRENDLINE BREAK
Structure: Gold has exited the upward price channel and is retesting the broken trendline.
Priority: SELL at the retest resistance zone $4024$.
🎯 DETAILED TRADING PLAN (ACTION PLAN)
🔴 SELL Scenario (SELL Primary) - Preemptive Resistance
Entry 1: $4024$ (Sell retest trendline zone)
SL: $4032$
TP1/TP2: $4012$ | $4000$
TP3: $3989$
Entry 2 (Continuation SELL): When price breaks the next trendline at $3992$
SL: $4000$
TP: $3940$
🟢 BUY Scenario (BUY Reversal) - Buy at Strong Support
Logic: Only buy when price hits strong liquidity support, potential for a short-term rebound.
Entry (BUY): Around $3960$ (Buy Scalping Zone)
SL: $3954$
TP1/TP2: $3972$ | $3988 FWB:TP3 : $4000$
📌 SUMMARY & DISCIPLINE (Liam's Note) Don't let the $5,000$ USD prospect affect short-term risk management. Trade according to Price Action. Adhere to SL and prioritise SELL positions at resistance zones.
Are you ready for the SELL strategy at the start of this week?

GOLD: US Fed is Not Giving Up! Big Selling Zone is Activated.Hello, Traders! It's a crucial time, yaar! Gold is at a major crossroads. The pressure from the US Fed is real, and it’s lining up perfectly with our key price levels. Let’s do a quick scan of the market.
I. FUNDAMENTALS: The Big Boss (The Fed) is Hawkish 📰
Main Reason for Bears: The US Fed officials are not interested in rate cuts for now. They are very much "hawkish" due to inflation concerns. This has crushed market optimism.
The Direct Impact: Higher US interest rates mean the Dollar is strong and mighty. For a non-yielding asset like Gold, this is a major negative signal.
Long-Term View (The Hope): Don't lose heart completely! Big institutions still see Gold climbing (like Morgan Stanley projecting $4,300/oz by 2026). So, current dips are good for long-term accumulation.
II. TECHNICAL ANALYSIS: The Supply-Demand Game 🎯
The H4 chart is showing a confirmed DOWNTREND. The recent small rally is just a necessary pullback to test the sellers' power before the next big drop.
1. Primary Strategy: GO SHORT (Following the Main Trend)
The Hot Selling Zone: $4,059 to $4,085. This is our Supply Area where the institutional players are likely waiting. This level is key.
Action Plan: Wait for Gold to enter $4,059 - $4,085. Look for a solid rejection (a strong reversal candle) to confirm your SHORT entry.
Final Target (TP): Our main target is the Strong Demand Zone at $3,939 - $3,952.
2. Counter-Trend Strategy: The Bounce Level
Crucial Buying Zone: $3,939 - $3,952. This is a major support level.
Action Plan: If the price really drops here, you can watch for a quick long entry for a bounce, but maintain tight stop-loss.
🔑 Final Verdict
Best Bet: We must look for a SELL near the $4,059 - $4,085 Supply Zone. Everything is lining up for a continued downside move. Risk management is paramount, okay?
What's your plan for Gold? Will the market respect the $4,085 level? Tell me in the comments! 👇
#XAUUSD #GOLD #FED #TechnicalAnalysis #ForexTrading #SupplyAndDemand #Bearish #TradingStrategy #IndianTrader #MarketAnalysis

technical analysis for your chart on Gold (XAU/USDCurrent Price: $4,002
Trend Structure: The pair is showing a potential reversal setup after a completed downward channel.
Recent Pattern: Price has broken slightly above the descending channel and is now retesting the breakout zone around the support level ($3,950–$3,980).
🔹 Key Technical Levels
Support Zone: $3,940 – $3,980
→ Strong accumulation area shown by multiple rejections and previous demand.
Immediate Resistance: $4,080 – $4,120
→ Minor resistance expected as the first hurdle after breakout.
Major Resistance (Target): $4,385
→ Marked as the final bullish target on the chart.
📈 Bullish Scenario
If price sustains above $4,000, we can expect:
A short-term retest of $4,080–$4,120.
Once momentum confirms above $4,120, bullish continuation toward $4,200 → $4,385 (main target).
✅ Buy Confirmation:
Break and close above $4,050 with volume.
Retest of $4,000 zone followed by bullish rejection candle.
🎯 Bullish Targets:
TP1: $4,080
TP2: $4,200
TP3: $4,385
📉 Bearish Scenario
If price rejects $4,000 and closes below the support zone ($3,950):
Downside may resume toward $3,880 – $3,820 range.
That would invalidate the bullish breakout and confirm channel continuation.
🚫 Sell Trigger:
3H close below $3,940.
🎯 Bearish Targets:
TP1: $3,880
TP2: $3,820
📊 Conclusion
Structure is shifting from bearish to bullish after a channel breakout.
The $3,950–$4,000 area is key — a stronghold for bulls.
Expect a bullish rally if support holds, targeting $4,385 in the medium term. NSE:NIFTY1! NSEIX:NIFTY1! MCX:GOLD1! MCX:CRUDEOIL1! MCX:NATURALGAS1! MCX:SILVER1! NSE:BANKNIFTY1! CME_MINI:NQ1! MCX:GOLDM1! COMEX:GC1! MCX:SILVERM1! MCX:GOLDPETAL1!

XAU/USD – Gold Maintains Short-Term Uptrend, Target $4,108🔍 Market Context
Gold continues to uphold a short-term uptrend structure after forming a clear Change of Character (ChoCH) around the 3,926 USD zone.
Buyers are in control as prices consistently create higher lows and react positively at the Order Block + Supporting Trendline zone.
As long as prices remain above the 3,940–3,926 USD area, the uptrend structure is preserved.
💎 Key Technical Zones
• Order Block Bullish: 3,926 USD → main support zone, confluence with rising trendline.
• Fair Value Gap (FVG): 3,942 – 3,972 USD → potential liquidity absorption zone.
• Resistance Zone: 4,032 USD → short-term resistance, needs to be broken to confirm continued uptrend.
• Liquidity Zone: 4,108 USD → expansion target if the above resistance is breached.
🎯 Trading Scenarios
1️⃣ BUY Setup – Prioritise catching the retracement from support zone
• Entry: 3,942 – 3,926 USD
• Stop Loss: 3,910 USD
• Take Profit:
– TP1: 3,972
– TP2: 4,032
– TP3: 4,064
– TP4: 4,108
✳️ “Buy the discount” – Prioritise orders in the confluence zone of OB + FVG to follow Smart Money flow.
2️⃣ SELL Scalp – Short-term at resistance zone
• Entry: 4,032 – 4,048 USD
• Stop Loss: 4,060 USD
• Take Profit:
– TP1: 4,010
– TP2: 3,972
– TP3: 3,942
✳️ “Sell the premium” – Activate only if clear price rejection signals appear at resistance.
💬 Summary
The current structure still leans towards bullish short-term with the 3,926 USD zone as the key invalidation zone .
As long as prices stay above the trendline, the immediate target is the 4,108 USD liquidity zone.
Optimal strategy: Buy on dip – Sell on reaction.
“Smart Money buys fear, sells greed — follow the footprints, not the noise.”
⏰ Timeframe: 1H
📅 Update: 31/10/2025
✍️ Analysis by: Captain Vincent

XAU/USD – Gold Eyes 4,100$ as Safe-Haven Demand Holds Firm🔍 Market Context
Gold continues to attract buyers for the second consecutive day, as renewed safe-haven demand supports a modest recovery from last week’s lows near 3,890$.
While the Fed’s hawkish stance keeps the Dollar firm, concerns over a prolonged US government shutdown and weaker macro sentiment have limited further USD gains — allowing gold to stabilize above the 3,970–3,990$ zone.
Still, with mixed fundamentals in play, traders remain cautious ahead of next week’s US data releases and policy speeches.
📊 Technical Outlook (H1–H4)
Gold has successfully broken its short-term downtrend, reclaiming momentum from the 3,933–3,973$ liquidity zone.
Price is now consolidating below the psychological 4,000$ handle, forming a clean breakout–retest structure.
Key Levels:
• Immediate Support: 3,973$ – 3,933$ (Breakout & Retest Zone)
• Resistance 1: 4,035$ – 4,050$
• Resistance 2 / Target: 4,114$ – 4,127$ (Fibo 1.618 extension)
• Extended Bull Target: 4,148$+ if momentum sustains
Invalidation: A breakdown below 3,930$ would invalidate the bullish scenario and re-open short-term downside liquidity toward 3,890$.
🎯 Trading Outlook
If gold holds the breakout above 3,970$, the bias remains bullish —
buyers may continue driving price toward 4,100$+, aligned with fib extensions and prior supply structure.
However, any hawkish narrative from Fed speakers could trigger intraday pullbacks before continuation.
⚜️ MMFLOW Insight:
“Smart money never rushes the breakout — it builds conviction where liquidity confirms direction.”

LiamTrading - XAUUSD: Outlook $5,000 USD and Priority BUY... LiamTrading - XAUUSD: Outlook $5,000 USD and Priority BUY Strategy at POC $3973
Hello traders community,
Gold is positioned between an extremely optimistic long-term outlook (forecast $5,000 USD in the next 12-18 months by Bank of America) and short-term technical adjustments.
Although Gold has broken the upward trendline, a sustainable downward trend has not been confirmed.
BUY positions are still prioritised!
🔥 LONG-TERM CONTEXT & INFLATION
Long-Term Push: Gold prices adjusted for inflation have DOUBLED in the past 4 years.
Highlight: Gold reinforces its role as an anti-inflation asset as real prices soar to all-time highs.
📊 DETAILED TRADING PLAN (ACTION PLAN)
Strategy: Buy at POC Zone to leverage liquidity advantage.
🟢 BUY Scenario (BUY Primary) - Buy at High Value Zone
Logic: The $3973 - 3975$ zone is right above the Buy POC (highest value zone).
Entry (BUY): $3973 - 3975$
SL: $3968$
TP1: $3988$ | TP2: $4000
Buy Up Target 2: Buy when price retests the trendline around $4002$.
🔴 SELL Scenario (SELL Scalping) - Preemptive strike at resistance zone
Entry (SELL): $4032 - 4034$
SL: $4040$
TP1: $4022$ | TP2: $4015
📌 SUMMARY & DISCIPLINE (Liam's Note)With the $5,000 USD forecast and inflation factors, the risk of SELL is increasing.
Focus on BUY at POC $3973$ and absolute SL.
Trade responsibly and with discipline!

XAU/USD — Rejection Expected from Resistance Zone for Bearish CoCurrent Price: $4,005
Resistance Zone: $4,020 – $4,040
Gold is approaching a strong resistance area that previously triggered a pullback.
Trend Structure:
The market is moving inside a short-term ascending channel, but momentum shows signs of exhaustion near the upper boundary.
Key Observation:
A false breakout or rejection at the resistance could initiate a downward correction.
Bearish Signal Setup:
Entry Zone (Sell): $4,015 – $4,035 (look for rejection candles or bearish engulfing near resistance)
Target 1: $3,960
Target 2 (Main Target): $3,913
Stop Loss: $4,045 above resistance zone EUREX:FDAX1! ICEEUR:RC1! ICEEUR:BRN1! ICEEUR:WBS1! EUREX:FESX1! EUREX:FGBL1! EUREX:FDXM1!
Risk/Reward Ratio: Approx. 1:2.5
Confirmation:
Wait for bearish confirmation candle on 15M or 30M timeframe.
Break below $3,980 will strengthen bearish momentum toward target.
Signal Summary (📉 Sell Setup):
Direction Entry TP1 TP2 SL ICEEUR:Z1! ICEEUR:W1! EUREX:FGBM1! EUREX:FGBS1! EUREX:FGBS1! ICEEUR:GWM1! EUREX:FXXP1! EUREX:DOWF1! ICEEUR:XZ1!
🔻 SELL 4,015 – 4,035 3,960 3,913 4,045

🇺🇸 IMPACT OF FED AFTER FOMC DECISION🇺🇸 IMPACT OF FED AFTER FOMC DECISION
Hello traders,
The latest Federal Reserve rate decision shook global markets — pushing Gold (XAUUSD) and Bitcoin lower while the US Dollar strengthened sharply.
The Fed cut interest rates for the second time this year, bringing them down to 3.75%–4%, but the announcement to end Quantitative Tightening (QT) by 1st Dec 2025 was the real game changer.
This is the moment to stay calm, read the market structure, and act according to your plan.
📰 MACRO ANALYSIS – THE FED’S DOUBLE IMPACT
Rate Cut (Normally Bullish for Gold):
The second rate cut should, in theory, support Gold prices. However, much of this was already priced in before the announcement.
QT Ending (USD Strength Booster):
Ending QT signals that the Fed is trying to rebalance its monetary stance. This boosted the US Dollar Index (DXY), putting heavy selling pressure on both Gold and BTC.
Market Reaction:
Gold saw a sharp drop right after the announcement, then moved sideways in a wide range. During today’s Asian session, Gold fluctuated nearly $70 before retracing slightly.
📊 TECHNICAL OUTLOOK – WIDE RANGE, BUILDING BULLISH STRUCTURE
Looking at the current XAUUSD market structure:
Structure: Gold is currently consolidating in a wide range. However, a bullish structure seems to be forming with higher lows — a sustainable Dow-style uptrend pattern.
Trading Plan: Stay flexible and trade both sides —
🔴 Sell (Short) near liquidity resistance zones.
🟢 Buy (Long) from deep liquidity supports.
🎯 TRADING ACTION PLAN
🔴 SELL CONTINUATION – Short from Resistance
Entry Zone: 4005
Stop Loss: 4013
Targets:
TP1: 3990
TP2: 3975
TP3: 3960
TP4: 3943
🟢 BUY RECOVERY – Long from Support
Entry Zone: 3907–3909
Stop Loss: 3902
Targets:
TP1: 3933
TP2: 3954
TP3: 3970
TP4: 3999
⚖️ FINAL THOUGHTS
The Fed’s decision has reshaped the short-term outlook.
A $70 volatility range shows Gold’s high liquidity — but also high risk.
📌 LiamTrading’s Note:
A strong bullish structure is building up on the lower timeframes. Patience is key — wait for the ideal Buy zone near 3907 to catch the next recovery leg.
Always maintain strict risk and capital management, especially during post-FOMC volatility.
Are you ready to ride this 70-dollar range?
👉 Tap LIKE 👍 and COMMENT your setup!

Gold Extends Decline Below $4,000 as Risk Appetite Returns🔍 Market Context
Gold continues to weaken as renewed optimism over US–China trade relations reduces safe-haven demand.
Despite the Fed’s dovish tone after the latest FOMC meeting, the Dollar remains relatively capped, offering limited support to bullion.
However, the technical landscape remains bearish — the decisive break below the $4,000 handle signals a continuation of the downside structure that’s been unfolding since early in the week.
📊 Technical Analysis
• Structure: Clear downtrend across H1–H4, with consistent lower highs and controlled liquidity sweeps.
• Key Resistance: 3,985 – 4,000 (former support now turned supply).
• Short-Term Targets:
– 3,925 – 3,930 → initial liquidity pocket.
– 3,880 – 3,860 → extended bearish target aligned with Fibo 1.618 extension.
• Invalidation: Only a confirmed break & hold above 4,020 – 4,030 would shift bias neutral-to-bullish.
🎯 Trading Outlook
If gold retests the 3,985–4,000 zone and fails to reclaim it, sellers are likely to extend control toward 3,920 or lower ahead of the FOMC-driven volatility.
Momentum remains bearish as long as the market trades below the 4,000 pivot — liquidity below 3,900 may attract smart money before any meaningful rebound.
⚜️ Summary
This decline isn’t random — it’s a structural reset.
The market is rebalancing after months of overextended bullish sentiment.
Watch how price reacts between 3,920–3,880 — this zone could define the next shift in gold’s short-term direction.
📊 MMFLOW TRADING Insight:
“Smart money doesn’t chase candles — it waits for liquidity to shift.”
XAU/USD – Gold in Equilibrium Zone: Sell Opportunities Around...🔍 Market Context
Gold is currently consolidating within a triangle structure , showing short-term accumulation before a potential breakout.
Buyers are trying to maintain a minor bullish structure, but the series of lower highs indicates that sellers still hold the upper hand.
At the moment, price is reacting within the FVG 3,942–3,979 USD area, staying below the descending trendline.
If this zone fails to break, selling pressure may return.
💎 Key Technical Levels
• Bearish Order Block: 4,022 USD → main supply zone, aligning with the descending trendline.
• FVG Zone 1: 3,979 USD → short-term liquidity test area.
• FVG Zone 2: 3,942 USD → potential retracement zone before further downside.
• Bullish Order Block: 3,882 USD → key support aligning with long-term bullish trendline.
• Liquidity Zone: 3,789 USD → extended target if main support breaks.
🎯 Trading Scenarios
1️⃣ Sell Setup – Reaction from Resistance Zone
• Entry: 4,012 – 4,022 USD
• Stop Loss: 4,035 USD
• Take Profit:
– TP1: 3,979
– TP2: 3,942
– TP3: 3,900
– TP4: 3,882
– TP5: 3,789
✳️ “Sell the premium” – utilise supply and FVG reactions following Smart Money flow.
2️⃣ Buy Setup – Reaction from Demand Zone
• Entry: 3,882 USD
• Stop Loss: 3,865 USD
• Take Profit:
– TP1: 3,910
– TP2: 3,942
– TP3: 3,979
– TP4: 4,012
– TP5: 4,022
✳️ “Buy the discount” – valid when strong absorption or reversal signal forms near the lower OB.
💬 Summary
Current structure remains short-term bearish , yet the market is balanced.
The most efficient approach is to sell near premium zones (4,022) and buy back near discount (3,882) .
Expected range in the next 24–48 hours: 3,880–4,020 USD .
💡 Tagline:
“Trade where institutions act — not where retail reacts.”
⏰ Timeframe: 1H
📅 Updated: 30/10/2025
✍️ Analysis by: Captain Vincent

GOLD | Is This the FINAL Short Setup Before the Next Move? Welcome Traders!
Forget the noise — focus on structure and sentiment. Gold is holding firm near $3,950, but the macro backdrop just got tighter.
The question now: Can demand strength beat Powell’s new hawkish tone?
1. Market Insight – Powell vs. Demand
Two forces are pulling Gold in opposite directions:
🐻 Bearish Catalyst:
Powell hinted that another rate cut in December is unlikely, and the Fed plans to continue balance sheet reduction — strengthening the USD and weighing on non-yielding assets like Gold.
🐂 Bullish Support:
Persistent central bank demand and ETF inflows continue to provide a safety net, tightening overall Gold supply.
🎯 Outlook:
Expect sideways compression before a potential breakout. We’re stalking the strategic Sell Zone to align with the bearish fundamentals.
📊 2. Structure Check – Where Bears Wait
The market is approaching a major confluence zone:
SELL LIMIT Zone: $4,057 — intersection of the descending trendline and key horizontal resistance.
Immediate Support: $4,005 — target for the first leg down.
3. Action Plan – The Short Sniper Setup
Entry: SELL LIMIT $4,057
Stop-Loss: just above the descending trendline
TP1: $4,005 (short-term support retest)
Extended Target: $3,938 if breakdown accelerat
Powell’s hawkish tone is clear — but will bears finally take control from $4,057$, or will central bank demand defend the rally?

Elliott Wave Analysis – XAUUSD | October 30, 2025
1️⃣ Momentum
• D1 Timeframe:
D1 momentum remains entangled. Yesterday’s daily candle closed at its lowest point, rejecting all intraday bullish attempts. However, it has not yet broken the previous candle’s low — this suggests that the bearish trend is still intact, though weakening, and a potential reversal could occur within the next 1–2 days.
• H4 Timeframe:
H4 momentum is approaching the oversold zone, indicating a possible short-term recovery lasting around 4–5 H4 candles.
• H1 Timeframe:
The price is currently either consolidating or continuing its short-term decline.
If it continues to cling to the 3927 liquidity zone, a further breakdown is likely.
________________________________________
2️⃣ Wave Structure
• D1 Timeframe:
Price is now sitting near the 0.382 Fibonacci retracement of wave (3) in yellow — a typical correction level for wave (4).
Therefore, if the decline continues or the correction extends, it’s highly probable that we are in wave (4) of the yellow count, and the current drop is only the first sub-wave of this corrective phase.
• H4 Timeframe:
Currently, price is around the 0.872 extension of wave (3) in purple, which is not ideal for a completed wave (4).
When combining the D1 and H4 structures, both indicate that the market is likely forming a corrective wave (4) in yellow, and a recovery move may soon appear as D1 momentum begins to turn upward.
👉 If this scenario is confirmed:
o If price breaks above the previous wave (3) high (around 4400), it would confirm the start of a new impulsive wave upward.
o If price rises slowly and the highest target only reaches around 4400 before turning down again → this move is likely part of the corrective wave (4) before another bearish leg resumes.
• H1 Timeframe:
The current formation suggests a potential double zigzag structure.
To confirm this setup, price needs to break below 3892. This is a strong liquidity zone, so if price reaches it, a temporary bounce could occur.
Key liquidity zones above to watch: 3927 – 3953 – 3995.
If price fails to break above the previous red wave X, these zones may act as strong resistance levels, pushing the market lower again.
Target areas for the red wave Y are:
o 3814
o 3786
________________________________________
3️⃣ Trade Plan
Scenario 1:
• Buy Zone: 3815 – 3813
• SL: 3804
• TP1: 3892
Scenario 2:
• Buy Zone: 3787 – 3785
• SL: 3776
• TP1: 3892
________________________________________
📌 Summary:
D1 momentum is weakening and nearing the oversold zone → a potential bullish rebound could develop in the coming sessions.
The 3815 – 3785 area remains a key buy zone, while 3927 – 3995 should be closely monitored as resistance levels to confirm the next directional move.

Gold Rebounds Toward OB, but Deeper Correction May Follow🔍 Market Context
After forming a Change of Character (ChoCH) and a clear Break of Structure (BoS) to the downside, gold dropped sharply from 4,080–4,100 USD, confirming a shift from bullish to bearish structure.
Price is now making a technical rebound, forming Lower Highs toward the Order Block 4,012 USD — aligning with a small Fair Value Gap (FVG) , suggesting new selling pressure may emerge.
This rebound is seen as a “pullback retest supply” within a completed bearish setup.
If the 4,012 USD supply zone reacts strongly, price may extend its drop toward lower liquidity pools.
💎 Key Technical Structure
BoS (bearish): confirms a break below prior bullish structure.
Order Block (OB): 4,010–4,020 USD → main supply area confluencing with FVG.
FVG zone: 3,985–4,010 USD → technical retracement zone.
Supply Zone: 3,891–3,895 USD → temporary support, may be swept.
Liquidity Zone: 3,850–3,860 USD → key liquidity target.
📈 Trading Scenarios
1️⃣ SELL Setup – Retest OB 4,010–4,020 USD
Entry: 4,010 – 4,020
SL: 4,035
Take Profit: 3,985 - 3,965 - 3,945 - 3,915 - 3,890/Open
✅ Condition:
Wait for price to retest FVG–OB with clear bearish confirmation (strong rejection, bearish engulfing, or minor ChoCH on M15).
➡️ Trend-follow setup – sell after price retests supply zone.
2️⃣ BUY Setup – Reversal at Liquidity Zone 3,850 USD
Entry: 3,850 – 3,860
SL: 3,830
TP1: 3,870 - 3,885 - 3,900 - 3,920 - 3,940/Open
✅ Condition:
Wait for strong absorption or bullish reversal signal (long-tail rejection or bullish ChoCH on M15–H1).
➡️ Counter-trend scalp setup for reversal traders.
⚠️ Risk Management
Prioritise SELLs below 4,035 USD.
BUYs only valid with confirmation at Liquidity Zone.
Avoid mid-range trading (3,920–3,970) to reduce noise.
💬 Conclusion
Gold remains in a bearish trend after breaking prior bullish structure.
As long as price stays below 4,035 USD , downside momentum prevails.
Next major target: 3,891 – 3,851 USD .
👉 Strategic Plan:
Sell 4,010–4,020 | SL 4,035 | TP 3,985 → 3,890 🎯
Buy 3,850–3,860 | SL 3,830 | TP 3,870 → 3,940 🎯
💎 Price never lies — liquidity always reveals the truth.
⏰ Timeframe: 1H
📅 Updated: 29/10/2025
✍️ Analysis by: Captain Vincent

technical analysis for your XAU/USD (Gold vs USD) chart:XAU/USD (Gold) 15-Min Chart Analysis – 29 Oct 2025
Market Structure
The previous descending channel has been broken to the upside, indicating a potential trend reversal from bearish to bullish.
Price retraced back to a support level zone (≈ $3,920 – $3,940), where buyers are likely to defend.
Key Levels
Support Zone: 3,920 – 3,940
→ Price already tested this area with strong rejection wicks, showing buyer interest.
Resistance Zone: 3,980 – 4,020
→ Short-term resistance; a breakout above 4,020 confirms bullish momentum.
Target Level: 4,142
→ As marked on your chart, this is the projected bullish target after confirmation of upward continuation.
Price Action
After a downward correction, gold found support and formed a double-bottom-type pattern near the 3,940 level.
Price is currently consolidating above support, signaling potential accumulation before an upward push.
Momentum Outlook
If price holds above 3,940, expect a move towards 4,000 → 4,020, followed by a breakout to 4,142 (target).
However, if 3,920 support breaks, the price may retest 3,880–3,860, resuming short-term bearish momentum.
📈 Trading Bias
Bullish bias above 3,940 (target 4,142).
Bearish only below 3,920 (target 3,860). EURONEXT:NH7X2025 EURONEXT:PE6X2025 EURONEXT:PE7X2025 EURONEXT:A57X2025 EURONEXT:AJ7X2025 EURONEXT:AJ7X2025 EURONEXT:B16X2025 EURONEXT:B17X2025 EURONEXT:BC6X2025 EURONEXT:BC7X2025 EURONEXT:BC8Z2025 EURONEXT:FE6X2025 EURONEXT:MH7X2025

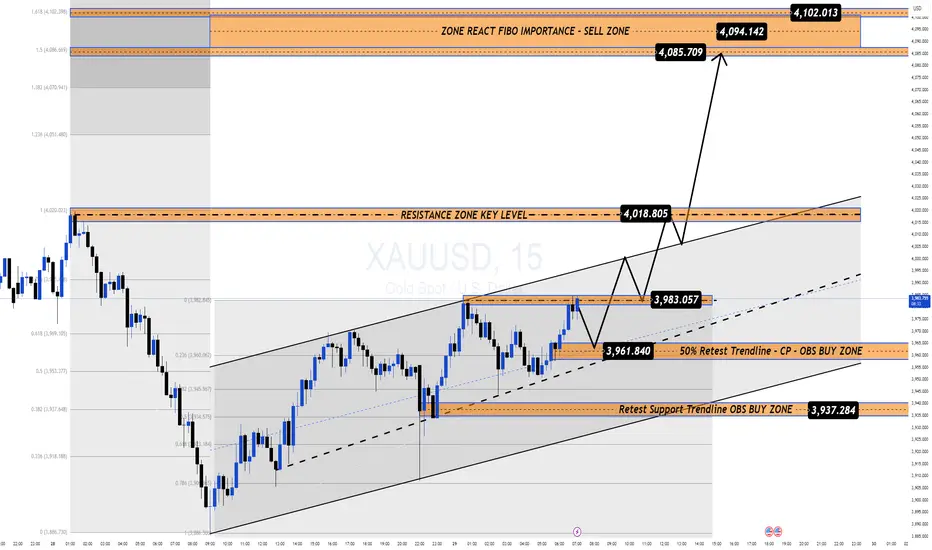
Gold Recovers 1000 Pips Ahead of FOMC: Key Levels in Focus📊 Market Overview
After a sharp selloff that shook long positions, Gold has rebounded nearly 1000 pips, recovering from the 388x area toward 398x ahead of the upcoming FOMC meeting.
Despite the short-term recovery, Gold remains down around 3.5% this week, showing caution as traders reposition before the Fed decision and amid easing U.S.–China trade tensions.
Currently, the price is trading near $3,980–3,990 during the Asian session, consolidating below the psychological $4,000 mark.
💎 Technical Outlook (H1–M15)
Gold continues trading in a short-term ascending channel, showing a corrective recovery inside a larger downtrend.
Immediate Support Zones:
• 3,961 – 3,937 → Trendline retest & OBS Buy Zone
• 3,918 → Structural invalidation area
Resistance & Key Reaction Levels:
• 4,018 – 4,085 → Mid-term resistance
• 4,094 – 4,102 → Major Sell Zone (Fibo 1.5–1.618 confluence)
📍If Gold breaks and holds above 4,018, momentum could extend toward 4,085–4,102.
📍If it rejects near 4,094–4,102, a correction toward 3,961–3,937 is likely.
🌍 Macro Context – FOMC Ahead
Markets expect a 25bps rate cut. A hawkish tone from Powell may pressure Gold, while a dovish one could send it above $4,100.
🧭 Summary
Gold keeps a short-term bullish bias but remains fragile ahead of FOMC.
Expect volatility around 4,000–4,100; key reactions near 4,094–4,102 will decide the next move.
🛡 Stay patient — liquidity builds before clarity.