Gold Extends Decline Below $4,000 as Risk Appetite Returns🔍 Market Context
Gold continues to weaken as renewed optimism over US–China trade relations reduces safe-haven demand.
Despite the Fed’s dovish tone after the latest FOMC meeting, the Dollar remains relatively capped, offering limited support to bullion.
However, the technical landscape remains bearish — the decisive break below the $4,000 handle signals a continuation of the downside structure that’s been unfolding since early in the week.
📊 Technical Analysis
• Structure: Clear downtrend across H1–H4, with consistent lower highs and controlled liquidity sweeps.
• Key Resistance: 3,985 – 4,000 (former support now turned supply).
• Short-Term Targets:
– 3,925 – 3,930 → initial liquidity pocket.
– 3,880 – 3,860 → extended bearish target aligned with Fibo 1.618 extension.
• Invalidation: Only a confirmed break & hold above 4,020 – 4,030 would shift bias neutral-to-bullish.
🎯 Trading Outlook
If gold retests the 3,985–4,000 zone and fails to reclaim it, sellers are likely to extend control toward 3,920 or lower ahead of the FOMC-driven volatility.
Momentum remains bearish as long as the market trades below the 4,000 pivot — liquidity below 3,900 may attract smart money before any meaningful rebound.
⚜️ Summary
This decline isn’t random — it’s a structural reset.
The market is rebalancing after months of overextended bullish sentiment.
Watch how price reacts between 3,920–3,880 — this zone could define the next shift in gold’s short-term direction.
📊 MMFLOW TRADING Insight:
“Smart money doesn’t chase candles — it waits for liquidity to shift.”
Xauusdanalysis
XAU/USD – Gold in Equilibrium Zone: Sell Opportunities Around...🔍 Market Context
Gold is currently consolidating within a triangle structure , showing short-term accumulation before a potential breakout.
Buyers are trying to maintain a minor bullish structure, but the series of lower highs indicates that sellers still hold the upper hand.
At the moment, price is reacting within the FVG 3,942–3,979 USD area, staying below the descending trendline.
If this zone fails to break, selling pressure may return.
💎 Key Technical Levels
• Bearish Order Block: 4,022 USD → main supply zone, aligning with the descending trendline.
• FVG Zone 1: 3,979 USD → short-term liquidity test area.
• FVG Zone 2: 3,942 USD → potential retracement zone before further downside.
• Bullish Order Block: 3,882 USD → key support aligning with long-term bullish trendline.
• Liquidity Zone: 3,789 USD → extended target if main support breaks.
🎯 Trading Scenarios
1️⃣ Sell Setup – Reaction from Resistance Zone
• Entry: 4,012 – 4,022 USD
• Stop Loss: 4,035 USD
• Take Profit:
– TP1: 3,979
– TP2: 3,942
– TP3: 3,900
– TP4: 3,882
– TP5: 3,789
✳️ “Sell the premium” – utilise supply and FVG reactions following Smart Money flow.
2️⃣ Buy Setup – Reaction from Demand Zone
• Entry: 3,882 USD
• Stop Loss: 3,865 USD
• Take Profit:
– TP1: 3,910
– TP2: 3,942
– TP3: 3,979
– TP4: 4,012
– TP5: 4,022
✳️ “Buy the discount” – valid when strong absorption or reversal signal forms near the lower OB.
💬 Summary
Current structure remains short-term bearish , yet the market is balanced.
The most efficient approach is to sell near premium zones (4,022) and buy back near discount (3,882) .
Expected range in the next 24–48 hours: 3,880–4,020 USD .
💡 Tagline:
“Trade where institutions act — not where retail reacts.”
⏰ Timeframe: 1H
📅 Updated: 30/10/2025
✍️ Analysis by: Captain Vincent

GOLD | Is This the FINAL Short Setup Before the Next Move? Welcome Traders!
Forget the noise — focus on structure and sentiment. Gold is holding firm near $3,950, but the macro backdrop just got tighter.
The question now: Can demand strength beat Powell’s new hawkish tone?
1. Market Insight – Powell vs. Demand
Two forces are pulling Gold in opposite directions:
🐻 Bearish Catalyst:
Powell hinted that another rate cut in December is unlikely, and the Fed plans to continue balance sheet reduction — strengthening the USD and weighing on non-yielding assets like Gold.
🐂 Bullish Support:
Persistent central bank demand and ETF inflows continue to provide a safety net, tightening overall Gold supply.
🎯 Outlook:
Expect sideways compression before a potential breakout. We’re stalking the strategic Sell Zone to align with the bearish fundamentals.
📊 2. Structure Check – Where Bears Wait
The market is approaching a major confluence zone:
SELL LIMIT Zone: $4,057 — intersection of the descending trendline and key horizontal resistance.
Immediate Support: $4,005 — target for the first leg down.
3. Action Plan – The Short Sniper Setup
Entry: SELL LIMIT $4,057
Stop-Loss: just above the descending trendline
TP1: $4,005 (short-term support retest)
Extended Target: $3,938 if breakdown accelerat
Powell’s hawkish tone is clear — but will bears finally take control from $4,057$, or will central bank demand defend the rally?

Elliott Wave Analysis – XAUUSD | October 30, 2025
1️⃣ Momentum
• D1 Timeframe:
D1 momentum remains entangled. Yesterday’s daily candle closed at its lowest point, rejecting all intraday bullish attempts. However, it has not yet broken the previous candle’s low — this suggests that the bearish trend is still intact, though weakening, and a potential reversal could occur within the next 1–2 days.
• H4 Timeframe:
H4 momentum is approaching the oversold zone, indicating a possible short-term recovery lasting around 4–5 H4 candles.
• H1 Timeframe:
The price is currently either consolidating or continuing its short-term decline.
If it continues to cling to the 3927 liquidity zone, a further breakdown is likely.
________________________________________
2️⃣ Wave Structure
• D1 Timeframe:
Price is now sitting near the 0.382 Fibonacci retracement of wave (3) in yellow — a typical correction level for wave (4).
Therefore, if the decline continues or the correction extends, it’s highly probable that we are in wave (4) of the yellow count, and the current drop is only the first sub-wave of this corrective phase.
• H4 Timeframe:
Currently, price is around the 0.872 extension of wave (3) in purple, which is not ideal for a completed wave (4).
When combining the D1 and H4 structures, both indicate that the market is likely forming a corrective wave (4) in yellow, and a recovery move may soon appear as D1 momentum begins to turn upward.
👉 If this scenario is confirmed:
o If price breaks above the previous wave (3) high (around 4400), it would confirm the start of a new impulsive wave upward.
o If price rises slowly and the highest target only reaches around 4400 before turning down again → this move is likely part of the corrective wave (4) before another bearish leg resumes.
• H1 Timeframe:
The current formation suggests a potential double zigzag structure.
To confirm this setup, price needs to break below 3892. This is a strong liquidity zone, so if price reaches it, a temporary bounce could occur.
Key liquidity zones above to watch: 3927 – 3953 – 3995.
If price fails to break above the previous red wave X, these zones may act as strong resistance levels, pushing the market lower again.
Target areas for the red wave Y are:
o 3814
o 3786
________________________________________
3️⃣ Trade Plan
Scenario 1:
• Buy Zone: 3815 – 3813
• SL: 3804
• TP1: 3892
Scenario 2:
• Buy Zone: 3787 – 3785
• SL: 3776
• TP1: 3892
________________________________________
📌 Summary:
D1 momentum is weakening and nearing the oversold zone → a potential bullish rebound could develop in the coming sessions.
The 3815 – 3785 area remains a key buy zone, while 3927 – 3995 should be closely monitored as resistance levels to confirm the next directional move.

Gold Rebounds Toward OB, but Deeper Correction May Follow🔍 Market Context
After forming a Change of Character (ChoCH) and a clear Break of Structure (BoS) to the downside, gold dropped sharply from 4,080–4,100 USD, confirming a shift from bullish to bearish structure.
Price is now making a technical rebound, forming Lower Highs toward the Order Block 4,012 USD — aligning with a small Fair Value Gap (FVG) , suggesting new selling pressure may emerge.
This rebound is seen as a “pullback retest supply” within a completed bearish setup.
If the 4,012 USD supply zone reacts strongly, price may extend its drop toward lower liquidity pools.
💎 Key Technical Structure
BoS (bearish): confirms a break below prior bullish structure.
Order Block (OB): 4,010–4,020 USD → main supply area confluencing with FVG.
FVG zone: 3,985–4,010 USD → technical retracement zone.
Supply Zone: 3,891–3,895 USD → temporary support, may be swept.
Liquidity Zone: 3,850–3,860 USD → key liquidity target.
📈 Trading Scenarios
1️⃣ SELL Setup – Retest OB 4,010–4,020 USD
Entry: 4,010 – 4,020
SL: 4,035
Take Profit: 3,985 - 3,965 - 3,945 - 3,915 - 3,890/Open
✅ Condition:
Wait for price to retest FVG–OB with clear bearish confirmation (strong rejection, bearish engulfing, or minor ChoCH on M15).
➡️ Trend-follow setup – sell after price retests supply zone.
2️⃣ BUY Setup – Reversal at Liquidity Zone 3,850 USD
Entry: 3,850 – 3,860
SL: 3,830
TP1: 3,870 - 3,885 - 3,900 - 3,920 - 3,940/Open
✅ Condition:
Wait for strong absorption or bullish reversal signal (long-tail rejection or bullish ChoCH on M15–H1).
➡️ Counter-trend scalp setup for reversal traders.
⚠️ Risk Management
Prioritise SELLs below 4,035 USD.
BUYs only valid with confirmation at Liquidity Zone.
Avoid mid-range trading (3,920–3,970) to reduce noise.
💬 Conclusion
Gold remains in a bearish trend after breaking prior bullish structure.
As long as price stays below 4,035 USD , downside momentum prevails.
Next major target: 3,891 – 3,851 USD .
👉 Strategic Plan:
Sell 4,010–4,020 | SL 4,035 | TP 3,985 → 3,890 🎯
Buy 3,850–3,860 | SL 3,830 | TP 3,870 → 3,940 🎯
💎 Price never lies — liquidity always reveals the truth.
⏰ Timeframe: 1H
📅 Updated: 29/10/2025
✍️ Analysis by: Captain Vincent

technical analysis for your XAU/USD (Gold vs USD) chart:XAU/USD (Gold) 15-Min Chart Analysis – 29 Oct 2025
Market Structure
The previous descending channel has been broken to the upside, indicating a potential trend reversal from bearish to bullish.
Price retraced back to a support level zone (≈ $3,920 – $3,940), where buyers are likely to defend.
Key Levels
Support Zone: 3,920 – 3,940
→ Price already tested this area with strong rejection wicks, showing buyer interest.
Resistance Zone: 3,980 – 4,020
→ Short-term resistance; a breakout above 4,020 confirms bullish momentum.
Target Level: 4,142
→ As marked on your chart, this is the projected bullish target after confirmation of upward continuation.
Price Action
After a downward correction, gold found support and formed a double-bottom-type pattern near the 3,940 level.
Price is currently consolidating above support, signaling potential accumulation before an upward push.
Momentum Outlook
If price holds above 3,940, expect a move towards 4,000 → 4,020, followed by a breakout to 4,142 (target).
However, if 3,920 support breaks, the price may retest 3,880–3,860, resuming short-term bearish momentum.
📈 Trading Bias
Bullish bias above 3,940 (target 4,142).
Bearish only below 3,920 (target 3,860). EURONEXT:NH7X2025 EURONEXT:PE6X2025 EURONEXT:PE7X2025 EURONEXT:A57X2025 EURONEXT:AJ7X2025 EURONEXT:AJ7X2025 EURONEXT:B16X2025 EURONEXT:B17X2025 EURONEXT:BC6X2025 EURONEXT:BC7X2025 EURONEXT:BC8Z2025 EURONEXT:FE6X2025 EURONEXT:MH7X2025

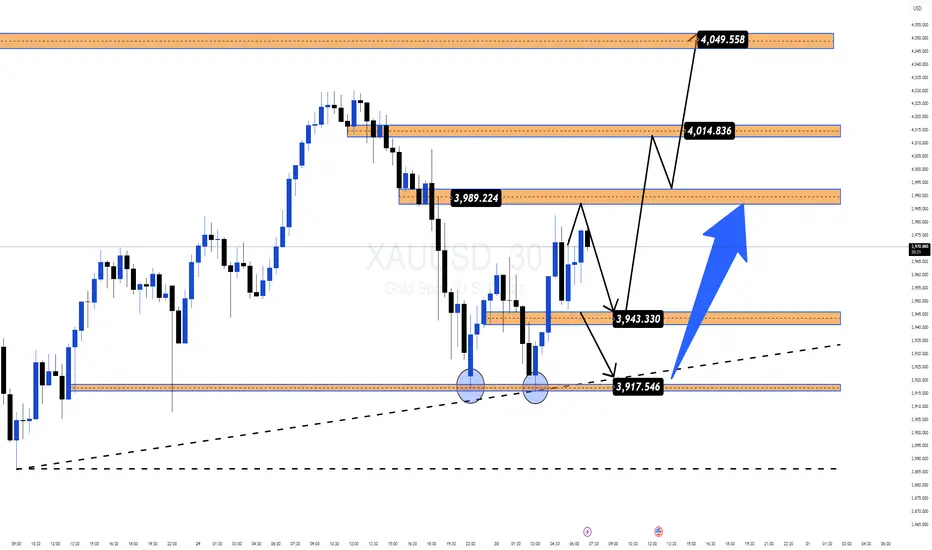
Gold Recovers 1000 Pips Ahead of FOMC: Key Levels in Focus📊 Market Overview
After a sharp selloff that shook long positions, Gold has rebounded nearly 1000 pips, recovering from the 388x area toward 398x ahead of the upcoming FOMC meeting.
Despite the short-term recovery, Gold remains down around 3.5% this week, showing caution as traders reposition before the Fed decision and amid easing U.S.–China trade tensions.
Currently, the price is trading near $3,980–3,990 during the Asian session, consolidating below the psychological $4,000 mark.
💎 Technical Outlook (H1–M15)
Gold continues trading in a short-term ascending channel, showing a corrective recovery inside a larger downtrend.
Immediate Support Zones:
• 3,961 – 3,937 → Trendline retest & OBS Buy Zone
• 3,918 → Structural invalidation area
Resistance & Key Reaction Levels:
• 4,018 – 4,085 → Mid-term resistance
• 4,094 – 4,102 → Major Sell Zone (Fibo 1.5–1.618 confluence)
📍If Gold breaks and holds above 4,018, momentum could extend toward 4,085–4,102.
📍If it rejects near 4,094–4,102, a correction toward 3,961–3,937 is likely.
🌍 Macro Context – FOMC Ahead
Markets expect a 25bps rate cut. A hawkish tone from Powell may pressure Gold, while a dovish one could send it above $4,100.
🧭 Summary
Gold keeps a short-term bullish bias but remains fragile ahead of FOMC.
Expect volatility around 4,000–4,100; key reactions near 4,094–4,102 will decide the next move.
🛡 Stay patient — liquidity builds before clarity.
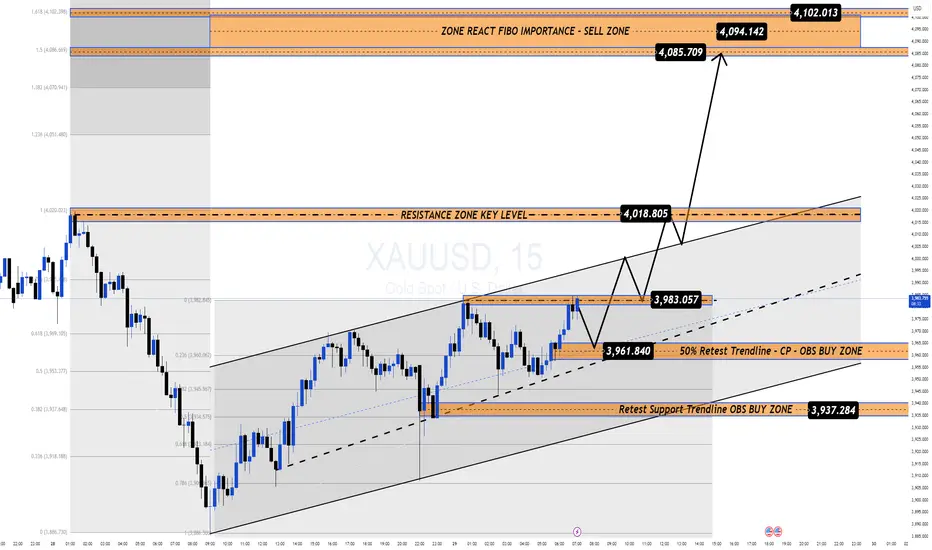
GOLD (XAU/USD) — Calm Before the FOMC Storm Gold is currently consolidating above $3,950, signaling a pause in volatility as traders await the FOMC decision for the next directional move.
1️⃣ Macro Outlook & Core Bias – FOMC in Focus 🔑
Market Pause: After rebounding during the Asian session, Gold’s upside momentum remains limited. Market participants are cautious ahead of the Fed’s policy update.
Headwinds: Renewed optimism on US–China trade and a slightly stronger USD are capping Gold’s advances.
Game Plan: Stay tactical — identify scalp zones and prepare for a major breakout once the FOMC event unfolds.
2️⃣ Technical Setup – Descending Channel in Play 📉
Structure: Price action is holding above $3,950, but movement remains confined within a descending channel/flag.
Bias: Short-term demand persists, yet the broader structure still favors bears.
Preferred Setup: Watch for BUY scalps from lower demand zones toward the Fibo/channel resistance area.
3️⃣ Trading Plan – Precision & Patience 💰
🟩 BUY Scenario (Long Scalp)
Buy Zone: $3,939.468
Strategy: Look for long scalps targeting the Fibo 0.5 resistance.
Stop-Loss: Tight SL just below the $3,939 level.
🟥 SELL Scenario (Short Setup)
Scalp Sell Zone: $4,015.646 (Fibo 0.5)
→ Short scalps targeting a retest of the channel midline.
Main Sell Zone: $4,046.448 (Fibo 0.618 / Channel Ceiling)
→ Ideal entry for a continuation short, aligning with the overall bearish channel.
4️⃣ Trader’s Take 🚀
The FOMC decision will set the tone —
Are you eyeing a bounce from $3,939, or waiting for the $4,046 rejection to ride the next wave down?

Gold Extends Decline Below $4,000 as Risk Appetite Returns🔍 Market Context
Gold continues to struggle amid renewed optimism around US–China trade talks.
The shift in sentiment has reduced safe-haven demand, while softer expectations of further Fed rate cuts keep the US Dollar capped — offering limited downside support for XAUUSD.
However, the technical landscape remains clearly bearish.
The break below the ₹4,000 handle confirms continuation of the downtrend first outlined in early-week plans.
📊 Technical Analysis
Structure: Gold maintains a clean bearish channel on the H1–H4 frame.
Immediate resistance: ₹3,985 – ₹4,000 (former support, now supply zone).
Target zones:
• Short-term liquidity area near ₹3,925–₹3,930
• Extended target sits around ₹3,880–₹3,860, aligning with Fibo 1.618.
Invalidation: Only a sustained break and hold above ₹4,020–₹4,030 would neutralize this short-term bearish bias.
🎯 Trading Outlook
If gold retests the broken ₹4,000 zone and fails to regain it,
expect sellers to extend control toward ₹3,920 or lower ahead of the FOMC meeting.
That event may later define the next recovery point — but for now, momentum remains firmly on the downside.
⚜️ Summary
Gold’s recent slide isn’t random — it’s structural.
The market is rebalancing after excessive bullish sentiment,
and liquidity below ₹3,900 is likely to attract attention before any significant rebound.
Watch the reaction near ₹3,920–₹3,880 —
that’s where the next meaningful decision for gold may emerge.
📊 MMFLOW TRADING Insight:
Smart money doesn’t chase candles — it waits for liquidity to shift.

GOLD DIP ALERT! Sniping the $3,89x FIBO Floor Ahead of FOMC!FranCi$$_FiboMatrix Quick Insight (H1/M30 Focus)
Welcome Traders! Gold paused its sell-off near $4,065 as safe-haven demand returned pre-FOMC. Dovish Fed expectations are weakening the USD, setting the stage for a major rally. This is the final BUY ON DIPS setup!
🧠 INSIGHT & LOGIC
Fundamental Anchor: Weak US inflation and strong expectations for a Fed rate cut are the key drivers limiting downside. Long-term bias is Bullish.
Technical Focus: We are tracking the final deep correction to the $3,89x zone (Fibo 1.5 - 1.618 Extension). This is the ultimate technical floor for the ATH rally.
Action Plan: WAIT for the price to hit this extreme zone and confirm reversal (H1/M30).
🎯 KEY ACTION ZONES
🔥 CRITICAL BUY: $3,89x region ($3,881.435$).
Strategy: BUY on confirmation here.
TP TARGET 1: $4,037.647 (Immediate Resistance).
TP TARGET 2: $4,232.374 (Major Structural Resistance).
SL MANDATE: Place SL safely below the 1.618 Fibo zone.
Patience is key. Do NOT rush the entry! Is the $3,89x$ floor strong enough for the ATH rally? 👇

🇮🇳 LiamTrading – XAUUSD: Dual Strategy Ahead of FOMC🇮🇳 LiamTrading – XAUUSD: Dual Strategy Ahead of FOMC | Focus on Buying the Retracement near $3914
Hello Traders,
After a strong sell-off, Gold (XAUUSD) is showing early signs of recovery, building a minor upward structure.
We continue to focus on buying the pullback, viewing this move as a short-term correction within the broader downtrend.
Expect higher volatility as the FOMC decision approaches.
📰 MACRO CONTEXT & FUNDAMENTALS
The market is holding steady ahead of the FED announcement:
🟢 Technical Recovery:
Gold reversed part of its decline during the Asian session, bouncing slightly from a 3-week low as traders await the FOMC rate decision.
🔴 Headwinds:
However, optimism around US-China trade talks and a stronger USD continue to limit the upside momentum.
📊 TECHNICAL VIEW & TRADING PLAN
We are focusing on high-probability liquidity zones for both long and short opportunities:
🟢 Primary BUY Setup (Retracement Buy)
Looking for a retest of the key buy-side liquidity zone to trigger the next recovery wave.
Entry Zone (Buy): $3914
Stop Loss: $3906 (Tight SL recommended)
Take Profit: TP1 $3933 | TP2 $3956
🔴 SELL Setup (Retest / Short-Term Scalping)
Using the broken trend area for short opportunities.
Entry Zone (Sell): $4048
Stop Loss: $4056
Take Profit: TP1 $4035 | TP2 $4022
🧭 SUMMARY & TRADER’S NOTE
Gold is now in a decision zone — volatility will spike around FOMC.
Trade with discipline:
✅ Enter only at confirmed liquidity zones.
✅ Always respect your Stop Loss.
✅ Manage your capital carefully before the news release.
Wishing everyone a profitable and disciplined session!

Elliott Wave Analysis – XAUUSD (October 29, 2025)
Momentum
• D1: Momentum remains compressed, but yesterday’s candle closed with a long lower wick — a clear sign of weakening downside pressure. A bullish daily close today would confirm a potential D1 reversal.
• H4: Momentum is preparing to turn down from the overbought zone, yet the current upward move is still weak. We need to monitor whether price can hold above the previous low once H4 momentum drops toward oversold.
• H1: Momentum is falling, but price is supported around 3953 and capped near 3994.
As long as price holds above 3927 and avoids breaking 3892, the next H4 oversold phase could confirm a stronger upside structure.
________________________________________
Wave Structure
• D1: The current decline equals 0.382 retracement of wave (3) yellow, a key Fibonacci level.
• H4: Wave (4) purple has already retraced 0.782 of wave (3) — unusually deep for a normal 4th wave (which typically stops around 0.382–0.5).
This suggests the ongoing correction may represent wave (4) yellow on the D1 timeframe.
If true, the market could now be forming wave W of a larger W–X–Y structure, meaning the upcoming recovery might only be a slow, overlapping X wave before another decline.
• H1: The 5-wave black structure seems completed.
A break above 3995, followed by a test of 4050, would confirm the end of wave (5) black and the start of a corrective move upward.
________________________________________
Summary
Price volatility is still high — avoid limit orders for now and watch how price reacts at key zones.
• 🔹 Support: 3953 – 3927 – 3892
• 🔹 Resistance: 3994 – 4050

XAUUSD | Gold to drop 2000PIPS, where is the best sell zone?🔍 Market Context
After breaking the medium-term upward structure at the main Trendline , gold has formed a distinct series of Lower High – Equal Low (EqL) , indicating a phase shift from bullish to bearish.
Currently, the price is fluctuating around the 3,960–3,970 USD zone – this is a temporary liquidity accumulation area before moving up to retest the resistance at 4,015–4,050 USD , which was previously a Demand Zone now turned into Supply Zone .
If a strong bearish reaction occurs here, the price is likely to extend its decline towards the Order Block 3,945–3,960 USD zone, or even deeper to the Premium Zone 3,884 USD .
💎 Key Technical Structure
Main Trendline: broken, confirming a structural change (ChoCH).
Resistance Zone: 4,010–4,015 → quick reaction resistance.
Supply Zone: 4,043–4,060 → strong technical retracement zone.
Premium Zone: 3,884–3,900 → discount zone, potential temporary bottom.
📈 Trading Scenarios
1️⃣ SELL Zone 1 – Scalp Reaction at Resistance Zone
Entry: 4,010 – 4,015
SL: 4,025
Take Profit : 4,005 - 3,995 - 3,975 - 3,965 - Open
➡️ Quick scalp reaction at nearby resistance – suitable for trading during London/NY sessions.
2️⃣ SELL Zone 2 – Major Retest at Supply Zone
Entry: 4,043 – 4,060
SL: 4,065
Take Profit : 4,050 - 4,040 - 4,030 - 4,020 - 4,010/Open
➡️ Main setup – retest of confluence supply zone with broken trendline, high probability if strong rejection on H1/H4.
3️⃣ SELL Continuation – Break & Retest below 3,945 USD
Entry: 3,945 – 3,950
SL: 3,965
TP: 3,884
➡️ Setup breaks EqL bottom confirming continuation of downtrend, targeting Premium Zone.
4️⃣ BUY Setup – Reversal at Premium Zone 3,900 USD
Entry: 3,900
SL: 3,880
TP1: 3,910 - 3,920 - 3,930 - 3,940 - 3,950/Open
✅ Condition:
Only buy when a strong reaction candle appears (long-tail rejection / ChoCH bullish on M15–H1).
➡️ This is the final discount zone before major capital can return to the market – technical reversal setup, low risk / high reward.
⚠️ Risk Management
Prioritise SELL at supply zones, BUY at Premium – avoid trading in the middle of the range.
Reduce volume on scalp setups (Sell 1).
If price closes above 4,070 → short-term downtrend is invalidated.
💬 Conclusion
Gold is still under short-term bearish pressure, however, the 3,884–3,900 USD zone may serve as strong support.
The appropriate strategy is to utilise the two resistance zones for Selling and observe technical Buying at the Premium bottom.
👉 Comprehensive Strategy:
Sell 4,010–4,015 | SL 4,025 | TP 4,005 → 3,965 🎯
Sell 4,043–4,060 | SL 4,065 | TP 4,050 → 4,010 🎯
Buy 3,900 | SL 3,880 | TP 3,910 → 3,950 🎯
🔥 “Trade with patience, react at precision zones — that’s how consistency is built.”
⏰ Timeframe: 1H
📅 Update: 28/10/2025
✍️ Analysis by: Captain Vincent

XAUUSD SELL TRADE | WILL 4150 ACT AS A BARRIER?Yesterday, Gold experienced a significant sell-off after breaking below our previously identified positional sell level at 4185, triggering a sharp decline down to 4004.
Currently, Gold is showing signs of a retracement. The 4150 level is now acting as a strong resistance.
Trade Idea:
Sell Gold near 4150
Stop Loss: 4157.6
Target Levels: 4121, 4111, and 4101
Note: Monitor price action around these levels closely and manage risk accordingly.
Do you agree with this bearish outlook?
👍 Like if you’re ready to short!
💬 Comment your take or questions below — let’s build a powerful, informed trading community!
Your feedback drives our content and keeps everyone trading smarter. Let’s make those pips together! 🚀
Happy Trading,
– The InvestPro Team

Gold Breaks Key Support Zone — Bearish Momentum Builds Below $4,Analysis:
The XAU/USD (Gold vs. USD) 45-minute chart shows a clear breakdown below the established support zone, indicating a shift in market sentiment from consolidation to bearish momentum.
The support zone around $4,050 – $4,000 had previously held multiple times, acting as a strong demand area.
The recent breakout below this zone confirms a potential trend continuation to the downside.
Price action suggests a bearish pattern with lower highs and lower lows forming before the breakout.
A retest of the broken support (now resistance) may occur before the next leg lower.
The next major target lies near $3,900 – $3,850, aligning with the projected measured move.
Technical Outlook:
If gold fails to reclaim the $4,050 level, further downside pressure remains likely. However, a close back above this level could invalidate the bearish breakout and signal a possible false break.

GOLD (XAU/USD): SHORT OPPORTUNITY — RIDING THE FINAL BEAR LEG!1. MACRO VIEW: THE FED DECISION & MARKET TENSION
The Gold market is currently caught in a tug-of-war:
Downside Pressure (USD): Positive developments in the US-China trade talks are easing global risk concerns, which often reduces demand for safe-haven Gold.
Upside Support (Gold): Traders are fully pricing in a 25bps Fed rate cut on Wednesday, putting downward pressure on the US Dollar (which is supportive of Gold). Geopolitical tensions (Russia-US) add further safe-haven appeal.
Key Takeaway: While USD weakness is supportive, our Technicals strongly suggest a corrective move needs to conclude first. The FOMC decision is the ultimate game-changer.
2. TECHNICALS: STRUCTURE CONFIRMS THE BEARISH BIAS
Trend Shift: Gold’s strong previous rally has ended. The structure has been clearly broken, confirming a Bearish Shift for the short-term trend.
Expected Move: We are looking for a classic technical pullback (Retest) to the newly formed resistance zone. Following this retest, we expect sellers to push the price down to complete the correction.
3. 💡 TRADE STRATEGY (THE SHORT SETUP)
We are positioning for a SELL (SHORT) trade, anticipating the end of the corrective phase:
Ideal Entry Zone (Entry): 3,949.849 (Retesting the previous major Support, now acting as Resistance)
Take Profit (TP1): 3,929.793
Take Profit (TP2): 3,878.287 – 3,811.333 (The Major Demand Zone Target below)
Stop Loss (SL): Above 3,949.849 (Placed above the confirmed resistance)
⚠️ Important Note: The FED rate decision on Wednesday guarantees high volatility. Trade cautiously and ALWAYS prioritize risk management!
What is your view on Gold's bottom? Share your thoughts below! 👇
#Gold #XAUUSD #FOMC #TradePlan

LiamTrading - XAUUSD: SCENARIO AHEAD OF FOMCLiamTrading - XAUUSD: SCENARIO AHEAD OF FOMC - The $3840 Mark Awaits a Bottom Catch Reaction Wave
Hello trading community,
The Gold market is exhibiting a strong and sustainable downtrend. We are witnessing a crash after the price broke through key support zones. With the upcoming FOMC event, our strategy is to seek Buy opportunities at deep liquidity zones and continue to Sell when the price recovers to retest the broken trend.
📰 MACRO ANALYSIS & CASH FLOW CONTEXT
Gold is currently under dual pressure:
Bearish Pressure 🔴: Optimism about the US-China trade progress has significantly weakened the demand for Gold, traditionally a safe-haven commodity. Spot Gold prices have fallen below $3950, hitting a three-week low, down about 0.78% on the day (28/10).
Short-term Support 🟢: Bets on the possibility of Fed rate cuts continue to weaken the US Dollar (USD), which is the only factor that could potentially support this precious metal.
Conclusion: This tug-of-war makes bottom identification challenging. The bearish scenario remains the top priority.
📊 TECHNICAL ANALYSIS: THE DOWNWARD WAVE CONTINUES
Based on the H4 chart (image_5fa7fa.png):
Current Trend: The price has successfully broken the key liquidity support zone near $3950 and is continuing its downward momentum.
Current Fibonacci Level: The price is touching and reacting at the 1.618 Fibonacci level (around $3950).
Next Target: The next target for Gold will be the 2.618 Fibonacci area (around $3840), which is a large liquidity zone expected to see strong reactions.
Main Strategy: We focus on two scenarios: Catching the bottom reaction at 3840 and continuing to Sell when the price rebounds.
🎯 DETAILED TRADING PLAN (ACTION PLAN)
We have two detailed scenarios based on the current price level:
🟢 BUY Reversal Scenario
We wait for the price to hit the deep liquidity bottom at 3840 to execute a buy order with the expectation of a technical recovery.
Entry Zone: 3840
Stop Loss (SL): 3832 (tight SL)
Take Profit Targets (TP): TP1: $3872 | TP2: $3898 | TP3: $3925 | TP4: $3950
🔴 SELL Retest Scenario
If Gold recovers without breaking the downtrend structure:
Entry Zone: Watch for a Sell retest at $4091
Stop Loss (SL): $4099
Take Profit Targets (TP): TP1: $4065 | TP2: $4033 | TP3: $4004 | TP4: $3965
SUMMARY & DISCIPLINE (Steven's Note)
Gold is in a strong decline ahead of the FOMC, with significant volatility expected. Capturing deep Fibonacci and Liquidity zones is key.
Note: Always adhere to the set Stop Loss. Capital management is the top priority, risking only 1-2% of the account per trade.
Wishing traders a successful and disciplined new trading week!

Elliott Wave Analysis – XAUUSD (October 28, 2025)
🔹 Momentum
D1 Timeframe:
The momentum lines on D1 remain intertwined. When this happens, the trend often continues with candle counts that follow Fibonacci numbers (3, 5, 8…).
Currently, there are around 3 candles, indicating a high probability of a reversal forming soon, possibly today.
H4 Timeframe:
Momentum is rising, suggesting a potential short-term upward or sideways move to push momentum into the overbought zone.
If the market consolidates at this level, once momentum reaches the overbought region, another bearish leg on H4 could still occur.
H1 Timeframe:
Momentum is currently decreasing. Price is closing lower around the liquidity zone at 3994, showing signs of a liquidity sweep.
We expect price to continue moving lower toward the next liquidity zone, in alignment with the short-term bearish structure on H1.
________________________________________
🔹 Wave Structure
D1 Timeframe:
The overall wave structure remains largely unchanged. Yesterday’s strong bearish candle fits within our prior analysis, confirming that the corrective wave is still in progress.
However, since the D1 momentum lines have already stuck together for about three candles, a potential bullish reversal candle today could mark the completion of this correction.
H4 Timeframe:
The structure has broken the previous low, suggesting that this could be the final leg of wave Y (blue).
Observing the completed 5-wave structure (1–2–3–4–5 in blue), this corrective leg has now returned to the base of the previous wave 4, achieving both price and time symmetry.
→ A short-term bullish reversal is expected from the current area.
H1 Timeframe:
The prior correction formed a triangle pattern (abcde in red), which has now broken to the downside, developing into a 5-wave sequence (black).
Wave 4 (black) appears completed, and price is likely within the final wave 5 down.
🎯 Target zones for completion of wave 5 (black):
• Target 1️⃣: 3953
• Target 2️⃣: 3927
________________________________________
🔹 Trading Plan
Scenario 1:
• Buy Zone: 3955 – 3952
• Stop Loss: 3932
• TP1: 4050
Scenario 2:
• Buy Zone: 3939 – 3927
• Stop Loss: 3907
• TP1: 3994

GOLD - ENTERS COREECTION PHASESymbol - XAUUSD
Gold is currently undergoing a corrective phase following approximately six weeks of aggressive upward movement. Price action is forming a consolidation range while continuing to pressure the support zone.
The recent record breaking rally became overheated, prompting profit-taking and long liquidation. Additionally, a gradual shift in market sentiment and macroeconomic backdrop is contributing to capital outflows. However, ongoing US–China trade negotiations, the US government shutdown, and heightened geopolitical uncertainty, including the cancellation of Trump’s meeting with President Putin, continue to pose economic risks that could provide underlying support for the precious metal.
Overall, the current pullback appears to be a healthy corrective pause within the broader structure. The 4000 level remains a critical support area. A sustained recovery above 4110 would indicate that buyers are interested, though further momentum largely depends on developments surrounding global trade policies.
Resistance levels: 4100, 4110, 4163
Support levels: 4058, 4000
A decisive breakdown of the lower boundary of the trading range could trigger a deeper corrective wave. The 4000 level is the primary focus, as strong volatility may occur around this zone. Given the current market conditions - with declines matching the previous intensity of the rally, patience is warranted until momentum stabilizes, enabling more informed technical decisions.

#xauusd gold dumping is going to 3600 this is my gold analysis#xauusd gold dumping is going to 3600 this is my gold analysis #xauusd gold dumping is going to 3600 this is my gold analysis
v
#xauusd gold dumping is going to 3600 this is my gold analysis#xauusd gold dumping is going to 3600 this is my gold analysis#xauusd gold dumping is going to 3600 this is my gold analysis#xauusd gold dumping is going to 3600 this is my gold analysis
#xauusd gold dumping is going to 3600 this is my gold analysis
why the reason you can sea on my previous public post of #gold
#xauusd

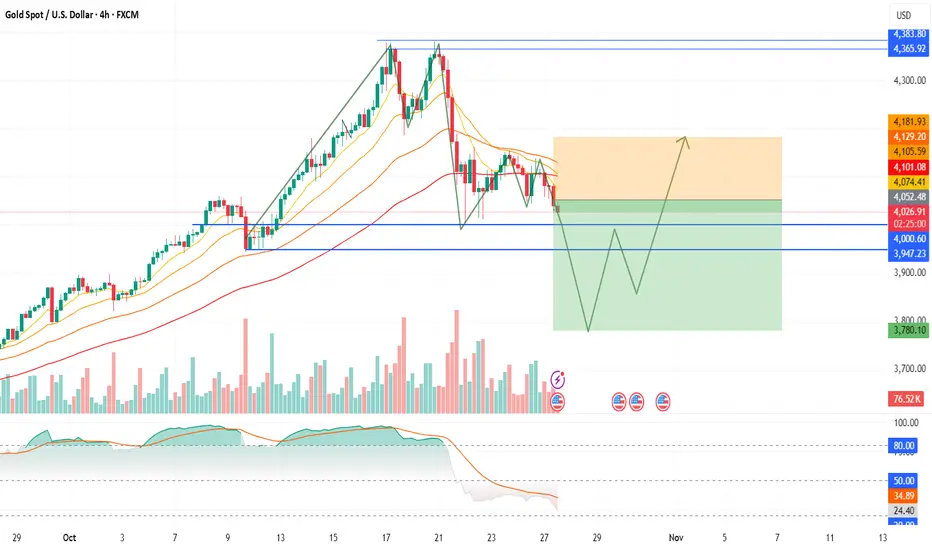
Dual-phase trading — shorting the drop, then switching to long Gold is currently trading near $4,040, and my short-term outlook is bearish, followed by a strong bullish reversal in the coming sessions.
I expect prices to decline first toward the $3,800–$3,750 zone, which aligns with key support and previous demand levels. This correction phase would complete a healthy market reset before a potential major rally begins.
Once price stabilizes around $3,800, I anticipate a sharp reversal and breakout move toward $4,200+, possibly extending higher if momentum builds.
📊 My Plan:
Bias: Bearish first → then Bullish
Short-Term Target: $3,800–$3,750
Reversal Zone: Accumulate longs near $3,800
Upside Target: $4,200+
Invalidation: Below $3,740 (on 4H closing)
This setup favors patience and dual-phase trading — shorting the drop, then switching to long for the rebound.
Elliott Wave Analysis – XAUUSD (October 27, 2025)
🔹 Momentum
• D1 Timeframe:
D1 momentum remains clustered, suggesting that a bullish reversal could occur at any time. However, since momentum has not yet separated clearly, short-term downside pressure still exists.
• H4 Timeframe:
H4 momentum is currently declining, meaning that the downtrend could continue. We need to wait for H4 momentum to reach the oversold area and observe the market’s reaction there to determine whether the current drop is complete.
• H1 Timeframe:
H1 momentum is rising slightly, indicating the potential for a short-term rebound. However, since H4 is still in a down phase, any upward movement could face resistance near the 4098 level.
________________________________________
🔹 Wave Structure
• D1 Timeframe:
Price is currently moving sideways while D1 momentum remains stuck together, signaling a possible upcoming 5-day rally once D1 momentum turns upward into the overbought zone.
o If price fails to break above wave (3) yellow, this move is likely a wave (4) yellow correction.
o Conversely, if price breaks above wave (3) yellow, the current correction may only be a minor wave within wave (3) yellow.
________________________________________
🔹 Two Main Scenarios
1️⃣ Bullish Scenario (WXY blue completed):
If the WXY blue corrective structure has finished, the market may start a new wave (5) purple uptrend.
In this case:
• As H4 momentum moves into the oversold area, price should not fall deeply toward 4004.
• A sharp and decisive rebound from that zone would confirm this bullish scenario.
2️⃣ Bearish Scenario (Correction still in progress):
If the correction is not yet complete, the H4 decline could continue:
• Price might break below 4004, or at least retest it.
• If that happens, the downtrend could extend toward 3953 or 3927.
________________________________________
🔹 H1 Structure – Triangle Formation
On the H1 chart, price is consolidating within a contracting triangle, suggesting sideways accumulation with two possible interpretations:
• Scenario 1:
The triangle represents wave X of the WXY black structure.
When H4 momentum reaches the oversold zone and price holds above 4004, we may see an impulsive breakout toward the previous high at 4381, completing a flat correction of wave (4) yellow (D1).
• Scenario 2:
The triangle is wave (4) of wave Y blue, meaning that once completed, price could decline further toward 3953 or 3927 to finish wave Y. After that, a more stable upward wave is expected.
________________________________________
🔹 Trading Plan
Currently, price remains inside the triangle pattern:
• For experienced traders:
Wait for a breakout of either side of the triangle for direct entry.
• For more conservative traders:
Wait for Buy opportunities near strong support below.
🎯 Buy Zone: 3930 – 3927
🛑 Stop Loss: 3917
🎯 TP1: 4004
👉 If price breaks above 4149, we can look for Buy entries upon breakout, expecting an extended upward move toward 4268 or higher.

XAUUSD Analysis - Levels and Pridiction#Gold (XAU/USD) Technical Analysis - October 27, 2025
Current Market Status: Retracement on Higher Time Frame,
Lower Timeframe Bearish Breakdown⚠️
Gold is trading at 4,033.67, having broken down from the previous #consolidation zone. The market has violated key support levels and is now showing clear bearish momentum with multiple technical confirmations.
Critical Technical Developments:
1️⃣ Triangle Pattern Breakdown (1H Chart)
The 1-hour chart reveals a confirmed triangle #pattern breakout to the downside. After breaking below the triangle support, price attempted a retest of the breakdown level around 4,093-4,144 but was rejected, confirming the pattern's validity. This is a classic bearish continuation signal.
2️⃣ Demand Zone Invalidation
A crucial demand level that previously held multiple tests has now been completely invalidated. The chart explicitly notes: "Demand Level to be invalidated to move the Price Further Down" - this condition has been met, opening the path for deeper downside movement.
3️⃣ Minor Trend Shift Level Breach
Price has broken below the **Minor Trend Shift Level** at approximately 4,093, confirming a shift from bullish to bearish short-term structure. This level now acts as resistance.
Target Zones (High Probability):
🎯 Immediate Targets:
- 3,945 - Next support cluster (current proximity)
- 3,845 - 0.5 Fibonacci retracement level (PRIMARY TARGET)
- 3,719 - 0.618 Fibonacci retracement level (EXTENDED TARGET)
The Fibonacci levels in green boxes, are the key magnetic zones for price action.
📉 Bearish Continuation (70% Probability)
Price continues lower toward 3,845, potentially extending to 3,719 if selling pressure intensifies. This move would represent a healthy correction within the broader uptrend from the yearly lows.
📈 Bullish Reversal (30% Probability)
Requires reclaiming 4,144 with strong momentum AND holding above it on daily timeframe. Only then would the bearish structure be invalidated.
Conclusion:
Gold remains in a confirmed downtrend on lower timeframes with clear downside targets visible. The invalidation of demand zones and triangle breakdown provide strong bearish confirmation. Traders should focus on the 3,845-3,719 zone as the primary area of interest for potential reversal setups. Until price reclaims 4,150+, the path of least resistance remains **DOWN**.
Risk Management: Use proper position sizing as volatility remains elevated. The 3,845 level will be crucial - watch for buyer reaction there.
