Gold Pulls Back From All-Time High – Correction Looks Limited📊 Market Overview
Gold slightly corrected from its all-time high near $4,239, showing early signs of a short-term pullback, but the overall trend remains bullish.
Despite the correction, fundamental sentiment still supports Gold:
💬 US–China trade tensions and geopolitical risks continue to fuel demand for safe-haven assets.
💵 The US Dollar remains under pressure amid expectations of a Federal Reserve rate cut later this year.
⚖️ Ongoing concerns about a possible US government shutdown further enhance Gold’s attractiveness.
These factors suggest that the current dip is likely a healthy correction within a strong uptrend, not a reversal.
🧠 Technical Structure (MMFLOW Wave View)
Gold has likely completed a minor Wave (V) on the M30 chart, forming a new ATH Zone near 4,239.
Currently, price is unfolding a corrective A–B–C pattern, expected to find support at key liquidity zones before resuming the uptrend.
Our model highlights two potential BUY setups and a short-term SELL scalp opportunity for today’s trading session.
🔑 Key Levels to Watch
🔵 BUY Setup 1
Zone: 4,184 – 4,182
SL: 4,178
TP: 4,188 – 4,192 – 4,196 – 4,200 – 4,210 – 4,220 – ???
🟢 BUY Setup 2 (Deeper Retrace)
Zone: 4,148 – 4,146
SL: 4,140
TP: 4,152 – 4,156 – 4,160 – 4,170 – 4,180 – 4,190 – 4,200
🔴 SELL SCALP Opportunity
Zone: 4,230 – 4,234
SL: 4,238
TP: 4,220 – 4,215 – 4,210 – 4,200 – 4,190 – ???
⚙️ MMFLOW Trading View
📈 Price is currently respecting Wave (A) of the correction.
We expect a possible (B) retracement toward 4,220 – 4,230, followed by (C) decline completing near 4,147 – 4,150 (Fibo 0.618 / CP Buy Zone).
From there, Smart Money may re-enter long positions targeting a fresh liquidity sweep toward the 4,285 SELL ZONE.
In short:
The uptrend remains intact, only a short-term correction is unfolding.
Patience is key — best opportunities will likely appear around 4,150 – 4,180 range.
The structure aligns perfectly with both technical confluence (Elliott + Liquidity Zones) and macro sentiment.
If the market holds above 4,140, Gold could aim for new highs toward 4,285 – 4,300 in the next few sessions.
However, traders should:
✅ Always use Stop Loss — volatility is high near record highs.
✅ Avoid overtrading in narrow pullback zones.
✅ Focus on reaction at key liquidity levels before entering.
⚡️ Summary
Gold remains technically bullish with limited downside correction.
Watch for price reaction around 4,184 and 4,147 — both zones represent strong liquidity areas where Smart Money may look to buy again.
After completing this correction, a new impulsive leg up toward 4,285+ could unfold, potentially marking the next all-time high.
Xauusdanalysis

XAUUSD: Profit-Taking Pressure Emerges XAUUSD: Profit-Taking Pressure Emerges - Trading Strategy as Gold Adjusts
Hello traders community,
Today's trading session witnessed a strong "Price Rejection" of XAUUSD at the new peak, triggering a nearly $20 drop. Although the long-term bullish structure remains intact, the profit-taking signal from buyers is evident. This article will delve into the analysis of key price zones and outline a detailed trading strategy in the context of the adjusting market.
📊 Technical Analysis
The H1 chart provides us with an overview of the current liquidity zones and price structure:
Fibonacci Resistance Zone: The price reacted strongly at the confluence of the 2.618 Fibonacci Extension levels, around the $4240 area. A strong bearish candle emerged right after the price touched this zone, confirming it as an extremely potential "Sell zone." Sellers have officially stepped in.
Point of Control (POC) and Liquidity: The Volume Profile (VPVR) indicator shows the area with the highest trading volume concentration (POC) is at $4196. This is the "magnet" zone attracting price in the short term. If the price recovers, this will be the decisive tug-of-war zone.
Key Support Zones:
$4196 (Buy Scalping): The POC zone acts as the first price support point. Scalping traders can look for short-term buying opportunities here.
$4158 (Buy Zone): This is a stronger support zone, the bottom of the previous uptrend, and also an area with significant trading volume. Buyers are likely to return strongly if the price adjusts here.
📰 Market Sentiment
Profit-Taking Pressure: After a hot growth streak, Gold's sharp drop of nearly $20 is a healthy adjustment move. The selling force mainly comes from short-term profit-taking traders.
"Sharks" Still Accumulating: Notably, while the price adjusts, the world's largest gold ETF, SPDR Gold Trust, increased its gold holdings by 1.15 tonnes. This move shows that large institutions remain optimistic about Gold's long-term prospects and are taking advantage of the dip to accumulate more. This is a signal contrary to short-term price action, which traders need to pay special attention to.
🎯 Actionable Trading Plan
With the current technical signals and market sentiment, we prioritize the strategy of selling when the price recovers (Sell the Rally).
Scenario 1: Sell on Downtrend (Sell) 📉
Entry Zone: Wait for the price to recover to the $4228 zone. This is the "retest" area of the liquidity zone previously controlled by sellers.
Stop Loss: $4235, above the nearest minor peak.
Take Profit: $4210 - $4188 - $4165 - $4133.
Scenario 2: Buy at Strong Support (Buy) 📈
Entry Zone: If the price continues to drop, look to buy at the "Buy zone" $4158.
Stop Loss: $4150, a safe level below the support zone.
Take Profit: $4173 - $4190 - $4205 - $4230.
Scenario 3: Short-Term Scalping (Scalping Buy) ⚡️
Entry Zone: Quick buy at the POC zone $4196.
Stop Loss: $4188, a short and tight stop loss level.
Take Profit: $4210 - $4228.
Summary
In the short term, sellers are temporarily dominant after Gold failed to conquer the $4240 resistance zone. The main strategy is to sell when the price recovers. However, the buying action of the SPDR fund indicates that the medium and long-term uptrend remains very solid. Therefore, buying orders at strong support zones like $4158 are also an opportunity not to be missed.
Trade with discipline and manage your capital tightly. Wishing all traders an effective trading day!
Note: This analysis is based on personal views and is for reference purposes only, not direct investment advice.

XAUUSD – Safe-Haven Flows Continue to Support GoldMarket Context:
Gold has attracted strong buying for the fourth consecutive session, supported by a mix of global risk factors: renewed US–China trade tensions, rising geopolitical uncertainty, and growing fears of a prolonged US government shutdown.
Meanwhile, dovish expectations from the Federal Reserve are keeping the USD under pressure — further enhancing the appeal of gold as a non-yielding safe-haven asset.
During the Asian session, XAU/USD printed a fresh all-time high, with bulls now eyeing a potential extension toward the 4,200 USD/oz region amid escalating global concerns.
Technical Outlook (M30):
Gold continues to respect its ascending channel structure, maintaining dynamic support between 4,167 – 4,154.
As long as price holds above 4,139, the broader trend remains bullish, with the next liquidity target sitting at 4,240 – 4,241.
Key Zones to Watch:
Liquidity Sell Zone: 4,240 – 4,242
ATH Zone / Short-Term Resistance: 4,190 – 4,200
OBS Buy Zone – CP Trendline Support: 4,141 – 4,139
Secondary Buy Zone: 4,114 – 4,112
Trading Plan:
🔹 BUY Zone
Entry: 4.141 – 4.139
SL: 4.134
TP: 4.145 → 4.150 → 4.155 → 4.160 → 4.170 → 4.180
🔹 BUY Zone
Entry: 4.114 – 4.112
SL: 4.106
TP: 4.120 → 4.125 → 4.130 → 4.140 → 4.150
🔹 SELL Zone (Scalp Reaction)
Entry: 4.240 – 4.242
SL: 4.248
TP: 4.235 → 4.230 → 4.225 → 4.220 → 4.210 → 4.200
Summary:
The bullish market structure remains intact as long as price holds above the 4,139 zone.
Watch for potential long opportunities from 4,141 – 4,139, where the confluence of trendline and order block support could trigger fresh demand.
Bulls remain in control, targeting the 4,240 – 4,241 liquidity area in the coming sessions.
📊 What’s your take — will gold break above 4,200 or pause for a correction first?
👉 Follow MMFLOW TRADING for daily market structure insights and institutional-style setups.
🟣 Chart: XAUUSD M30 – Smart Money Flow structure highlighting liquidity pools, CP confluence and key buy/sell zones.

Elliott Wave Analysis – XAUUSD (16/10/2025)
🔹 MOMENTUM
D1:
Currently, the daily momentum has formed five consecutive bullish candles and is now approaching the overbought zone.
👉 This indicates a high probability of a correction within the next 1–2 days.
H4:
Momentum on H4 is still rising.
Today, the price may continue to climb slightly or move sideways to push H4 momentum into the overbought zone before a potential reversal.
H1:
Momentum on H1 is also nearing the overbought zone, suggesting that a short-term pullback could occur during the Asian session.
________________________________________
🔹 WAVE STRUCTURE
D1 Chart:
The structure remains within an extended Wave (5).
With D1 momentum about to enter the overbought area and this bullish phase already lasting for five candles, there is a strong chance of a correction today or tomorrow.
H4 Chart:
The price is currently in orange Wave (5), while purple Wave (3) is still unfolding.
Since H4 momentum is rising, price may extend slightly higher or consolidate sideways before a possible reversal.
H1 Chart:
Price is now in yellow Wave (5), where five minor blue waves have been completed.
The price zone around 4242.89 corresponds to the 0.618 Fibonacci retracement of blue Waves 1–3.
Within blue Wave (5), we can also count five smaller black sub-waves, and interestingly, 4242.89 again aligns with the 0.618 Fibonacci level of black Waves 1–3.
➡️ This creates a strong resistance area, from which a deep correction forming purple Wave (4) is highly possible.
________________________________________
🔹 TRADING PLAN
• Avoid holding long positions for too long — this stage is best suited for short-term scalp trades.
• Focus on observing price action and waiting for a confirmed top formation before planning any Swing setups.
• Sometimes, staying on the sidelines is the best strategy.
👉 I will update the Swing signal once a clearer confirmation appears.

XAU/USD – Buyers Reclaim Structure, Targeting Liquidity Zone🔍 Market Context
After a strong Liquidity Sweep yesterday, gold has rebounded and formed consecutive Break of Structure (BoS) , confirming buyers have regained control.
The price has now filled the Fair Value Gap (FVG 4,191 – 4,202) and is heading towards the Sell Liquidity Zone 4,237 – 4,240 USD — a concentration of pending sell orders and stop-losses from previous short positions.
The current structure shows strong bullish momentum , however, the possibility of a correction from this high liquidity area is noteworthy.
💎 Technical Analysis
Liquidity Sweep: Completed, clearing liquidity below 4,070.
FVG (Fair Value Gap): 4,191 – 4,202 → filled, confirming price balance.
Sell Liquidity Zone: 4,237 – 4,240 → potential resistance zone, likely strong reaction.
OB Zone | Buy: 4,143 – 4,145 → nearby support, expected first reaction when price corrects.
OB Deep | Buy: 4,110 – 4,115 → deep demand zone, confluence with Premium Zone 4,156 – 4,118.
Overall Structure: The main trend remains bullish , with strong upward momentum but requires a technical correction for re-accumulation.
📈 Trading Scenarios
1️⃣ Main Scenario – Sell reaction at liquidity zone
When the price approaches the Sell Liquidity Zone 4,237 – 4,240 USD , observe candlestick reaction (rejection, bearish engulfing).
If confirmation signals appear, open a short-term sell order .
Target: OB Buy Zone 4,145 → 4,110 USD.
Stop Loss: above 4,245 USD.
➡️ This is a liquidity reaction setup, high probability when the market encounters resistance confluence with Fibonacci zone 0.786–1.0.
2️⃣ Alternative Scenario – Buy with trend from OB
If the price corrects to the OB Zone 4,143 – 4,145 USD and shows a clear reaction (strong rejection or minor structure break),
→ a buy with the main trend can be opened.
Target: return to 4,200 → 4,235 USD.
Stop Loss: below 4,130 USD.
If the price drops further, the OB Deep Buy 4,110 – 4,115 USD will be the final “liquidity attraction” zone for a new upward bounce.
⚠️ Risk Management
Avoid FOMO buying at 4,200+ as it is near the liquidity resistance zone.
Prioritise short-term sell at 4,237 if clear signals are present.
When price corrects to OB, wait for reaction before buying, do not bottom fish early.
💬 Conclusion
After completing the liquidity sweep, gold has confirmed a return to bullish structure with multiple consecutive BoS.
Currently, the price is approaching the liquidity zone 4,237 USD – a short-term correction is highly likely.
The 4,145 – 4,110 USD zone will be where buyers await reaction to accumulate orders and continue the medium-term uptrend.
👉 Reasonable Strategy:
Short sell at 4,237 USD if reversal signals are present.
Wait to buy at OB zone 4,145 – 4,110 USD when clear reaction occurs.

XAUUSD 1H Buy Limit Projection — 15.10.25🟡 Overall Setup
This is a 1-hour timeframe projection chart for XAUUSD (Gold vs USD). The market is currently in a strong uptrend, moving inside an ascending channel (blue trendline).
The price at the time of projection: $4,198.76
🧭 Key Zones & Plan
Entry Zone (Buy Limit):
Marked at $2203–$2206 (FVG zone — Fair Value Gap).
The chart suggests to wait for breakout and retest of the yellow zone before buying.
Support Zone:
Highlighted in yellow box, indicating strong demand area where the breakout is expected to happen.
“CANDLE MOVEMENT AREA” below shows the probable pullback path.
Trade Timing:
Suggested after 11:30 AM (October 15).
Waiting for structure confirmation before entry.
🏁 Target Levels
TP 1: Around $4,228 – $4,243 (0.5–0.618 Fibonacci zone).
TP 2: Around $4,320, which is the top of the ascending structure.
⚠️ Stop Loss Zone
SL is placed below $4,165, under the yellow demand zone.
Protects against false breakout.
📈 Price Movement Projection
The black line arrows project the expected retracement down to entry zone, then bullish breakout and rally upward toward target zones.
Trend continuation is expected until tomorrow with breakout & retest.
✅ Summary of Strategy:
Trend: Bullish
Action: Buy at retest zone (2203–2206)
TP: 4243 (TP1) / 4320 (TP2)
SL: Below 4165
Timing: After 11:30 AM IST

Markets Brace for U.S. Retail Sales & Fed Volatility XAUUSD – Intraday Trading Plan | by Ryan_TitanTrader
📈 Market Context
Gold prices hover near ₹4,190 after an early-week rally as traders brace for U.S. Retail Sales data and a new round of Federal Reserve speeches later today.
Recent gains were fueled by softer inflation readings, yet the dollar remains resilient amid hawkish undertones from Fed officials. Markets are now balancing between expectations of slower growth and persistent rate-cut caution.
A stronger-than-expected Retail Sales print could pressure gold temporarily, but any dovish signal from Fed speakers may quickly restore bullish momentum. Expect liquidity hunts on both sides before a confirmed direction forms.
🔎 Technical Analysis (1H / SMC Style)
• Structure remains bullish after multiple Breaks of Structure (BOS) and a recent Change of Character (ChoCH) confirmation.
• Price is approaching the Premium Zone (4211–4209) — a potential liquidity sweep area where short-term sellers may react.
• Below, the H1 FVG Buy Zone (4145–4149) offers a discount entry aligned with recent BOS support and previous mitigation points.
• Maintaining a bullish bias while awaiting clean reaction within the FVG zone is key for continuation toward new highs.
🔴 Sell Setup: 4211 – 4209
SL: 4218
TP targets: 4190 → 4175 → 4155
🟢 Buy Setup: 4145 – 4147
SL: 4138
TP targets: 4170 → 4190 → 4220+
⚠️ Risk Management Tips
• Wait for M15 ChoCH/BOS confirmation before entry to avoid false breaks.
• Expect high volatility around Retail Sales and Fed remarks — spread widening is likely.
• Partial take-profits near intra-day liquidity points are recommended.
✅ Summary
XAUUSD remains bullish on structure but faces a potential liquidity grab around 4211–4209 before retracing into the H1 FVG buy zone (4145–4149).
Smart money may seek to accumulate long positions after a controlled pullback, especially if Fed commentary echoes a slower policy tightening path.
Intraday bias leans Buy the Dip, with caution around macro-driven volatility spikes.

Gold Pullback Opportunity Within Strong Bullish MomentumAnalysis:
The XAU/USD chart shows that gold has maintained a powerful upward trajectory, breaking out of its previous consolidation channel (highlighted in purple). After the breakout, price surged to new highs near 4,120, confirming strong bullish momentum.
Currently, the market is showing a minor pullback toward the 4,090–4,060 zone — a region aligning with previous resistance turned support. This retracement appears healthy and could provide buyers a chance to re-enter before another leg up.
The bullish continuation setup is supported by:
Previous breakout retest: The price is testing the prior resistance area, which could now act as strong support.
Momentum structure: Higher highs and higher lows remain intact.
Favorable risk-reward ratio: The long position targets around 4,180, with stops below 4,060 support.

GOLD AT ATH! $4,200 BATTLE – Which Fibo Zone Fires First?Gold is fiercely battling the $4,200 mark after hitting a new All-Time High near $4,220. Bulls are pausing, but macro risks (geopolitics, trade war warnings) keep the trend Long. Our focus: Sniping the Reaction Zones.
🎯 THE FIBO ACTION ZONES (H1/M30)
1. STRATEGIC BUY ZONE (Optimal Long Entry):
Zone 1: 4162 - 4158 (The crucial Fibo Retest/0.618 support).
Zone 2: 4144 - 4140 (Deeper strong support).
Action: Wait for the pullback into 4162 - 4158 and execute a BUY upon bullish confirmation.
2. SELL/TP ZONES (Profit Taking & Resistance):
TP Target 1: 4208 - 4212 (Immediate Fibo Resistance).
TP Target 2: 4225 - 4250 (Fibo Extension 1.5 - 1.618).
Action: Look for SCALP SELL opportunities or take profits (TP) here if price rejects these levels.
📈 TODAY'S MOVE: Patience for the 416x retest. Join the Long trend aggressively only after a solid bounce confirmation!
⚠️ Risk Management: Keep SL tight below your chosen BUY Zone. Discipline over FOMO!

Elliott Wave Analysis – XAUUSD (15/10/2025)
1. Momentum
D1: Daily momentum is currently rising and still has room to move into the overbought zone.
➡️ Therefore, the main trend on the D1 timeframe remains bullish until D1 momentum reaches the overbought area and shows signs of reversal.
H4: Momentum on H4 is also rising strongly.
➡️ The upward move is likely to continue until H4 enters the overbought zone and starts to turn down.
H1: H1 momentum is showing slight bearish divergence, suggesting a possible minor corrective pullback in the short term.
2. Wave Structure
D1 Structure: Price is currently in wave 5 (yellow).
A larger correction is only expected once D1 momentum enters the overbought zone, signaling the end of wave 5.
For now, momentum remains bullish → further upside movement is still likely.
H4 Structure: Price is retesting the previous high. There are two possible scenarios:
1️⃣ Formation of a corrective flat or triangle pattern.
2️⃣ Wave 5 (yellow) — which belongs to wave 3 (purple) — is still extending upward.
H1 Structure: After a strong correction, price has rallied back toward the previous high around 4193, which serves as a key resistance zone.
If 4193 holds and price reverses downward, we may see:
• Flat correction: Targeting the 4102 zone – this will be the potential buy area.
• Triangle correction: Price will consolidate narrowly, not dropping deeply toward 4102.
If price breaks above 4193, the next target could be 4234, which may complete wave 5 (yellow).
Since D1 momentum is still rising, it’s not ideal to counter-trade the trend at this stage.
3. Trading Plan
Buy Zone: 4103 – 4101
Stop Loss: 4091
Take Profit: 4151

XAUUSD – Continues to set ATH XAUUSD – Continues to set ATH, prioritise buying according to POC 4,146–4,148 🟡
Gold continues to make higher highs after a strong rise in the Asian session; the upward channel structure remains intact. On H1, POC ~4,147–4,148 is the nearest support point; above is the resistance cluster according to FE 1.618 ~4,186 and the sell zone 4,221–4,240.
Key levels
Support: 4,146–4,148 (POC) • 4,140 (short-term invalid).
Resistance/targets: 4,166 • 4,186 (FE 1.618) • 4,188–4,200 • 4,221 (sell scalping) • 4,240 (sell zone).
Trading scenarios
Buy 1 – POC pullback
Entry 4,146–4,148 | SL 4,140 | TP 4,166 → 4,188 → 4,200 → 4,245.
If it pulls back to POC and H1 shows a confirmation candle/mid-trendline support, prioritise buying.
Buy 2 – Shallow retest
If the price only dips ~4,160–4,162 then rebounds above POC, additional buying is possible with SL 4,152, TP as above.
Sell reaction (higher risk)
Entry 4,240 | SL 4,250 | TP 4,222 → 4,200 → 4,188 → 4,160.
Only trigger when there is a clear rejection signal at 4,221–4,240; this is a counter-trend trade.
Invalidation & management
Buying bias weakens when H1 closes below 4,140 or breaks the lower channel edge.
After TP1, move SL to entry; avoid chasing price in the 4,18x–4,20x area when volume is thin. 🎯
Quick context
The upward momentum is maintained due to expectations of the Fed ending QT/looser conditions and safe haven flows; however, the 4,221–4,240 area may create a short-term reaction before the uptrend continues.
Trade well with this scenario!

Gold → Ready for the Next Bullish WaveGold (XAUUSD) continues to gain momentum as shifting global conditions drive investors toward safer assets. The ongoing uncertainty in financial markets, coupled with renewed concerns over U.S. fiscal policy and interest rate adjustments, has strengthened gold’s long-term appeal.
Recent market behavior reflects consistent institutional demand, with traders positioning ahead of potential monetary easing cycles. As confidence in traditional currencies weakens, gold remains a preferred store of value for both investors and central banks.
Structurally, the market is maintaining a healthy uptrend, showing controlled corrections within a broader bullish framework. The latest price movements suggest that momentum is building for another upward phase, possibly targeting new historical zones if global instability persists.
In summary, gold’s outlook stays constructive — supported by both macroeconomic sentiment and steady technical momentum.
How do you see the XAUUSD trajectory evolving — continuation of growth or a major pause ahead?

Elliott Wave Analysis – XAUUSD | October 14, 2025📊
________________________________________
🔹 1. Momentum
D1:
Daily momentum has started to turn upward from the oversold zone, suggesting that the bullish pressure may continue throughout the week.
H4:
On the H4 chart, momentum is stuck together in the overbought zone, indicating that a reversal could occur at any moment.
Currently, there have been 13 consecutive bullish candles in the H4 momentum cycle — a typical length before a reversal often appears.
👉 Therefore, avoid chasing long positions (Buy) at this stage.
H1:
H1 momentum is also deep in the overbought area, which means a short-term correction could take place soon.
________________________________________
🔹 2. Wave Structure
D1:
The current pattern shows that Wave 5 is extending, which makes it difficult to project the exact target using Fibonacci ratios.
However, an extended fifth wave usually ends with a sharp and decisive decline, which serves as a confirmation that Wave 5 has completed.
H4:
Price is currently forming Wave 5 (yellow), which also represents Wave 3 (purple) in the higher degree.
Thus, the uptrend is still intact for now.
Once Wave 5 (yellow) — equivalent to Wave 3 (purple) — finishes, the market will likely enter a corrective phase (Wave 4 purple), which would align with a momentum reversal on H4.
H1:
On the Elliott channel drawn from Wave 2 → Wave 4 → Wave 3 (yellow), price has broken above the upper boundary, which could be a throw-over pattern.
If price returns and closes back inside the channel, it would confirm the completion of Wave 5.
Connecting Wave 1 and Wave 3 highs, we can see that price is now above this trendline, and the 4157 zone coincides with the 0.618 Fibonacci extension of Waves 1–3 — forming a strong confluence area where a correction is likely to begin.
________________________________________
🔹 3. Trading Plan
At the moment, price is sitting around a major top, where the Monthly Wave 3 and the Weekly Wave 5 structures converge.
👉 This means volatility could be high and unpredictable.
For now:
• Avoid swing trades,
• Focus only on short-term scalp opportunities with tight targets,
• Wait for a clear confirmation signal at the top zone before entering new positions.

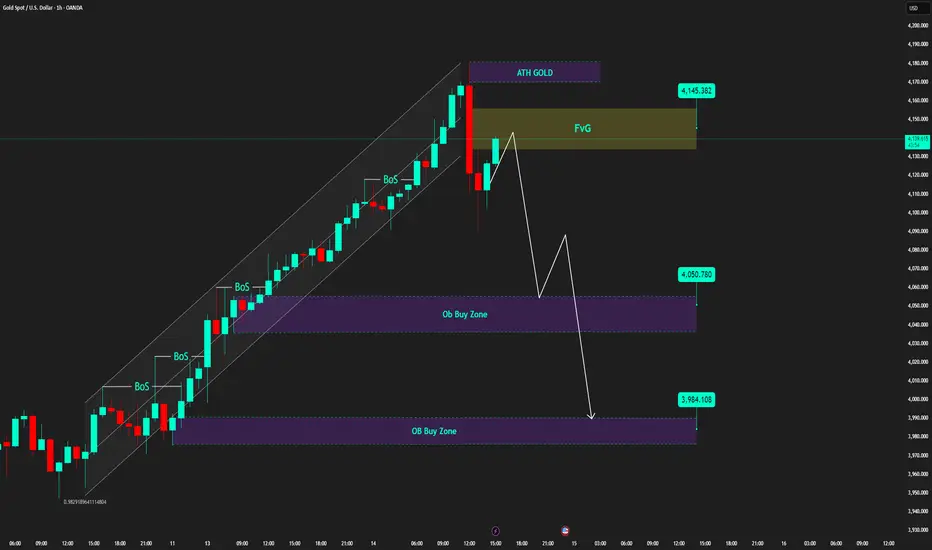
m15 timeframe sees gold drop sharply by 50 points 🔍 Market Context
Gold prices have just reached an all-time high (ATH GOLD) around the 4,180 USD mark, following a steep upward rally over several sessions.
Immediately after, the market witnessed the first break of structure (BoS) – a sign that the upward momentum is weakening .
Currently, prices are returning to fill the Fair Value Gap (FVG) at 4,125 – 4,145 USD , and this is likely a liquidity rebalancing phase before prices choose the next direction.
💎 Technical Analysis
ATH GOLD: 4,180 – 4,185 USD
Fair Value Gap (FVG): 4,125 – 4,145 USD → an empty price zone that needs to be filled.
Order Block Buy Zone 1: 4,050 – 4,060 USD → the nearest demand zone, potentially creating the first technical reaction.
Order Block Buy Zone 2: 3,980 – 3,985 USD → a deeper demand zone, large liquidity confluence, possibly becoming the main "accumulation point."
Overall Structure: After breaking the upward channel, the market is in a retracement phase – the medium-term structure remains bullish .
📈 Trading Scenarios
1️⃣ Short-term Sell Scenario – filling FVG and technical adjustment
If prices continue to test the FVG 4,125 – 4,145 USD zone without surpassing it,
→ consider a short-term sell to catch the technical retracement phase.
Target: the first OB Buy Zone at 4,050 USD .
Stop Loss: above 4,155 USD (to avoid being swept above the FVG peak).
➡️ This scenario suits short-term traders following corrective waves – only enter when there is a clear reversal candle confirmation.
2️⃣ Trend-following Buy Scenario – catching the rebound from OB Zone
If prices adjust to the 4,050 – 4,060 USD zone, observe reaction signals such as Bullish Engulfing or strong Rejection .
Upon confirmation, initiate a trend-following buy order .
Target: zone 4,125 → 4,145 USD or the previous peak at 4,180 USD.
Stop Loss: below 4,030 USD.
If the first OB zone does not hold, the 3,980 – 3,985 USD zone will be an ideal area for long-term "accumulation."
⚠️ Risk Management
Avoid FOMO buying at high prices when the FVG is not yet filled.
Prioritise trading at clear reaction zones (OB, FVG edge).
Reduce volume when entering counter-trend orders to preserve capital.
💬 Conclusion
After a steep rise, gold is entering a value rebalancing phase .
The current market structure leans towards a short-term technical retracement before continuing the main upward trend.
If the 4,050 – 4,060 USD zone reacts well, gold may soon rebound and aim for the 4,150 – 4,180 USD zone.
👉 Reasonable Strategy:
Short-term sell when price reacts at FVG.
Wait to buy at OB Buy Zone when there is a confirmed bullish signal.
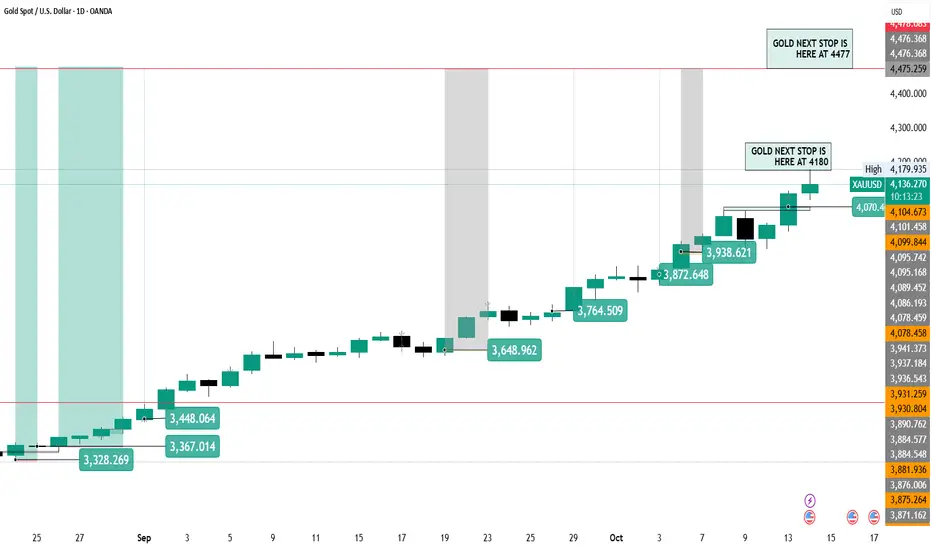
This is my next #gold tp in next 2-3 week and hight will be 4477This is my next #gold tp in next 2-3 week and hight will be 4477This is my next #gold tp in next 2-3 week and hight will be 4477This is my next #gold tp in next 2-3 week and hight will be 4477This is my next #gold tp in next 2-3 week and hight will be 4477This is my next #gold tp in next 2-3 week and hight will be 4477This is my next #gold tp in next 2-3 week and hight will be 4477This is my next #gold tp in next 2-3 week and hight will be 4477
GOLD CRASH ALERT: +60 PRICES DUMP! Waiting for the Ultimate Fibo React BUY Zone.
FranCi$$_FiboMatrix Emergency Action Plan
Gold just suffered a brutal 60-point plunge from 416x to 411x, triggered by mounting geopolitical tensions. The market is volatile, and deep correction is highly likely. We must trade smart, not emotionally.
🎯 EMERGENCY ACTION ZONES (H1/M30)
Avoid chasing! We only trade when price hits our calculated FIBO REACTION ZONES.
1. SCALP SELL RETRACEMENT:
Zone 1 (High): Watch the 407x area (4,077.605).
Zone 2 (Key Fibo Resistance): The 405x area (4,048.493).
Action: If price bounces back into either zone, look for strong bearish rejection to execute a SCALP SELL.
2. CRITICAL BUY REACT ZONE (The Lifeline):
Zone: We are waiting for the AD's updated FIBO REACTION zones that conform to the new deep trend.
Action: DO NOT BUY BLINDLY. Only enter a Long when the price reaches these deeper support levels and gives a strong, confirmed BUY REACT signal.
⚠️ Immediate Focus: OBSERVE & WAIT. The AD will provide continuous updates. Manage risk strictly—this volatility demands discipline!

XAUUSD – Liquidity Sweep “Flush”XAUUSD – Liquidity Sweep “Flush”; prioritise trading around key zones 🟡
Gold just dropped nearly 90 points during the Asian session – a time typically lacking volume, resulting in a “flush” that wiped out many leveraged positions. The larger trend remains bullish, but short-term risks of a deep pullback are present before the European–American markets engage.
The accompanying image shows:
Price peaked and then broke the upper edge of the H1 uptrend channel → quickly fell to the mid-channel zone.
Thick Volume Profile cluster around 4.07x, POC ~4,075; below lies VAL ~4,025.
Sell retest zone marked around 4.14x; grey boxes indicate buy zones at 4,075 and 4,056.
Key Levels
Resistance: 4,143–4,150, 4,122, 4,160.
Support: 4,075 (POC), 4,056 (buy scalping), 4,025 (VAL).
Scalping watch: 4,057 – 4,085 – 4,160 – 4,025.
Trading Scenarios
SELL retest (reaction, higher risk)
Entry: 4,143
SL: 4,150
TP: 4,122 → 4,105 → 4,078 → 4,050
Idea: activate only upon clear rejection at 4.14x (long wick/engulfing H1).
BUY at POC zone
Entry: 4,075
SL: 4,067
TP: 4,089 → 4,100 → 4,122 → 4,155
BUY scalping (shallow pullback)
Entry: 4,056
SL: 4,049–4,050
TP: 4,075 → 4,089
Invalidation: short-term buy bias weakens if H1 closes below ~4,025 (VAL). If this zone breaks, prioritise waiting for a failed retest to consider selling with the continued downtrend.
Practical Notes
The range is currently very wide; the European session will increase volume, making false breaks more likely.
After TP1, move SL to entry to secure the position.
Sell orders are merely reaction trades at 4.14x; prioritise buy-the-dip at 4,075/4,056 upon confirmation signals.

XAUUSD – Sharp Pullback After Hitting New ATHMarket Context:
Gold has seen a steep intraday drop after hitting a fresh all-time high at 4,179 USD/oz, extending beyond the morning target of 4,170–4,172.
The move likely reflects profit-taking amid broader market caution, as the US Dollar strengthened and GBP fell sharply, indirectly weighing on XAUUSD.
Silver also followed the correction, down over 2%, trading near 51 USD/oz after peaking at 53.60 earlier.
Despite this drop, the overall market sentiment remains defensive — both metals are still up about 2% for the week, suggesting this is a technical retracement, not a full trend reversal.
Technical Outlook (M30):
Price has broken below the short-term rising channel and is now retesting key liquidity areas.
Watch the 4,134 – 4,135 zone for a potential retest (50% pullback) before continuation toward lower buy zones.
End Liquidity Sell Zone: 4,165 – 4,170
Retest Zone (50% Down): 4,134 – 4,135
CP Buy Zone / Fibo 0.618: 4,052 – 4,054
OBS Buy Zone: 4,000 – 4,005
Trading Plan:
🔹 Sell Setup (Correction Play):
Entry: 4,134 – 4,136
Stop Loss: 4,142
Take Profit: 4130 - 4125 - 4120 - 4110 - 4100 - ???
🔹 Buy Setup (Reaction Zone):
Entry 1: 4,052 – 4,054 (Fibo 0.618 Confluence)
Stop Loss: 4,044
Take Profit: 4056 - 4060 - 4065 - 4070 - 4080 - 4090 - ???
Summary:
Gold’s sharp drop after a new ATH signals a short-term correction phase while the broader bullish trend stays intact.
A pullback toward 4,052 or even 4,000 could attract buy-side liquidity before any recovery.
Keep an eye on 4,135 for a potential retest before continuation.
📊 What’s your view — is this just a healthy retracement or the start of a deeper correction?
👉 Follow MMFLOW TRADING for precise intraday setups and structure-based analysis.

Gold 1H – Price Reaction Ahead of U.S. Retail Sales & Fed RemarkXAUUSD – Intraday Trading Plan | by Ryan_TitanTrader
📈 Market Context
Gold is trading around the ₹4,110 mark, consolidating after a strong impulsive rally earlier this week.
Traders are now shifting focus to U.S. Retail Sales data and a series of Federal Reserve remarks due later today — both key drivers that could influence near-term expectations for the next rate decision.
After last week’s soft inflation signals, gold initially extended higher, but rising Treasury yields and cautious sentiment ahead of today’s macro releases have slowed momentum.
Any hawkish Fed tone or stronger consumer spending data could weigh on XAUUSD, triggering a liquidity sweep from the premium zones before the next accumulation phase begins.
🔎 Technical Analysis (1H / SMC Style)
• Structure shows a confirmed BOS on lower timeframes, signaling the end of the previous impulsive leg.
• Price currently sits within a Mitigation Zone (4117–4110), reacting to prior imbalance after a clean sweep of internal liquidity.
• The Premium Liquidity Zone (4217–4215) aligns with a Rejection Block and is likely to act as a short-term Sell Zone.
• Below, the 4056–4058 area marks a Buy-Side Support, overlapping with a previous ChoCH and internal discount OB.
• Expect a short-term sell reaction from premium zones before a possible bullish mitigation bounce off support.
🔴 Sell Setup: 4217–4215
SL: 4224
TP targets: 4200 → 4175 → 4160
🟢 Buy Setup: 4056–4058
SL: 4050
TP targets: 4070 → 4090 → 4100+
⚠️ Risk Management Tips
• Wait for M15 ChoCH / BOS confirmation before executing either setup.
• Be cautious during Fed remarks — volatility spikes are common around liquidity levels.
• If price reacts impulsively from 4217 with displacement, partial shorts are favored.
• Conversely, if 4056 holds and forms clean bullish structure, it could serve as the base for the next expansion leg.
✅ Summary
Gold is likely to engineer a liquidity grab in the premium zone (4217–4215) before retracing into the mitigation area near 4056–4058, where smart money may accumulate long positions.
The day’s direction will hinge on how markets interpret upcoming U.S. Retail Sales data and Fed tone — expect volatility and false breaks before the true directional move forms.

XAU/USD – Liquidity Cleared, Gold Reloads for the Next Breakout🔍 Market Context
This morning, gold price (XAU/USD) experienced a classic liquidity sweep :
The price surpassed the previous high of 4058 , touched 4060 , wicked strongly , and short-term corrected – a textbook “liquidity hunt” by major funds.
After this drop, the price recovered back to the old ATH zone (4055 – 4060) .
This indicates that short-term sellers have weakened , and buyers are reclaiming the crucial structure zone .
Therefore, selling strategy is no longer optimal , instead, the market is preparing for a re-accumulation – next breakout.
💎 Technical Analysis
Current ATH: 4060 USD
Previous High: 4058 USD
This morning's liquidity sweep “cleared out” liquidity above, paving the way for a re-accumulation phase before the next rise.
The zone 4048 – 4052 is acting as a retest zone – if it holds, this could be the “launchpad” for a breakout to higher price zones.
Overall Structure: still bullish , no signs of medium-term reversal.
⚙️ Key Price Zones
Retest Zone: 4048 – 4052 → support zone after the sweep, where the price might bounce back.
Breakout Zone: 4065 – 4070 → zone confirming buyers regain dominance.
Extended Target: 4090 – 4100 USD.
Invalidation Zone: below 4040 USD → if breached, the short-term bullish structure will weaken.
📈 Trading Scenarios
1️⃣ Buy Continuation Scenario – Buy with the main trend
Wait for the price to retest the 4048 – 4052 zone , observe bullish candle reactions or confirmation signals (Engulfing, Rejection).
Open a buy order upon confirmation of holding the support zone.
Target: 4065 → 4090 USD.
Stop Loss: below 4040 USD.
➡️ This is a trend-following scenario, with the highest probability when the market has completed the liquidity sweep and is re-accumulating.
2️⃣ Buy Breakout Scenario – Buy on confirmed breakout
If the price breaks and closes above 4065 , it signals that major funds have returned.
Open buy stop or limit retest breakout around 4065 – 4070.
Extended Target: 4090 → 4100 USD.
Stop Loss: below 4050 USD.
➡️ This scenario suits momentum traders, avoiding the risk of “fake breakout” by waiting for clear confirmation.
⚠️ Risk Management
Do not sell against the trend at the ATH zone, as liquidity above has been taken.
Maintain reasonable volume when trading around the peak zone.
Prioritize buying when there is confirmation of the bullish structure holding the 4050 zone .
💬 Conclusion
This morning's liquidity sweep has shaken out weak hands , while helping gold pave the way for the next rise .
Currently, the price is re-accumulating around the old peak zone 4055 – 4060 , and if the zone 4048 – 4052 continues to hold, there is a high possibility that gold will break out to the 4090 – 4100 USD zone in the upcoming sessions.
👉 Reasonable Strategy:
Wait to buy at the support zone or buy when the price breaks above 4065.
Avoid selling against the trend now – the risk is very high as major funds have shifted to the accumulation phase.

Gold 1H – Potential Liquidity Sweep Before Fed SpeechesXAUUSD – Intraday Trading Plan | by Ryan_TitanTrader
📈 Market Context
Gold remains steady near ₹4,065, as traders eye upcoming U.S. PPI data and Fed officials’ speeches later today for new guidance on the inflation outlook.
The recent rise in Treasury yields has slightly capped gold’s upside momentum, but underlying safe-haven demand persists amid ongoing geopolitical and economic uncertainty.
If the PPI print shows softer inflation, gold could attract renewed buying; however, a hotter reading may spark another liquidity sweep lower before any sustained rally.
🔎 Technical Analysis (1H / SMC Style)
• ChoCH confirmed at 4060+, showing potential exhaustion in the current short-term uptrend.
• Price tapped the premium zone (4080–4078), aligning with previous liquidity and imbalance — ideal for a short-term sell setup.
• A BOS formed at 4017, opening the way for retracement toward the discount zone (3999–3997).
• The 3997–3999 area is a strong demand zone, overlapping with a prior ChoCH and liquidity void — a potential reversal area for bulls.
• Expect a liquidity grab at 3990 before a bullish reaction if structure holds.
🔴 Sell Setup: 4080–4078
SL: 4087
TP targets: 4040 → 4015 → 4000
🟢 Buy Setup: 3999–3997
SL: 3990
TP targets: 4035 → 4060 → 4100+
⚠️ Risk Management Tips
• Wait for M15 ChoCH / BOS confirmation before triggering entries.
• Avoid over-leverage during Fed speech hours — price may fake out around liquidity levels.
• If price sweeps 4080 liquidity and rejects impulsively, partial short entries are favored.
• Conversely, if 3997 holds firm with strong bullish structure, watch for re-entry confirmation to ride the next expansion.
✅ Summary
Gold is currently playing within a premium-to-discount framework, as smart money may engineer a sweep of 4080 liquidity before driving price down toward 3997–3999 to collect buy-side orders.
After that, a strong bullish reaction is expected from the demand zone if macro conditions (like soft PPI or dovish Fed tone) support it.
Stay patient — structure confirmation is key before entering either direction.

XAU/USD: GOLD HITS NEW ATH! Buy or Sell Now?Gold (XAU/USD) is absolutely on fire, hitting a Fresh All-Time High (ATH) this morning! This massive breakout isn't random; it's a direct outcome of global risk factors lining up, making gold the ultimate safe haven:
🇺🇸🇨🇳 Trade War Reloaded: Trump's shocking 100% tariff threat on China exports has brought back major global uncertainty. Though he's softened his tone, the damage to sentiment is done, pushing money into gold.
⚠️ Geopolitical Heat: Warnings about sending Tomahawk missiles to Ukraine keep geopolitical tensions brewing, acting as a continuous tailwind for the metal.
🏛️ US Shutdown Drama: The ongoing US government funding deadlock is a big worry, further driving flight-to-safety flows.
✂️ Fed Rate Cut Confidence: High probability of Fed rate cuts in Oct/Dec (96%/87%) provides strong support, reducing the opportunity cost of holding non-yielding gold.
🔍 TECHNICAL ANALYSIS: Structure is Full-On BULLISH!
The price action today is textbook, showing exactly how Smart Money operates:
Liquidity Sweep & FVG: Price first wicked sharply below 4000 for a classic Liquidity Sweep—hunting weak hands' Stop-Losses—and created a temporary Fair Value Gap (FVG), before reversing with massive momentum.
Structural Break (BOS & MSS): This aggressive move resulted in a clean Break of Structure (BOS) above the old ATH at 405x, confirming a major Market Structure Shift (MSS). The trend is now unequivocally BULLISH.
Trading Plan - The Right Way:
Priority: Stick with BUY positions! The bias remains bullish as long as price holds above the Order Block (OB) support at 405x. This is the key level.
Big Warning: Don't try to short the top (sell dò đỉnh)! The risk of getting caught in a liquidity grab or price trap at these highs is extremely high. Stay away from counter-trend moves.
Sell Scenario (Only if): We only consider a short-term SELL if there's a strong, confirmed candle close below 405x. In that case, we might target a minor pullback to 4000 for profit booking, but the main goal remains to BUY on dips.
👉 Bottom Line: Fundamentals and technicals are singing the same tune. 405x is the line in the sand. Trade carefully, manage your stop-loss, and always do your own research (DYOR).
#GOLD #XAUUSD #ATH #MarketUpdate #TradeWar #FED #SmartMoney #ICT #TechnicalAnalysis #SafeHaven #DYOR

XAUUSD HIT MY STOP LOSSGold just broke above our previous OB/Liquidity resistance around 4040–4055, taking out the short-side liquidity and confirming a bullish market structure shift (MSB) on 15M and 1H timeframes.
🔹 Previous plan: Sell-limit at resistance — invalidated as price made a new high.
🔹 Current bias: Bullish continuation towards 4078 → 4095 → 4120.
🔹 Pullback zones to watch:
• 4035–4045 (OB retest / liquidity grab area)
• 4005–4020 (golden pocket confluence)
🧠 Trading Plan:
Wait for price to retrace into key support zones.
Look for bullish rejection / confirmation before entering long.
First TP near 4078, extended targets 4095+
SL below 4020 zone (structure invalidation).
💬 Price action respected structure beautifully. Remember — the market doesn’t care about our limits, only about liquidity.
Trade what’s visible, not what’s emotional.
#XAUUSD #GoldForecast #ForexTrader #SmartMoneyConcepts #LuxAlgo #OrderBlockTrading #LiquiditySweep #PriceAction #GoldAnalysis #TradingStrategy #TechnicalAnalysis #ForexSetup #DayTrading #ChartAnalysis #TradingView #alphatechfinances
