LiamTrading – Gold compressed at the triangle peak; watch for...LiamTrading – Gold compressed at the triangle peak; watch for a break at 4020 (H2)
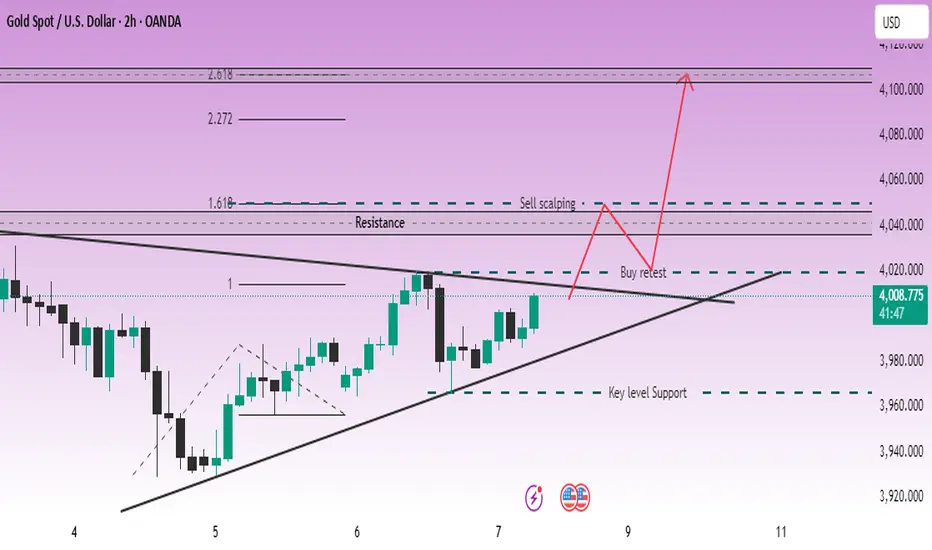
After a week of accumulation, the price is pressing against the triangle peak between the descending trendline (from late October) and the ascending trendline (from 5/11). The advantage will clearly lean towards an increase if 4020 is broken and held.
Technical Analysis (prioritise H2, Volume Profile – Trendline – S/R – Fibonacci)
Trendline & Structure
The descending trendline is blocking recovery waves; the ascending trendline supports adjustment waves.
Closing the H2 candle above the confluence area ~4020 will confirm a clear upward movement.
Support / Resistance (S/R)
Main support: 3970–3972 (swing low & “Key level Support”).
Decision zone: 4014–4020 (break–retest zone).
Resistance: 4045 (medium-term), 4050 (supply for scalp orders), upper band 4105–4110.
Volume Profile (recent session / composite)
POC magnet: 4015–4017 → likely profit-taking/fluctuations; staying above POC turns this area into a launchpad.
LVN: around 4020 → beautiful break-and-go; failing to hold often pulls back to 4015/4010.
Fibonacci Extension (H2 swing)
1.618 coincides with 4045–4050 → first upward target.
2.272/2.618 creates a liquidity zone 4095–4110 → area may weaken/strong profit-taking.
Today's Trading Scenarios
Scenario 1 – Buy on breakout direction
Entry: 4020–4022 after closing above trendline + retest holding 4018–4020
SL: 4014
TP: 4045 → 4070 → 4100–4110
Management: Partially close at 4045; move SL to breakeven when reaching +1R. Staying above 4020 means POC 4015–4017 should switch roles to support.
Scenario 1b – Buy on adjustment wave (before breakout, cautious volume)
Entry: 3998–4002 (“400x”) when there is an upward reaction at the ascending trendline
SL: 3988
TP: 4017 → 4045
Note: H2 closes below 3988 → cancel the order.
Scenario 2 – Sell scalp at resistance
Entry: 4048–4052 (confluence Fibo 1.618 + supply zone)
SL: 4056
TP: 4040 → 4030 → 4020
Note: This is counter-trend. Ignore if H2 closes strongly above 4052.
Summary
The upward bias is confirmed when breaking–holding 4020, opening targets 4045 → 4070 → 4100+. Before that signal, trade within the range respecting POC 4015–4017 and ceiling 4045/4050. Risk per order 0.5–1%, move SL to BE when reaching +1R.
Xauusdanalysis
Gold 1H – Pullback Expected as USD Softens After Jobless Claims🟡 XAUUSD – Intraday Trading Plan | by Ryan_TitanTrader
📈 Market Context
Gold is trading within a corrective structure today as the U.S. dollar weakens slightly following higher-than-expected Jobless Claims.
Market sentiment remains mixed ahead of upcoming Fed speeches, which could provide clues about December policy expectations.
• A more hawkish tone could trigger a deeper downside move toward unfilled discount zones.
• Conversely, any dovish signals may push gold into a short-term liquidity grab before resuming its corrective trend.
Liquidity remains concentrated near the $4,030 area, where price may tap into resting buy-side liquidity before forming the next bearish leg.
🔎 Technical Analysis (1H / SMC Style)
• Structure: Current bias shows corrective bearish intent following recent ChoCH → BOS sequence on H1.
• Premium Zone: The 4030–4028 region aligns with an unmitigated H1 supply — ideal for continuation shorts.
• Liquidity Sweep: Price may reach 4030 to sweep early breakout buyers before confirming downside continuation.
• Discount Zone: Strong demand sits at 3932–3934, overlapping with previous bullish displacement and unmitigated demand.
🔴 Sell Setup
• Entry: 4030 – 4028
• Stop-Loss: 4040
• Take-Profit Targets: → 3980 → 3964 → 3934 (major demand zone)
🟢 Buy Setup (Countertrend Reaction)
• Entry: 3932 – 3934
• Stop-Loss: 3925
• Take-Profit Targets: → 3964→ 3995 → 4020
(Only valid if liquidity sweep and bullish reaction occur at the demand zone)
⚠️ Risk Management Notes
• Wait for M15 BOS/ChoCH confirmation at both zones to avoid premature entries.
• Avoid trading directly at the minor support around 3964 — it is not a valid SMC entry zone.
• Prioritize the sell setup; intraday bias remains corrective-bearish within a broader range.
• Secure partial profits at the first liquidity target and trail stops according to structure.
✅ Summary
Gold is likely to seek premium liquidity near 4030 before resuming its corrective move lower.
The 4030–4028 supply area offers a clean continuation-short entry, while 3932–3934 remains the strongest discount zone for reactive long setups.
Stay adaptable — the market maintains a mild bearish tone while waiting for further Fed guidance.
FOLLOW RYAN_TITANTRADER for daily SMC setups ⚡

XAUUSD – AWAITING CONFIRMATION OF UPTREND – TARGET 4050💛 XAUUSD – AWAITING CONFIRMATION OF UPTREND – TARGET 4050 🎯
🌤 1. Overview
Hello everyone 💬
Gold today remains in a phase of indecision – waiting for signals to confirm a new trend.
On the H2 chart, the price has broken the downtrend line and is retesting this line. The structure of “higher lows” indicates that buying pressure is gradually gaining dominance.
The previous peak around 4018 is currently the decisive point for the trend – if the price confirms a breakout above, the upward momentum may extend towards the 4050 area.
Currently, the market is fluctuating within the range of 3964 – 4018, and needs to break out of this zone to determine a clearer direction.
💹 2. ICT Perspective
📈 The price has broken the downtrend line and retested the structure on the H2 chart – an early signal for the potential formation of an uptrend.
🟣 The area 3964–4018 is a short-term liquidity accumulation zone before the price expands.
🔹 OB 4040–4042 coincides with significant resistance, suitable for short sell orders (scalp) if there is a strong reaction.
💫 When the price surpasses 4018, the upward structure will be confirmed and the expansion target may aim towards 4050 – 4077.
🎯 3. Reference Trading Plan
💖 BUY scenario (priority when confirmed)
Entry: above 4018 | SL: 4011
TP: 4025 – 4033 – 4050 – 4077
💢 Short SELL scenario (scalping)
Entry: 4040–4042 | SL: 4046
TP: 4022 – 4015 – 3998
⚠️ 4. Important Notes
Clear confirmation is needed when breaking the 4018 zone before entering a buy order.
If the price continues to fluctuate within the 3964–4018 range, trading should be limited.
Today is Friday, manage risk more tightly, prioritise accuracy in each order.
🌷 5. Conclusion & Interaction with LanaM2
Gold is showing positive signals 💛
Be patient and wait for reactions around the 4018 zone – this could be the start of a new uptrend if clearly confirmed.

XAUUSD – Consolidation Before Drop**Gold (XAUUSD) – Consolidation Before Potential Downside Move**
Gold continues to hover in a consolidation range after the recent breakout and structural shift on the 3H chart. The bullish momentum that previously dominated has now slowed, indicating a possible distribution phase forming near the $4,050–$4,100 zone.
The market structure shows repeated rejections at the upper boundary, suggesting that buyers are losing strength. With BOS (Break of Structure) confirmations in the recent candles and a clear lack of higher highs, a potential downside continuation could unfold once the current range is broken.
If sellers take control below $3,978, the next liquidity targets lie around **$3,886** and possibly **$3,614**. This scenario aligns with the broader retracement expectation after a strong prior uptrend.
However, a confirmed breakout above the consolidation area would shift the short-term bias back to bullish, with upside potential toward **$4,248** and beyond.
**Market Outlook:** Neutral → Bearish
**Bias:** Short-term corrective move expected
**Key Levels:**
* Resistance: $4,050 – $4,100
* Support: $3,886 – $3,614
**Tags:** #Gold #XAUUSD #GoldAnalysis #XAUUSDforecast #GoldPricePrediction #GoldTrading #GoldMarket #Commodities #TradingViewIdeas

XAUUSD | Gold 4H Breakout Setup | Wait for Retest Before Long Gold is currently trading near the 4H resistance zone after a short-term recovery move. The price is approaching a key supply area where a breakout or rejection can decide the next direction. I am planning a long entry only after a proper retest to avoid chasing the move.
Key Levels:
• Resistance: 4045 – 4075
• Strong Support: 3955 – 3980 (200 EMA zone)
• Major Upside Target after breakout: 4210 – 4230
Trade Plan:
1. Let price approach the resistance zone
2. Wait for breakout and then retest near 4045 – 4075
3. Look for bullish rejection candle to confirm entry
4. If retest holds, next leg up toward 4210 is possible
Why Wait for Retest?
Retest reduces false breakout risk and improves risk to reward. Market is still recovering from a previous strong sell-off, so patience gives a more controlled entry.
Sentiment: Neutral to Bullish
Timeframe: 4H
Style: Swing / Position
Disclaimer:
This is not financial advice, just my personal price structure view.
LiamTrading – Gold confirms medium-term uptrendLiamTrading – Gold confirms medium-term uptrend
Gold has officially broken the downward trendline, confirming the transition phase to a medium-term uptrend. After a prolonged accumulation phase, the market is beginning to show clear buying power, and the potential for an extended rally is gradually forming.
Macro – Fundamental Analysis
The latest report from the World Gold Council (WGC) shows that central banks continued to increase gold purchases significantly in September, totalling 39 tonnes, the highest level since the beginning of the year.
Most notably, the Central Bank of Brazil – for the first time this year – added 15 tonnes of gold to its national reserves.
Since the beginning of the year, the net purchases by central banks have reached 200 tonnes, clearly reflecting the trend of moving away from the USD amidst global economic and geopolitical instability. This capital flow provides a solid foundation for the medium and long-term uptrend of gold.
Technical Analysis
On the H2 chart, gold prices have broken the downward trendline, signaling a reversal and establishing a new upward structure.
The 3985–3988 zone is acting as dynamic support, potentially serving as a retest point before prices continue to rise.
The POC of the Volume Profile at the 4015–4017 zone is a short-term resistance, where the market may see profit-taking reactions before breaking higher.
The 4046 mark is considered a decisive zone; if surpassed and held, the medium-term uptrend will be strongly reinforced.
Today's Trading Scenarios
Scenario 1 – Buy in line with the uptrend:
Entry: 3986–3988 (may wait for retest confirmation)
SL: 3980
TP: 4020 – 4045 – 4090
Scenario 2 – Short sell at resistance:
Entry: 4015–4017
SL: 4023
TP: 4002 – 3986
Summary
Gold is giving clear signals of establishing a medium-term uptrend, supported by buying flows from central banks. Traders should prioritise buying positions at strategic support zones and observe price reactions around the POC to confirm the next direction.

Gold Holds 3,980$ as Bulls Eye Recovery Toward 4,020$🔍 Market Context
Gold steadies near the 3,980$ mark as traders weigh shifting expectations on US interest rates.
The latest ADP employment report showed a modest increase of 42,000 jobs — easing fears of an accelerated slowdown but reinforcing the broader cooling trend in the labor market.
While the Federal Reserve’s rate cuts have supported bullion throughout the year, the prolonged US government shutdown now clouds macro visibility, delaying key economic data.
Despite mixed sentiment, gold remains one of 2025’s strongest-performing assets, up over 50% year-to-date, driven by ETF inflows and central bank demand.
📊 Technical Outlook (H1–H4)
Gold has staged a notable rebound from the 3,947$–3,969$ demand zone, reclaiming short-term structure and approaching the 3,990$–4,000$ liquidity pocket.
This area aligns with the 0.618 Fib retracement and descending trendline resistance — making it the next decision point for intraday traders.
Key Technical Zones:
• 💎 Support: 3,947$ – 3,969$ (Liquidity Base / Re-accumulation)
• 🎯 Resistance: 3,992$ – 4,024$ (Fibo 0.618 + Trendline Confluence)
• ⚙️ Extended Bull Target: 4,028$ – 4,033$ (1.272–1.618 Fibo Expansion)
• ⚠️ Invalidation: Below 3,940$ → shifts bias toward 3,905$ liquidity pool.
🎯 MMFLOW View
Smart money continues to accumulate within the re-accumulation pocket near 3,950$, hinting at latent bullish intent.
If price holds above 3,970$ after today’s consolidation, an extension toward 4,020$–4,033$ remains highly probable.
However, failure to maintain intraday demand could invite another liquidity sweep before a larger push higher.
⚜️ MMFLOW Insight:
“Liquidity reveals intention — structure only confirms it.”

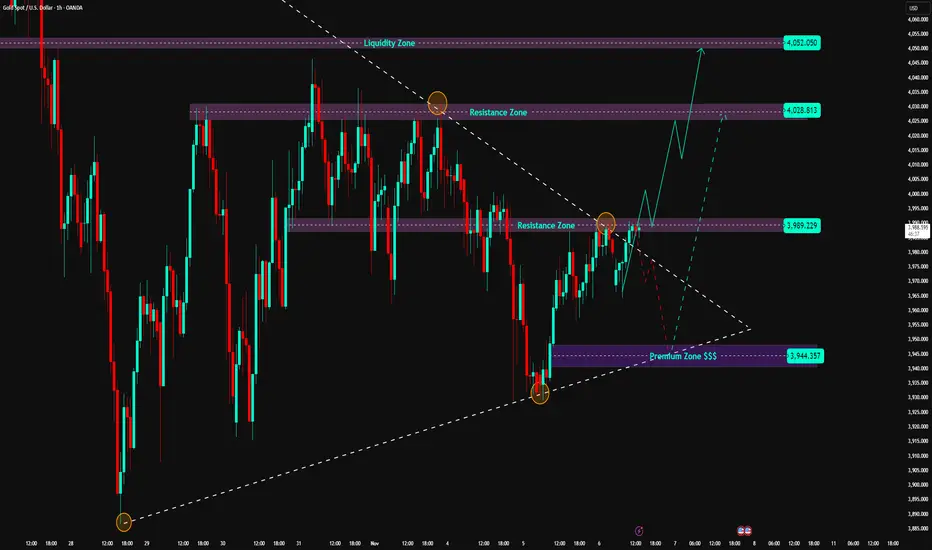
Gold Testing Resistance, Compression Structure Set to Break📊 Market Structure
On the H1 chart, gold is forming a compression structure between the Support 3,944 USD and Resistance 3,989 USD zones.
The recent lows create a series of Higher Lows along the rising trendline – indicating buyers are quietly absorbing supply around the lower region.
However, the 3,989 USD zone remains the central resistance axis , converging with the descending trendline formed from the previous peak (4,028 USD). Each time the price hits this zone, a short-term profit-taking reaction occurs, showing strong defense from sellers.
Below the support zone, the Premium Zone 3,944 USD continues to be the main pivot point – where the price has previously surged strongly in the last two sessions.
If this zone is breached, the short-term bullish structure will be invalidated, opening up the possibility of returning to the Liquidity Zone around 3,921 – 3,892 USD .
Conversely, if the price closes above 3,989 USD , the market will confirm a Bullish Break of Structure (BoS), triggering an extended target towards 4,028 – 4,052 USD .
💎 Key Technical Zones
• Resistance Zone 1: 3,989 USD → main resistance, strong reaction zone.
• Resistance Zone 2: 4,028 – 4,052 USD → upper liquidity target zone.
• Support Zone: 3,944 USD → dynamic support, converging with the rising trendline.
• Liquidity Zone: 3,921 – 3,892 USD → the last zone protecting the bullish structure.
🎯 Trading Scenarios
1️⃣ BUY Scenario – Await Confirmed Breakout:
If the price closes above 3,989 USD and successfully retests:
• Entry: 3,985 – 3,995
• SL: 3,965
• TP1: 4,015
• TP2: 4,028
• TP3: 4,052
2️⃣ SELL Scenario – React at Resistance:
If a reversal candlestick pattern appears at 3,989 USD:
• Entry: 3,985 – 3,990
• SL: 4,000
• TP1: 3,965
• TP2: 3,950
• TP3: 3,944
🧠 Vincent’s View
Gold is in a “compression before breakout” phase, with liquidity concentrated around the 3,989 USD zone.
If this zone is broken, the price could quickly surge to the supply area above 4,028 – 4,052 USD.
If it fails, a price rejection here could pull gold back to the rising trendline at 3,950 USD.
“Compression breeds expansion — let price show which side holds conviction.” ⚜️
⏰ Timeframe: 1H
📅 Updated: 06/11/2025
✍️ Analysis by: Captain Vincent
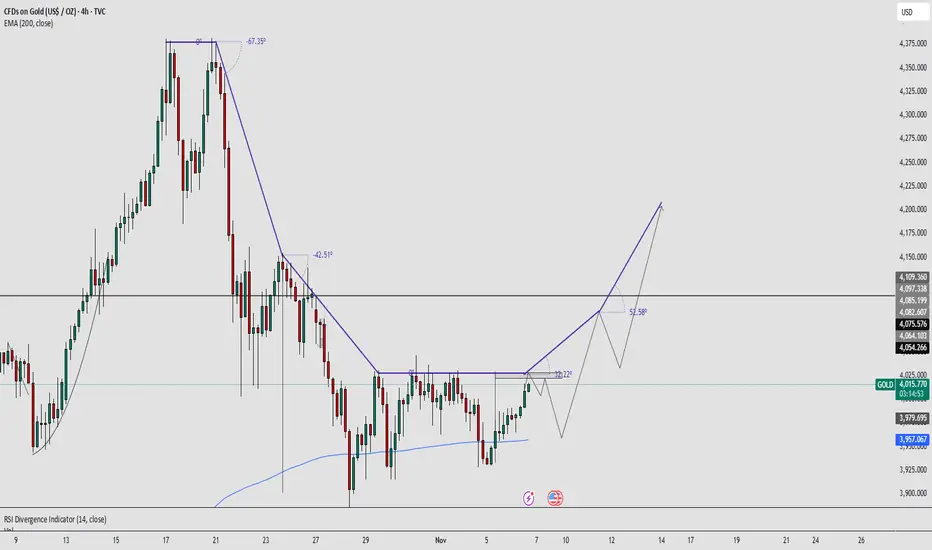
Elliott Wave Analysis XAUUSD – November 6, 2025🔹 Momentum
D1 timeframe:
The D1 momentum is now closing in, signaling a possible transition phase with two potential outcomes:
• If today’s D1 candle closes bullish (green): momentum is likely to reverse upward, suggesting a short-term bullish correction.
• If today’s candle closes bearish (red): the downtrend may continue.
The current momentum behavior is unusual, reflecting market indecision between buyers and sellers after a strong decline. As a result, even a small impulse from either side could cause a quick momentum shift.
H4 timeframe:
Momentum on H4 is still in a downward phase but already showing early signs of closing and potential bullish reversal.
• If the current H4 candle closes bearish, the downtrend may extend.
• If it closes bullish and momentum turns upward, price could retest the 4028 zone.
H1 timeframe:
Momentum on H1 is now entering the oversold area, indicating that a reversal could occur within 1–2 more H1 candles.
If momentum turns down again from resistance, this could offer an opportunity for a short-term sell (scalp) around the nearest liquidity zone.
________________________________________
🔹 Wave Structure
D1 timeframe:
As discussed in previous plans, the current structure still forms a W–X–Y correction in yellow, representing wave (4) of the larger cycle.
• The W wave has already reached the 0.382 retracement of wave (3) yellow — which often marks the typical end zone of wave 4.
• Therefore, the following X and Y waves may take longer to complete to maintain time balance within wave (4).
Meanwhile, the X wave (purple) remains relatively shallow, having retraced only about 0.236 of wave W (purple). Combined with the still-uncertain momentum discussed above, a potential rise toward the 4149 zone remains a realistic scenario.
However, if today’s D1 candle closes bearish, price could continue lower to complete wave Y (purple).
Given the current structure favors time balance rather than depth, this Y wave may unfold sideways rather than deeply downward.
At this stage, price is compressed within a narrow range, reflecting market hesitation. It’s best to wait for major catalysts such as the Nonfarm Payrolls report, which could trigger the next decisive move.
________________________________________
H4 timeframe:
The current X wave is developing within a narrow range under the form of a contracting triangle (a–b–c–d–e).
A triangle can only be confirmed once all five internal legs are completed.
Once that happens, a breakout above or below the triangle boundaries will define the next direction.
👉 For now, observation should be prioritized over action.
________________________________________
H1 timeframe:
Wave labeling on H1 is somewhat noisy due to overlapping three-wave structures within a tightening range.
Tentatively, the labeling shows a W–X–Y correction in green, where wave X appears to be a triangle formation.
A final small drop forming wave e could complete this triangle (wave X in green). Once it’s done, a new Y wave in green may start unfolding upward.
________________________________________
🔹 Summary
At present, the market remains noisy and compressed, making it unsuitable for swing entries.
• Avoid swing positions until the structure and momentum become clearer.
• Focus only on short-term scalp setups around key liquidity zones identified earlier.
• Wait for confirmation of direction and structure before committing to larger trades.

XAUUSD – INTRADAY BULLISH SCENARIO – TARGET 4050💛 XAUUSD – INTRADAY BULLISH SCENARIO – TARGET 4050 🎯
🌤 1. Overview
Hello everyone 💬
Although the larger timeframe for gold still leans towards a bearish trend, today in the short term, I prioritise a bullish scenario.
On the M30 timeframe, the price structure is gradually increasing, indicating that short-term capital is shifting to the buying side.
Zone 3990 is a very important area – where a Break of Structure (BOS) has just appeared and is also a strong resistance that has reacted multiple times before.
Price needs to confirm breaking this zone to continue expanding the bullish trend.
💹 2. Technical Analysis (ICT Perspective)
📈 An ascending structure (BOS) has formed on M30.
🟣 Buy Zone 3977–3979 coincides with the support trendline – a beautiful confluence point for buyers.
🔹 Resistance zone 3990–4000 is the area to confirm the main direction.
💫 Higher target: Fibonacci Extension 1.618 around 4049–4050, coinciding with the psychological resistance 4050.
🎯 3. Trading Plan Reference
💖 MAIN BUY (priority)
Entry: 3977–3979 | SL: 3970
TP: 3988 – 4000 – 4022 – 4040 – 4050
💢 SHORT SELL (when price reacts strongly at resistance)
Entry: 4012–4014 | SL: 4020
TP: 4002 – 3988 – 3965
⚠️ 4. Important Notes
Price needs to confirm through zone 3990 to reinforce the bullish trend.
If it breaks below 3970, the ascending structure is temporarily invalidated.
Today, prioritise buying according to the capital flow, sell only when there is a clear signal at the resistance zone.
🌷 5. Conclusion & Interaction with LanaM2
Gold is showing positive signals 💛
Patiently wait for reactions at the Buy Zone 3977–3979, this could be the starting point for a new upward move towards 4050.
This is not investment advice, just a personal perspective according to the ICT method.
If you find it useful, please 💛 like – 💬 comment – 🔔 follow LanaM2 to update gold analysis with me every day ✨

XAUUSD – Intraday H1 Plan Range-Bound Volatility(November 5, 2025)
🌐 MARKET CONTEXT
Gold is trading within a narrow range around ₹3,963 – ₹4,015, showing indecision between safe-haven demand and short-term profit-taking pressure.
After the previous New York session, price created a new local low near ₹3,962.92, then quickly rebounded as dip buyers stepped in.
However, the ₹4,015–₹4,020 zone remains a strong supply area, limiting further upside momentum.
Bias for today: Ranging with mild bullish potential
→ Prefer buying at lower supports and taking profits quickly near the ₹4,015–₹4,020 supply zone.
If price breaks below ₹3,962, deeper downside movement toward ₹3,945 may occur.
📉 TECHNICAL ANALYSIS (SMC + LIQUIDITY STRUCTURE)
Market Structure: On the H1 timeframe, XAUUSD is consolidating between the strong demand zone ₹3,962–₹3,965 and the supply zone ₹4,015–₹4,020, forming a clear sideways range.
Liquidity Map:
Below ₹3,962 lies heavy sell-side liquidity, which Smart Money may sweep before a reversal.
Above ₹4,015–₹4,020 sits buy-side liquidity, serving as the next liquidity target if a breakout occurs.
🔑 KEY PRICE ZONES
Zone Type Price Range Description
Supply Zone ₹4,015 – ₹4,020 Short-term supply zone, likely to trigger sell reactions
Order Block ₹4,010 – ₹4,008 Quick reaction zone during London session
FVG zone ₹3,956-₹3,960 as a retest reaction area to look for confirmed Buy setups if the higher-timeframe trend remains bullish, or Sell on retest if price breaks below this zone
Deep Demand - OB ₹3,935 – ₹3,940 Deep buy zone, for liquidity sweep setups
⚙️ TRADE SETUPS
✅ BUY SCENARIO 2 – OB Reaction Entry
Entry: ₹3,935 – ₹3,934
Stoploss: ₹3,928
TP1: ₹3,970
TP2: ₹4,000
Logic: Price may sweep liquidity below the FVG and mitigate the H1 Bullish Order Block (₹3,935–₹3,944); if CHoCH/BOS confirms reversal, enter buy targeting the previous imbalance and liquidity above ₹4,000.
✅ BUY SCENARIO 2 – FVG Rebalance Entry
Entry: ₹3,955 – ₹3,954
Stoploss: ₹3,948
TP1: ₹3,985
TP2: ₹4,015
Logic: Price retraces to fill the ₹3,955–₹3,954 H1 FVG within the discount zone; if bullish CHoCH/BOS confirms a reversal, execute buy entry targeting liquidity above recent highs.
🔻 SELL SCENARIO – From Short-Term Supply Zone
Entry: ₹4,011 – ₹4,009
Stoploss: ₹4,017
TP1: ₹3,990.000
TP2: ₹3,965.000
Logic: Price reaches supply zone, forms rejection or bearish engulfing → valid short setup within range.
⚠️ SCALPING SELL – Quick Reversal Opportunity
Entry: ₹4,020 – ₹4,022
Stoploss: ₹4,028
TP: ₹4,000.000 – ₹3,985
Logic: If price spikes to ₹4,020–₹4,022 sweeping buy-side liquidity and quickly rejects → short scalp opportunity.
🧠 NOTES / SESSION PLAN
Focus on London and New York sessions when liquidity is highest.
Wait for H1 candle confirmation (wick, retest, or CHoCH) before entering any trade.
Avoid trading just because price touches the zone — confirmation is key.
Risk management: limit exposure to ≤1% per trade; maintain at least a 1:2 RR ratio.
When price approaches entry zones, use M15 timeframe to confirm structure and momentum before executing.
🏁 CONCLUSION
Within the ₹3,962.92 – ₹4,015.04 range, XAUUSD is consolidating tightly.
→ Prefer buying near ₹3,965–₹3,963 upon confirmation, or deep buys at ₹3,958–₹3,956 after liquidity sweep.
→ Conversely, if price rallies to ₹4,015–₹4,020 and shows rejection signals, short opportunities may arise.
Trade according to structure, wait for confirmations, and manage risk strictly to avoid stop-hunts.

XAU/USD – Gold Forms New Liquidity Low, Buyers Return🔍 Market Context
Gold has completed a significant liquidity sweep around the 3,929 – 3,921 USD zone, clearing out the stop-losses of weak buyers before bouncing back strongly.
The bullish candle reaction at this zone indicates strong absorption from large capital flows, opening the possibility of forming a technical recovery wave towards the supply zone (OB – FVG) above.
In the short term, the market structure temporarily shifts to a bullish bias , as long as the price holds above this Liquidity Zone.
💎 Key Technical Zones
• Liquidity Sweep Zone: 3,929 – 3,921 USD → newly swept liquidity low, acting as main support.
• FVG 1: 3,951 – 3,959 USD → first target of the recovery wave.
• FVG 2: 3,977 – 3,985 USD → unfilled price balance zone.
• Order Block: 3,995 – 4,022 USD → strong supply resistance, expected reaction upon retest.
• Resistance Zone: 4,025 – 4,045 USD → watch for candle reactions to confirm upward momentum or reversal.
🎯 Trading Scenarios
1️⃣ BUY Setup – Liquidity Sweep Retest
• Entry: 3,932 – 3,922 USD (pullback to sweep zone)
• Stop Loss: below 3,912 USD
• Take Profit:
TP1: 3,965
TP2: 3,975
TP3: 3,987
TP4: 3,995
TP5: 4,022
➡️ “Buy the discount” strategy by Smart Money: buy after liquidity sweep to catch the technical rebound.
2️⃣ SELL Reaction – OB 4,022 USD
If the price approaches the OB 3,995 – 4,022 USD zone and shows reversal signals (strong rejection, bearish engulfing candle),
→ consider opening a short-term sell (counter-trend scalp)
• Entry: 4,015 – 4,020
• SL: 4,030
• TP: 3,990 → 3,970 → 3,940
⚙️ Market Structure
• Temporary uptrend line remains intact.
• Liquidity has been swept at the old low → confirming bullish ChoCH .
• Confluence structure of FVG + OB + trendline creates favorable conditions for recovery momentum.
📈 Summary
Gold has completed the old low liquidity sweep and is in a technical recovery phase.
As long as the price stays above 3,921 USD, the short-term trend leans towards bullish retracement .
Observe price reactions at the FVG 3,975 – 3,995 USD zone to determine buyer strength.
🔥 “Liquidity fuels direction — once the weak hands are out, the real move begins.”
⏰ Timeframe: 1H
📅 Updated: 05/11/2025
✍️ Analysis by: Captain Vincent

GOLD – AWAITING CONFIRMATION AFTER TRIANGLE BREAK🌸 GOLD – AWAITING CONFIRMATION AFTER TRIANGLE BREAK, BUY OPPORTUNITY AT FVG ZONE 🌸
💬 “The market always instills fear just before it makes its strongest surge.” – that's what Kristina wants to remind us today 💖
After the recent decline, gold has broken down from the triangle pattern on the H1 frame, leading many traders to start placing sell orders following the trendline. However, Kristina still hasn't seen a confirmation signal for a long-term downtrend – instead, the market is retesting strong liquidity zones, which could create a short-term rebound point.
📊 Technical Analysis:
The FVG zone around 3956–3958 is currently acting as a potential buying area, where the price may react to form a recovery.
Place a safe stop loss below the 3950 zone, with a further target towards 4100, where the Liquidity Strong cluster is concentrated according to the H4 frame.
Conversely, if the price breaks below 3930, only then can a long-term downtrend be confirmed, and Kristina will look for a sell setup in the direction of retesting the breakout zone, with a target of 3855.
🎯 Today's Trading Scenario:
Buy around 3956–3958, SL 3950, TP 4100.
If the price breaks 3930, wait to Sell when the price retests, TP 3855.
💡 Currently, the gold market is in a “hesitant” phase between two directions. Let the price action become clearer before deciding on a position. Sometimes, patience is the best position a trader can hold. 💪
🌷 The analysis reflects Kristina's personal perspective, not an investment recommendation.
If you share the same view, feel free to leave a comment below 💬✨

Elliott Wave Analysis – XAUUSD (Nov 05, 2025)
🔹 Momentum
D1 timeframe:
Daily momentum has reversed to the downside, suggesting that the dominant trend for the next 4–5 days is likely to be bearish.
H4 timeframe:
H4 momentum is currently turning upward, indicating a potential short-term bullish correction lasting 4–5 H4 candles.
However, since price action is within a corrective wave, short-term momentum signals can be noisy. Still, this minor rally can provide valuable observation opportunities.
H1 timeframe:
H1 momentum is now in the overbought zone and about to turn down.
I usually take entries when H1 and H4 momentum align, but right now they are out of phase, so the best move is to wait and observe.
The 3891 level will be a key area to monitor in the short term.
________________________________________
🔹 Wave Structure
D1 timeframe:
The corrective wave X (purple) within wave (4) (yellow) appears to be forming or nearing completion.
The downside reversal on D1 suggests that wave X might have already ended, and price could now be starting wave Y downward.
A break below 3892 would confirm that wave X is complete.
However, note that this X-wave retracement is quite shallow (around 0.283 of the previous W-wave), which reduces the reliability of the momentum signal — meaning we must stay cautious and monitor closely.
________________________________________
H4 timeframe:
On H4, the structure of wave X (purple) shows signs of a contracting triangle, anchored around the 4028 resistance zone with higher lows.
In this scenario, an a–b–c correction is expected, where wave b forms the triangle, and wave c could rise toward 4050–4149 to complete the X-wave.
However, the strong drop yesterday is weakening this scenario, though not invalidated yet.
→ The bullish scenario would be fully invalidated if price breaks below 3892.
Thus, we must monitor two possible cases:
1. Case 1:
Wave X is still in progress – supported by the current H4 momentum upswing.
If price breaks above 4028 when H4 momentum reaches overbought, it will strengthen this view.
2. Case 2:
Wave X has already completed as a triangle (abcde) shown on H1.
In this case, the ongoing H4 rally is just a corrective bounce, and once H4 momentum enters overbought and price fails to close above 4028, a new bearish leg is likely to start.
________________________________________
H1 timeframe:
The corrective X-wave (purple) seems to have completed as a triangle (abcde, black).
That means the market is now likely in wave Y (purple) on D1, where the main trend is bearish, and any upmove is only corrective.
Hence, the 3981 liquidity zone above is considered a high-probability sell area.
________________________________________
🔹 Trading Plan
• Sell Zone: 3981 – 3983
• Stop Loss: 4002
• Take Profit 1: 3892
• Take Profit 2: 3814
⚠️ Note:
Current volatility is extremely high — each H1 candle covers more than 200 pips.
Therefore, the stop loss range is wide.
👉 To manage risk effectively:
• Either avoid trading during this phase, or
• Reduce position size to keep account safety intact.

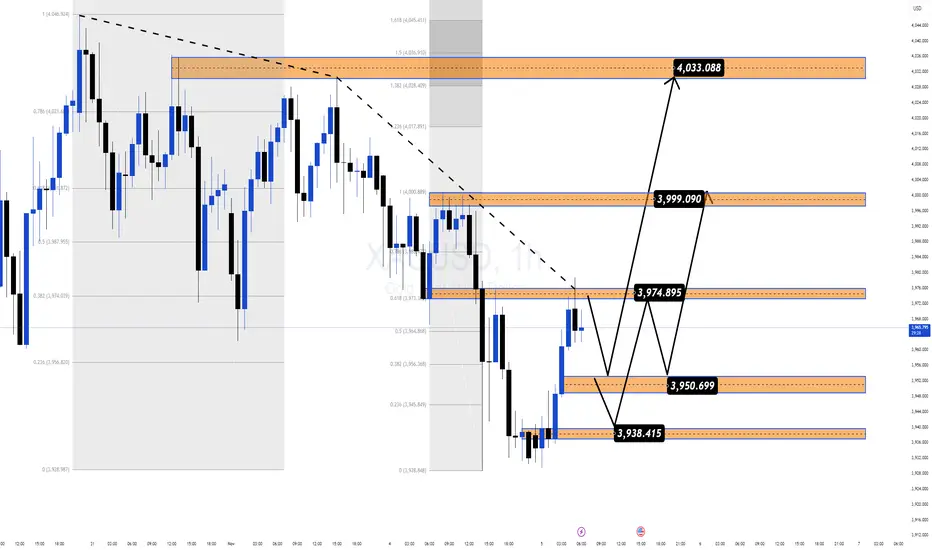
Gold Rebuilds Structure Above $3940, Eyeing $4030 Liquidity Pool🔍 Market Context
Gold is attempting to regain bullish momentum as safe-haven demand remains supported by rising geopolitical tensions and uncertainty around the upcoming US ADP employment data.
The market continues to oscillate between risk aversion and rate expectations — with the Fed’s hawkish tone keeping the Dollar capped but steady.
At the same time, capital flow rotation from equities into defensive assets is quietly supporting the metal’s structural recovery, with gold holding above key liquidity levels despite intraday volatility.
📊 Technical Analysis (H1–H4)
After forming a double-bottom structure near $3,938, XAU/USD has reclaimed the 38.2% retracement zone (3,974–3,975) from its previous bearish leg.
This area now acts as a pivot zone, separating short-term bullish continuation from potential retracement.
The chart reveals a classic liquidity cycle shift:
Phase 1: Sweep of downside liquidity below 3,930, marking an internal structural low.
Phase 2: Expansion leg reclaiming short-term FVGs, signaling a potential smart money accumulation phase.
Phase 3: Repricing toward upper liquidity targets aligned with Fibonacci extensions.
Key Technical Zones:
• 💎 Liquidity Base: 3,938 – 3,950 (recent demand re-entry area)
• 🎯 Rejection Zone 1: 3,974 – 3,999 (previous inefficiency block)
• ⚙️ Target Zone: 4,033 – 4,045 (1.272–1.618 Fibo extensions, liquidity pool)
• ⚠️ Invalidation: Break below 3,920 would shift structure back to distribution.
🎯 MMFLOW Scenario
If gold sustains above the 3,950 support cluster, buyers are likely to extend the retracement toward 3,999–4,033 where resting liquidity sits.
A clean rejection from 4,000 could trigger an intraday pullback — but as long as price holds above the 3,938 OB base, the bullish recovery structure remains intact.
The short-term narrative favors controlled accumulation, suggesting that smart money is building positions into liquidity zones before the next impulsive move.
⚜️ MMFLOW Insight:
“Liquidity isn’t random — it’s engineered. Every move leaves a footprint, and gold is tracing its next one above $3,950.”
XAUUSD – PRIORITISE BUYING, TARGET 4040XAUUSD – PRIORITISE BUYING, TARGET 4040 🎯
🌤 1. Overview
Hello everyone 💬
My perspective on gold today remains to prioritise buying, as there hasn't been a clear deep decline.
The price is currently consolidating in a narrow range, needing more time to build momentum before breaking out.
I will wait to buy back at the OB area – where there is high liquidity, this is a region likely to see strong price reactions.
The best scenario today: the price may sell lightly at FVG, then drop to OB to trigger the buy setup.
💹 2. Technical Analysis (ICT Perspective)
💜 Price Structure: Gold still maintains a short-term uptrend, the main trend hasn't been broken.
💎 Liquidity: Liquidity is concentrated below the 3940 area – potential buying OB.
💫 FVG: The 3975–3980 area is where a slight decline reaction may occur.
⚙️ Order Block (OB): 3938–3945 is a crucial support area, with potential for a strong price rebound from here.
📈 Main Target: 4040 – high liquidity area, coinciding with the large frame FVG.
🎯 3. Reference Trading Scenario
💢 Short SELL (scalping)
Entry: 3980 | SL: 3988
TP: 3972 – 3960 – 3940
💖 Main BUY (priority)
Entry: 3940 | SL: 3932
TP: 3952 – 3968 – 3990 – 4012 – 4035
✨ 4. Important Notes
🔹 Observe price reactions at FVG and OB before taking action.
🔹 If the price exceeds 3988, the decline scenario is temporarily invalidated.
🔹 The main direction remains to buy following the Smart Money trend – only look for short sells with confirmation.
🌷 5. Conclusion & Interaction with LanaM2
Gold is still on the right track of the Smart Money Flow,
patiently wait for the price to reach a favourable area to act 💪
This is not investment advice, just a personal perspective based on the ICT method.
If you find it useful, please 💛 like – 💬 comment – 🔔 follow LanaM2
to stay updated with the latest gold insights every day.

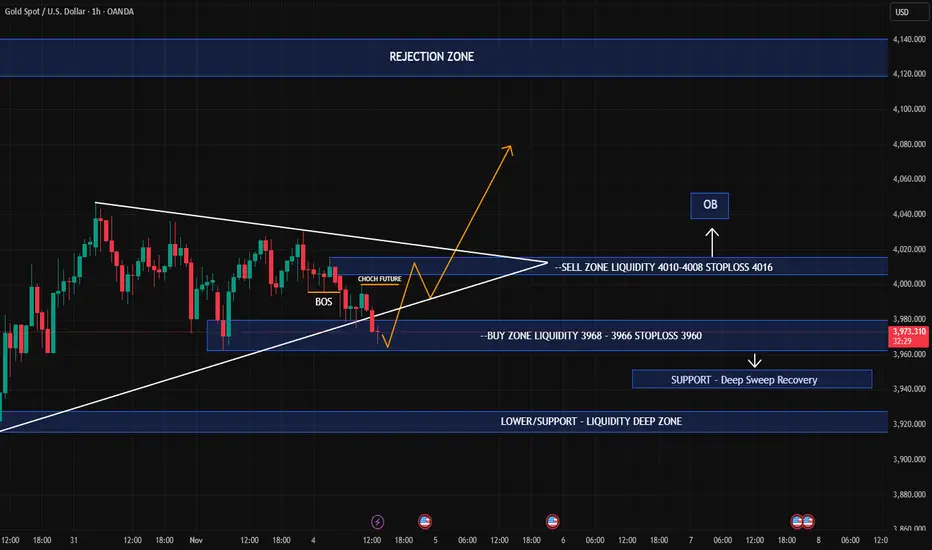
XAUUSD – Intraday H1 Plan: Liquidity Sweep or Reversal Base?Date: November 4, 2025
Timeframe: H1
🌐 MARKET CONTEXT
Gold is consolidating between $3,976 and $4,006 after a volatile session yesterday.
Market sentiment remains mixed, as traders weigh the rebound in U.S. Treasury yields against ongoing geopolitical and inflation concerns.
Recent move: Gold rebounded from the $3,975 low after a minor liquidity sweep below last week’s range.
Sentiment: Neutral-to-bullish in the short term — safe-haven demand still provides a soft floor.
Sessions to watch:
London session: Expect retracement and liquidity grab below intraday lows.
New York session: Possible expansion to the upside if $4,000 zone holds as support.
Macro Bias: Mildly bullish if price maintains structure above $3,980–$3,985; potential liquidity sweep downside before reversal.
📉 TECHNICAL ANALYSIS (SMC + LIQUIDITY STRUCTURE)
Market Structure:
H1 is forming a short-term accumulation range with liquidity resting below $3,976 (SSL) and above $4,006 (BSL).
A break and close above $4,005.5 may trigger a short-term BOS → potential push toward $4,015–$4,020.
Key SMC Confluences:
$4,200–4,230 Extended Resistance – higher untested supply if momentum returns.
Demand Zone: $3,978–$3,980 → aligned with FVG + previous sweep low.
Supply Zone: $4,004–$4,006 → previous OB + high liquidity.
🔑 KEY PRICE ZONES
Price Zone Type Explanation
4,006–4,004 🔴 Supply Previous high + BSL liquidity
3,996–3,994 🟡 Resistance Equilibrium rejection zone
3,986–3,984 🟢 Demand OB + CHoCH base support
3,980–3,978 🟢 Strong Demand SSL sweep + FVG confluence
3,976–3,974 ⚠️ Liquidity Sweep Deep liquidity / stop-hunt zone
⚙️ TRADE SETUPS
✅ BUY SCENARIO 1– Deep Sweep Recovery
Entry: 3,968–3,966
Stoploss: 3,960
TP1: 3,988
TP2: 3,996
TP3: 4,004
Logic: SSL sweep below the range + FVG mitigation → bullish reaction expected during London open.
🚫 SELL SCENARIO – Supply Rejection
Entry: 4,010–4,008
Stoploss: 4,016
TP1: 3,994
TP2: 3,986
TP3: 3,980
Logic: Price sweeps the previous BSL liquidity above $4,006 → look for bearish CHoCH + confirmation candle M5 before entry.
⚠️ SCALPING SELL – Aggressive Short
Entry: 4,008–4,009
Stoploss: 4,012
TP: 3,998 – 3,990 – Open
Logic: High-risk scalp at liquidity spike above day’s high; confirm rejection with volume drop.
🧠 NOTES / SESSION PLAN
Prioritize long setups near $3,980–3,984 zone during London open.
Look for liquidity sweep before entering — avoid premature entries.
During NY session, re-evaluate if gold re-tests the $4,004–$4,006 supply zone.
Avoid overtrading; use smaller position sizing due to narrow range ($30).
Always wait for H1 close confirmation before committing.
🏁 CONCLUSION
Gold remains range-bound within $3,976–$4,006, but the structure hints at a potential bullish bias if liquidity below $3,978 is swept first.
The preferred buy zones are $3,984–$3,986 and $3,978–$3,980, while sell reactions may occur near $4,004–$4,006.
Expect whipsaw volatility between London and NY overlap; trade only with clear SMC confirmations and proper risk control.
Accumulated Gold on Support, 3,952 USD is the Gateway for a New 🔍 Market Context
Gold is oscillating within a symmetrical triangle pattern , reflecting price compression and waiting for a breakout signal.
Buyers still maintain a short-term bullish structure, but the series of lower highs indicates increasing selling pressure.
The zone 3,959–3,964 USD is currently the “balance point” — if this area is breached, the downtrend may extend to the lower liquidity zone around 3,929–3,921 USD .
💎 Key Technical Zones
• Resistance Zone: 4,020 – 4,040 USD → the main resistance of the triangle, where strong reactions are likely.
• Support Zone: 3,959 – 3,964 USD → the support zone maintaining the bullish structure.
• Liquidity Zone: 3,929 – 3,921 USD → a low liquidity zone, potentially attracting price sweeps before reversing.
🎯 Trading Scenarios
1️⃣ BUY Setup – Preferred when price holds above support
• Entry: 3,959 – 3,964 USD
• Stop Loss: 3,940 USD
• Take Profit:
– TP1: 3,985
– TP2: 4,020
– TP3: 4,040
– TP4: 4,096
✳️ “Buy the discount” – Buy at the trendline support zone when a confirmation signal appears (rejection or bullish ChoCH).
2️⃣ SELL Setup – Scenario if support breaks
• Entry: 3,950 – 3,955 USD (after closing a candle below the support zone)
• Stop Loss: 3,970 USD
• Take Profit:
– TP1: 3,935
– TP2: 3,925
– TP3: 3,912
✳️ “Sell the breakdown” – Sell when support is clearly breached, targeting the lowest liquidity zone (3,912 USD).
💬 Summary
Gold is in a phase of accumulation before a major move .
If it holds above 3,952 USD → prioritize BUY according to the bullish structure .
If it breaks below 3,952 USD → SELL according to the breakout towards the Liquidity Zone.
The scenario will be clearly confirmed when the current symmetrical triangle is broken.
💡 Today's Tagline:
“Liquidity defines direction — follow where the money hides.”
⏰ Timeframe: 1H
📅 Update: 04/11/2025
✍️ Analysis by: Captain Vincent

technical analysis of the chart you shared (U.S. Dollar IndexCurrent Price: 100.112
Bias: Bullish short-term
Timeframe: 15-min
The chart shows a clear bullish structure with higher highs and higher lows forming. The price recently bounced from a minor support zone around the 100.00 level and is showing momentum to the upside.
📊 Key Levels
Support Level: 99.750 – 99.850 (major zone from previous lows)
Buy Zone: 100.000 – 100.050 (minor support/entry zone)
Target Point: 100.460
⚙️ Analysis Summary
Price has broken above short-term resistance and is now retesting the buy zone, suggesting a possible continuation higher.
The ascending trendline (dotted white line) supports this bullish bias.
The yellow zigzag projection indicates expected consolidation before a push upward.
🎯 Trading Plan (Based on Chart Setup)
Entry Zone: Around 100.000 – 100.050
Stop Loss: Below 99.900 (below structure support) EURONEXT:AEX TVC:AEX INDEX:AMX EURONEXT:A12LE EURONEXT:AAX EURONEXT:AAXG EURONEXT:AE10S EURONEXT:AE12S EURONEXT:AESGG EURONEXT:AESGN EURONEXT:AESGP EURONEXT:AEX4S EURONEXT:AEX6L EURONEXT:AMXGR EURONEXT:AEXGR TVC:AEX
Take Profit: 100.460 (target zone)
Risk/Reward Ratio: Approximately 1:3
🔍 Conclusion
The chart suggests a short-term bullish scenario for DXY (U.S. Dollar Index). A successful bounce from the 100.00 zone could lead to a move toward the 100.46 target point. However, a break below 99.90 would invalidate the setup and shift bias to neutral or bearish.

Gold Faces Strong Rejection at Supply Zone – Bearish ContinuatioThe chart shows Gold testing a strong supply zone around 4000–4025. Price attempted to push higher but failed, forming a clear rejection wick followed by consolidation.
Key observations:
Supply Zone (Resistance): 4000–4025 area has repeatedly rejected price, showing strong seller presence.
Structure: Market is forming lower highs, indicating weakening bullish momentum.
Break & Retest: Price pulled back to the broken structure level and is now reacting bearishly.
Projected Move: The arrow suggests a potential drop toward the 3900–3910 demand zone.
Momentum: Candlestick rhythm supports a bearish continuation scenario as long as price stays below 4000.
✅ Bearish Bias
If the rejection holds:
Downside target: 3900–3910
Invalidate bearish idea: A 4H close above 4025

XAU/USD: Powell vs. The Discount ZoneHello, Traders! Let's dive deep into Gold (XAU/USD). The price is currently caught in a crucial tug-of-war: a hawkish US Federal Reserve (Fed) is strengthening the Dollar, while the political risk of a potential US government shutdown offers strong support to Gold. This is where the opportunity lies!
📰 Key Fundamental Drivers (Watch Closely):
The Fed & Powell's Stance: The likelihood of a US rate cut in December has decreased significantly. This signals a Hawkish view, which generally makes the USD stronger and places DOWNWARD pressure on Gold prices.
US Government Shutdown Risk: Concerns are rising that a prolonged government closure could harm the US economy. This economic uncertainty acts as a strong tailwind for Gold, as it is a premier safe-haven asset.
📉 Technical Analysis (The Chart View):
We observe XAU/USD moving within a Rising Wedge pattern (often a signal for a bearish reversal) and is now heading towards a critical price level we call the Strategic Support Zone.
🔥 Strategic Support Zone (The Discount Zone): $3,941 - $3,953. This is the key zone where patient buyers typically look to enter Buy (Long) trades, ensuring a favourable risk/reward profile.
Major Resistance Zone: $4,004 - $4,025.
🎯 Our Two-Sided Trading Strategy:
1. The Bullish Scenario (Long):
Action: Wait for the price to test and show a strong reversal signal (like a rejection candlestick) from the $3,941 - $3,953 support area.
Target: $4,004 - $4,025.
2. The Bearish Scenario (Short):
Action: SELL (SHORT) if the price is strongly rejected at the $4,004 - $4,025 resistance zone, OR if it decisively breaks and closes below $3,941.
Target: Below $3,900.
🚨 Important Note: We must closely monitor any further statements from FOMC members this week. They will dictate the short-term direction. Trade wisely and always use a Stop Loss!
#xauusd #forexindia #powell #fomc #technicalanalysis #gold #usd #indiaforex #tradingview #marketanalysis

GOLD – TRIANGLE COMPRESSION ON H4 ✨ GOLD – TRIANGLE COMPRESSION ON H4, AWAITING A STRONG BREAKOUT IN WAVE 5 ✨
💬 Gold is accumulating in a compression triangle – when silence lasts too long, the market is about to speak.
Hi everyone 💖, Kristina is back with today's perspective on gold. I hope this analysis will help you – whether you're a new trader or have been trading gold for years – gain a clearer view to prepare for the upcoming breakout.
📉 Technical Analysis:
Currently, gold is moving within a triangle pattern on the H4 frame, indicating that market energy is being compressed. When the price breaks out of this area, the movement range could reach several tens of points.
Important support zone: 3960–3980
Strong resistance zone: 4035–4045
👉 When the price breaks one of these zones, the trend will be clearly confirmed.
According to Elliott Wave, Kristina is observing two scenarios:
1️⃣ Long-term: Wave (5) could be a downward wave, heading towards 3820.
2️⃣ Medium-term: Wave (5) can still rise if the price holds the 4000 zone, targeting around 4110–4130.
💎 Trading zone according to ICT:
Order Block around 4040 is a potential supply zone – a reversal signal is likely to appear.
The area around 4000 is a notable support point – it can create a bounce reaction if the price retests.
🎯 Reference trading scenarios:
Sell around 4040 when there is a reversal signal, SL 10 points, TP 4020–4000.
Buy around 4000 after the price retests the OB, SL 10 points, TP 4110.
If the price breaks 3970, wait to Sell around 3980, SL 10 points, TP 3820.
🕊️ Currently, gold is in a waiting phase – observe, don't rush, to act with the trend when the market "speaks."
🌷 The analysis reflects Kristina's personal perspective, not an investment recommendation.
If you share the same viewpoint or have a different perspective, please leave a comment below 💬💕

Gold Range Compression — Breakout Imminent🟥 Resistance Zone (Key Supply Zone): 4028 – 4045
Price has tested this zone multiple times but failed to break through.
A clean break above this red zone will signal strong bullish continuation.
🟦 Support Zone (Key Demand Zone): 3995 – 4005
This is the immediate support keeping price from falling lower.
A break below this blue zone will confirm bearish momentum.
✅ Bullish Scenario
If price breaks and retests the red zone (4028–4045):
Expect upward continuation
Target 1: 4060
Target 2: 4095 – 4105
This matches the upward blue arrows on your chart.
✅ Bearish Scenario
If price breaks below 3995 and retests the blue zone as resistance:
Expect strong downward momentum
Target 1: 3960
Target 2: 3925
This matches the downward blue arrows shown.
✅ Current Bias
Market is neutral right now — sitting between support and resistance.
A breakout from either zone will decide the next direction.
