GOLD SHOWING A GOOD UP MOVE WITH 1:10 RISK REWARD GOLD SHOWING A GOOD UP MOVE WITH 1:10 RISK REWARD
DUE TO THESE REASON
A. its following a rectangle pattern that stocked the market
which preventing the market to move any one direction now it trying to break the strong resistant lable
B. after the break of this rectangle it will boost the market potential for break
C. also its resisting from a strong neckline the neckline also got weeker ald the price is ready to break in the outer region
all of these reason are indicating the same thing its ready for breakout BREAKOUT trading are follws good risk reward
please dont use more than one percentage of your capitalfollow risk reward and tradeing rules
that will help you to to become a bettertrader
thank you
Xauusdanalysis

Gold Breaking Limits – Trend Speaks for ItselfGold Breaking Limits – Trend Speaks for Itself
Gold Market Outlook
Gold continues to demonstrate a well-structured bullish cycle, characterized by steady momentum and clean trend development. The market has transitioned from a prolonged consolidation phase into a sustained directional move, where each breakout is validated by controlled retracements. This reflects strong participation and confidence from larger players.
The sequence of market shifts and break-of-structure signals highlight how short-term pullbacks are consistently absorbed, turning into fuel for further expansion. Price action is orderly, with no signs of erratic volatility, showing that buyers remain in control and liquidity is being managed efficiently.
Overall, gold is moving in line with the broader macro sentiment. The rhythm of accumulation, expansion, and continuation suggests that the current cycle has not yet exhausted its potential. While interim pauses are expected, the structural integrity of the trend continues to favor upside development over the medium term.

Gold’s Next Bullish Move: Key Buy Zones & Targets to Watch Today🔥 Gold (XAUUSD) Bullish Momentum Alert! 🔥
After a strong rally, Gold bounced back impressively from today’s low at 3633 and is pushing up towards 3673. For intraday traders, the setup is clear: look for dips to jump in on the long side around 3654 - 3646 with exciting upside targets ahead!
📈 Trade Setup – Long on Pullback
Entry: Buy Gold at 3654
Add-on Dip: Add more at 3646
Targets: First target 3670-3675, then aiming for 3685
Invalidation: Cut losses if price falls below 3630
📊 Risk/Reward Snapshot
This is a tight-risk, high-reward setup — perfect for traders who want to keep their stops close while chasing solid gains. As always, manage your risk wisely and size your positions according to your plan.
Do you see the same bullish opportunity?
👍 Drop a like if you’re in!
💬 Share your thoughts or questions below — let’s build a sharp, winning community together!
Your feedback fuels us and keeps everyone trading smarter. Let’s make those pips! 🚀
Happy Trading,
– The InvestPro Team

Gold 1H – Retail Sales Impact Before FedOn the 1H chart, Gold is holding near 3,682 after showing a clear Break of Structure. Liquidity is now seen both above the premium resistance at 3,700 and below the Fair Value Gap demand around 3,669–3,667. With U.S. Retail Sales data due at 19:30 IST today, intraday volatility is expected, but overall positioning is still cautious ahead of the Federal Reserve’s interest rate decision later this week. Traders can look for liquidity sweeps towards premium levels before retracements into demand zones.
________________________________________
📌 Key Structure & Liquidity Zones (1H):
• 🔴 SELL ZONE 3,700 – 3,698 (SL 3,707): Premium resistance likely to trigger rejection towards 3,690 → 3,680 → 3,670.
• 🟢 FVG BUY ZONE 3,669 – 3,667 (SL 3,660): Fair Value Gap demand zone for retracements, targeting 3,680 → 3,690 → 3,700+.
• 🟢 BUY SUPPORT 3,641 – 3,639 (SL 3,632): Deep discount support, targeting 3,655 → 3,670 → 3,685+.
________________________________________
📊 Trading Ideas (Scenario-Based):
🔺 Buy Setup – FVG Reclaim (3,669–3,667)
• Entry: 3,669 – 3,667
• Stop Loss: 3,660
• Targets:
TP1: 3,680
TP2: 3,690
TP3: 3,700+
👉 Look for a liquidity sweep into the FVG zone before New York session begins.
🔺 Buy Setup – Discount Sweep (3,641–3,639)
• Entry: 3,641 – 3,639
• Stop Loss: 3,632
• Targets:
TP1: 3,655
TP2: 3,670
TP3: 3,685+
👉 A good risk-to-reward opportunity if price sweeps stops below structure before Retail Sales release.
🔻 Sell Setup – Premium Liquidity Run (3,700–3,698)
• Entry: 3,700 – 3,698
• Stop Loss: 3,707
• Targets:
TP1: 3,690
TP2: 3,680
TP3: 3,670
👉 Expect engineered stop-runs into premium supply before fading lower.
________________________________________
🔑 Strategy Note
While Retail Sales data may bring short-term price swings, market attention is focused on the Fed. Smart Money is likely to trap both sides of liquidity: fading premium near 3,700–3,698 while accumulating buys at 3,669–3,667 and 3,641–3,639. Trade with smaller positions and confirm with H1 closes before entries.

“XAU/USD 1H – Bullish Continuation from Demand Zone Key Observations:
Uptrend Structure:
Price has been consistently making Higher Highs (HH) and Higher Lows (HL), confirming an overall bullish market structure.
Break of Structure (BOS) levels confirm continuation of the trend.
Market Structure Shift (MSS):
Recently, price created a short-term shift downward (MSS) but retraced into a POI zone (demand area) near 3,646 – 3,659.
Current Setup:
The price bounced from the POI zone and is now recovering upward.
A long position was marked with entry near 3,659, Stop Loss at 3,646, and Target around 3,709.
Bias:
As long as price holds above 3,646 (POI zone), bullish continuation is favored.
If broken below 3,646, bearish correction could extend further.

Gold's U-Turn: A Dive into Fundamentals & Trading StrategyHello, fellow traders! The gold market's moves last night were absolutely wild, not at all what one would expect. After hitting a new all-time high of $3,707.40/oz, gold surprisingly took a U-turn and dropped to $3,681.39/oz. And this happened right after the Fed cut rates by 0.25% as predicted! So, what exactly went down?
Fundamental Analysis: The Fed's Move and Powell's "Cool" Comments
Rate Cut as Expected: The Fed delivered the 0.25% rate cut, its first this year after a pause since late 2024. This action, along with the forecast for two more cuts, met market expectations and initially sent gold soaring.
USD and Bond Yields Drop: Lower interest rates tend to weaken the USD and pull down bond yields, making non-yielding assets like gold more attractive. This was the initial push for gold's new peak.
Powell's "Hawkish" Spin: Everything changed when Fed Chair Jerome Powell stepped up. He gave some surprisingly "hawkish" statements, suggesting the Fed isn't in a hurry to cut rates and that this move was just "risk management."
The Aftermath: This statement threw cold water on market expectations for a faster, more aggressive rate-cutting path. Powell was quite clever; he met market expectations and diffused political pressure (especially from the Trump administration), all while keeping investors on their toes. As a result, bond yields and the USD bounced back, putting strong selling pressure on gold.
Outlook: This shock might just be temporary. Fundamentally, the Fed starting a loosening cycle is a big long-term positive for gold. While gold might face some headwinds in the short term, the underlying bullish trend is still very much intact.
Technical Analysis: Volatility and Key Levels
Gold had some unpredictable swings after the news. After dropping to the $363x zone, it bounced back super fast. This shows that there's still solid buying power at these key support levels.
Key Support: $3624, $3612, $3600, $3584, $3569
Resistance: $3667, $3675, $3686, $3700
Today's Key Level: The $364x range. If gold holds above this level by the end of the European session, we should look for long positions for the US session.
Trading Setups (Remember to Manage Risk Strictly):
Buy Scalp
Zone: $3639 - $3637
SL: $3633
TP: $3642 - $3647 - $3652 - $3657 - $3667
Buy Zone
Zone: $3606 - $3604
SL: $3596
TP: $3614 - $3624 - $3634 - $3644 - $3664
Sell Scalp
Zone: $3674 - $3676
SL: $3680
TP: $3671 - $3665 - $3660 - $3655 - $3645
Sell Zone
Zone: $3686 - $3688
SL: $3696
TP: $3678 - $3668 - $3658 - $3648 - $3628
Note: The market is highly volatile. Be careful with every trade. Will gold continue its rally or see a deeper correction? Share your thoughts below! 👇
#Gold #XAUUSD #Fed #GoldAnalysis #TradingView #InterestRates #FinancialMarkets #TechnicalAnalysis #GoldTrading #Powell #CMEFedWatch
XAUUSD – Medium-Term Outlook After Fed Rate CutXAUUSD – Medium-Term Outlook After Fed Rate Cut
Hello fellow traders,
The most anticipated event of September is now clear: the Federal Reserve has cut interest rates by 25 basis points, the first reduction this year. Market expectations also indicate the possibility of another 50 basis points cut in the upcoming meeting. In his speech, Chairman Powell highlighted the “dual risk” – inflation could rise further while employment shows signs of weakness.
Technical View
Gold has formed an H1 candle closing below the rising price channel, signalling a possible violation of the medium-term uptrend.
The buying side failed to maintain momentum after the rate cut news, showing caution in entering at elevated price levels.
Medium-term investors may consider waiting for a lower price to enter fresh longs.
However, the downside is not fully confirmed, as price is still hovering around the ascending trendline → selling directly at current levels still carries certain risks.
Trading Scenarios
Sell Strategy
Scalping: 3676 – 3678 | SL: 3683 | TP: 3666 – 3650 – 3635 – 3628
(Stop loss can be moved to breakeven if price reacts well, to hold positions longer).
Sell Zone: 3697 – 3700 | SL: 3705 | TP: 3680 – 3666 – 3650 – 3635 – 3628
Buy Strategy
Scalping: 3634 – 3636 | SL: 3629 | TP: 3645 – 3660 – 3672
Buy Zone: 3600 – 3598 | SL: 3590 | TP: 3633 – 3645 – 3660 – 3675 (extended)
Conclusion
Gold is currently in a sensitive phase after the Fed’s decision to cut rates. Traders must watch price action carefully around major support and resistance levels to confirm a clearer direction.
Stay tuned to this outlook — I will continue to provide updates as the market structure evolves. Follow along to receive the fastest scenario changes as price action develops.

Gold 1H – Dollar Strength Weighs Ahead of US DataGold on the 1H chart is testing deeper demand zones near 3,612–3,614 after repeated liquidity sweeps into 3,678 and 3,702. Sellers continue to defend premium supply zones, with engineered stop-runs fading quickly. Today’s US data releases and renewed dollar strength keep gold vulnerable to further downside unless discount demand zones show strong defence.
________________________________________
📌 Key Structure & Liquidity Zones (1H):
• 🔴 SELL SCALP 3,678 – 3,680 (SL 3,685)
Premium intraday pocket for rejection targeting 3,675 → 3,670 → 3,665.
• 🔴 SELL ZONE 3,704 – 3,702 (SL 3,711)
Major premium supply trap for engineered sweep before continuation lower toward 3,670 → 3,655 → 3,640.
• 🟢 BUY GOLD SUPPORT 3,616 – 3,618 (SL 3,610)
Fresh deep discount demand zone, targeting recovery into 3,630 → 3,645 → 3,655+ if defended.
________________________________________
📊 Trading Ideas (Scenario-Based):
🔻 Sell Setup – Intraday Premium Rejection (3,678–3,680)
• Entry: 3,678 – 3,680
• Stop Loss: 3,685
• Take Profits:
TP1: 3,675
TP2: 3,670
TP3: 3,665
👉 Expect engineered liquidity grab into premium before NY session.
🔻 Sell Setup – Higher Premium Trap (3,704–3,702)
• Entry: 3,704 – 3,702
• Stop Loss: 3,711
• Take Profits:
TP1: 3,670
TP2: 3,655
TP3: 3,640
👉 Smart money may sweep highs near 3,704 before extending bearish leg.
🔺 Buy Setup – Discount Reversal (3,616–3,618)
• Entry: 3,616 – 3,618
• Stop Loss: 3,610
• Take Profits:
TP1: 3,630
TP2: 3,645
TP3: 3,655+
👉 Strong bounce potential if dollar retraces post-data; favourable risk/reward from deep demand.
________________________________________
🔑 Strategy Note
With US data and dollar strength in focus, gold remains heavy below 3,678–3,704. Favour short setups into premium sweeps, but monitor 3,612–3,614 closely for signs of accumulation. Trade lighter size until direction clarifies post-news.

LiamTrading – XAUUSD: A New Trend EmergingHello traders, gold has just formed a new structure as it began a sharp correction following Chairman Powell’s announcement of a Fed rate cut. On the H1 chart, a clear bearish Dow structure is developing, indicating potential medium-term sustainability.
Most buy-side liquidity has already been cleared, which makes the chances of a strong recovery quite low – except for a brief FVG right after the news. However, given overall market sentiment, trading activity in that phase was not significant. The gap formation signals that sellers are now confident in taking control after the Fed’s statement.
The current decline could push gold towards the 363x region, and possibly as far as 361x. A key confirmation level remains at the strong support of 3651, where price previously bounced more than 20 dollars immediately after the news.
Trading plan for today:
Sell 3656 – 3659, SL 3666, TP 3651 – 3646 – 3638 – 3634 – 3626 – 3615
Buy 3634 – 3632, SL 3628, TP 3640 – 3652 – 3660
Buy zone 3607 – 3604, SL 3600, TP 3616 – 3625 – 3638 – 3647 – 3660
This is my personal outlook on XAUUSD for today – use it as a reference for your own trading decisions. If you find this analysis helpful, do follow me for more gold trading scenarios and daily insights.

Gold 1H – Fed Decision Looms After $3,700 BreakOn the 1H timeframe, Gold is consolidating around 3,675 after sweeping through the key $3,700 level. Price briefly touched 3,702 before retreating back into the 3,670s, showing engineered liquidity runs on both sides. With the Fed policy decision expected at 1 AM VN time, volatility is likely to spike. The market remains supported by easing USD, central bank flows, and geopolitical tensions, but short-term positioning indicates possible liquidity grabs before a clear directional move.
________________________________________
📌 Key Structure & Liquidity Zones (1H)
• 🔴 SELL SCALP 3,696 – 3,694 (SL 3,703)
Premium supply pocket for engineered rejection targeting 3,690 → 3,685 → 3,680.
• 🟢 FVG BUY ZONE 3,674 – 3,665 (SL 3,660)
Fair Value Gap demand zone for retracement into structure, targeting 3,685 → 3,695 → 3,700+.
• 🟢 BUY SUPPORT 3,636 – 3,638 (SL 3,630)
Deep discount accumulation zone targeting 3,655 → 3,670 → 3,680+.
________________________________________
📊 Trading Ideas (Scenario-Based)
🔺 Buy Setup – FVG Reclaim (3,674–3,665)
• Entry: 3,674 – 3,665
• Stop Loss: 3,660
• Take Profits:
o TP1: 3,685
o TP2: 3,695
o TP3: 3,700+
👉 Look for liquidity sweep into FVG before NY session/Fed.
🔺 Buy Setup – Deep Discount (3,636–3,638)
• Entry: 3,636 – 3,638
• Stop Loss: 3,630
• Take Profits:
o TP1: 3,655
o TP2: 3,670
o TP3: 3,680+
👉 High risk-to-reward setup if stops are hunted before Fed decision.
🔻 Sell Setup – Premium Trap (3,696–3,694)
• Entry: 3,696 – 3,694
• Stop Loss: 3,703
• Take Profits:
o TP1: 3,690
o TP2: 3,685
o TP3: 3,680
👉 Expect engineered stop-runs into premium before fading lower.
________________________________________
🔑 Strategy Note
Gold’s break above $3,700 highlights strong bullish sentiment, but the Fed decision risk suggests smart money may sweep liquidity both ways. Stay flexible: short from premium zone (3,696–3,694), and defend longs at demand zones (3,674–3,665 and 3,636–3,638). Use lighter position sizing until post-Fed clarity emerges.

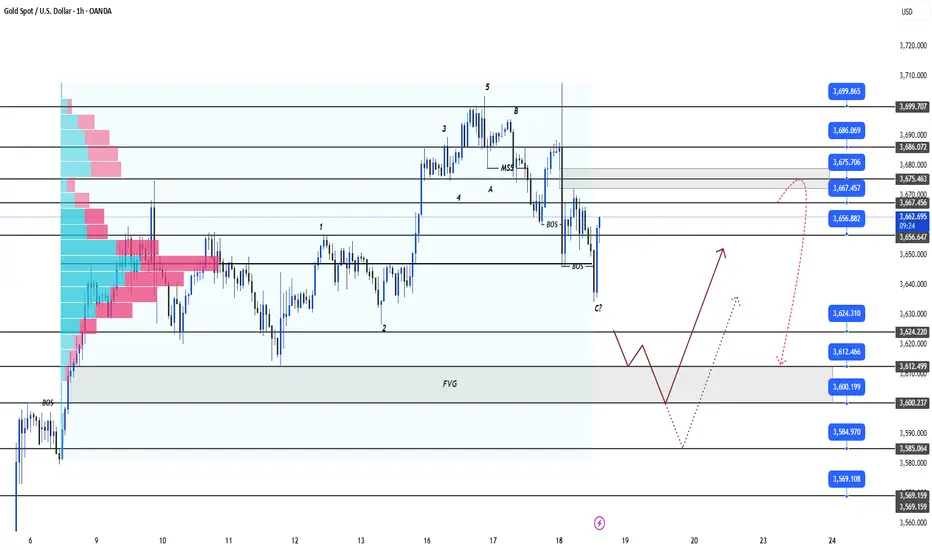
Elliott Wave Analysis XAUUSD – September 18, 2025
Momentum
• D1: Currently, D1 momentum is declining, therefore a downward move is likely to extend over the next 4–5 days.
• H4: Momentum is falling, so today we may see further downside to push momentum into the oversold zone before a potential reversal.
• H1: Momentum is still heading down, suggesting the bearish move is likely to continue.
________________________________________
Wave Structure
• D1: With momentum turning lower, it is highly probable that wave v black has completed and price has entered a corrective ABC phase. If this is the case, the correction will likely last for at least more than one week.
• H4: A 5-wave structure (1–2–3–4–5) within wave v black has been completed. The current decline could be wave A of the correction. We need to observe closely to confirm whether wave A is done. Note: during corrective phases, trading becomes more difficult; targets beyond 500 pips are rarely achieved as price tends to overlap. Toward the end of corrections, price often compresses and whipsaws both sides, so trade with smaller positions and manage risk carefully.
• H1:
o Scenario 1: Wave 1 of wave (5) black has formed, and the market is now in wave 2. This scenario is invalidated if price breaks below 3626.
o Scenario 2: Wave v black has already completed with a 5-wave structure. Price is now in a larger corrective phase (i–ii–iii–iv–v black on the D1). In this case, the correction will likely last longer than previous waves ii and iv – an important guide to prepare for an extended bearish or sideways phase.
On H1, the current drop is steep and impulsive, likely part of a 5-wave structure. The recovery was capped at the 38.2% Fibonacci retracement, which indicates:
• If this is wave 4 of the decline, price will break below 3649, with wave 5 of A projected toward 3632 → Buy zone.
• If price breaks above the minor high at the 38.2% Fibonacci level, it is more likely wave B of an ABC correction. In that case, the upside targets would be 3677 or 3694 → Sell zones.
⚠️ Note: Once price hits one target, the opposite entry setup will be canceled.
________________________________________
Trading Plan
Buy Zone:
• Entry: 3633 – 3630
• SL: 3620
• TP: 3649
Sell Zone 1:
• Entry: 3676 – 3679
• SL: 3686
• TP: 3657
Sell Zone 2:
• Entry: 3693 – 3696
• SL: 3703
• TP: 3677

LiamTrading – XAUUSD OutlookSharing my personal view on the possible next move for gold.
Based on the current chart structure, the wave formation suggests that XAUUSD is most likely in Wave 4. The correction started yesterday after price touched the 3,700 mark – a round resistance level which also coincides with the 1.618 Fibonacci extension. This area often attracts heavy liquidity, and the subsequent pullback further supports the view that Wave 4 has been activated.
At present, the key support to watch is 3,675. If this level breaks, the corrective structure could complete around 3,656. On the H1 timeframe, the RSI has moved below the 30 level, indicating oversold conditions. In my view, while the market remains in this phase, it is still preferable to look for selling opportunities, though patience is needed until clearer confluence signals appear.
Trading plan (short-term focus):
Sell entry 3685–3687, SL 3693, TP 3670 – 3656
Buy entry 3656–3654, SL 3648, TP 3675 – 3690 – 3702 – 3721 – 3740
I will continue to share further updates if there are significant moves in price. Wishing everyone successful and effective trading.

Gold (XAUUSD) FOMC Forecast – 17 Sept 2025Gold (XAUUSD) FOMC Forecast – 17 Sept 2025
Current Price: ~3666
Key Levels Identified:
Resistance R1: ~3700
Trendline Resistance R2: ~3780
Support S1: ~3623
Support S2: ~3540
📰 News Impact Projection:
If the Federal Reserve Cuts the Funds Rate
Expect bullish momentum.
Strategy: Buy after a retest above Resistance R1 (~3700).
Target: Trendline Resistance R2 → ~3780.
If the Federal Reserve Increases the Funds Rate
Expect bearish momentum.
Strategy: Sell after a retest below Support S1 (~3623).
Target: Support S2 → ~3540.
⚠️ Stop Loss (SL):
Around 3658, near current consolidation zone.
🎯 Summary
Bullish case (Rate Cut): Buy above 3700 → Target 3780.
Bearish case (Rate Hike): Sell below 3623 → Target 3540.
Market direction will strongly depend on FOMC Funds Rate decision.

XAUUSD H1 – Pennant + Head & ShouldersXAUUSD H1 – Pennant + Head & Shoulders: Two Key Levels 3657 / 3627
Hello Traders,
Gold opened the week with a bounce of over 20 points from the rising trendline and is now consolidating within a Pennant, which aligns with a small Head & Shoulders structure on the H1 chart. At the moment, the market is waiting for a breakout and confirmation to establish a clearer direction.
Pattern: A narrowing Pennant Flag alongside an H&S (left shoulder – head – right shoulder).
Key Zones to Watch
3655–3660: Crucial reaction zone (trendline + Pennant top).
3627: Critical support — a break below would invalidate the short-term bullish structure.
Fibonacci Levels:
1.618 in the mid-range, 2.618 lower — possible targets for a deeper correction.
MACD (12,26,9): Histogram has turned negative → short-term bearish momentum has the edge, though clear confirmation is still pending.
Trading Scenarios
Bullish Setup
Entry: Retest around 3654–3657
Targets: 3663 – 3670 – 3680 → 3695
Stop: Below 3648
Bearish Setup
Entry: Sell directly on breakdown, or wait for a retest near 3671–3674
Targets: 3663 – 3650 – 3633 – 3615 → 3595 → 3568 → 3540
Stop: Above 3679
the market is currently pricing in near certainty of a 0.25% Fed rate cut on 17th September, while the probability of a 0.50% cut still remains on the table.
If you find this analysis helpful, feel free to share your thoughts in the comments. I’ll update the outlook as soon as the price structure changes — follow me to get the latest setups first.

LiamTrading – XAUUSD Strategy for TodayI would like to share my personal view on gold for the day.
The overall trend in XAUUSD continues to be very strong, with the price consistently making fresh highs over the past two weeks. Buying interest has remained steady across sessions, while any corrections have been short-lived, mostly visible on the M15–M30 timeframes.
Yesterday, gold broke out of the Pennant pattern on the upside and is now consolidating near 3,680. On the H4 chart, this level aligns with an important Fibonacci zone, providing further technical confirmation.
From an Elliott Wave perspective, I expect Wave 3 to conclude near 3,700, followed by a corrective Wave 4 towards 3,660 – a level which has acted as reliable support in the past. After that, gold may enter its final Wave 5, with the potential to move towards the 3,740+ region.
Trading setups for consideration:
Buy 3658 – 3656, SL 3651, TP 3674 – 3688 – 3700 – 3715 – 3730 – 3744
Sell 3697 – 3700, SL 3705, TP 3688 – 3672 – 3660 – 3650
Sell 3740 – 3744, SL 3748, TP will be decided based on the price structure at that time
Important levels to keep in focus: 3673 – 3663 – 3635 and 3721, as these zones may trigger price reactions and could be useful for intraday scalping opportunities.
This is my personal outlook on gold for today. I hope it will be helpful to fellow traders in making better trading decisions. Kindly share your feedback in the comments.

Gold 4H Outlook – Buy the Dip or Fade the Drop?On the 4H timeframe, Gold is consolidating just below 3,600 after a strong bullish rally. The current structure shows price pausing near premium levels, with liquidity building both above 3,600 and below 3,530. This indicates engineered sweeps are likely before the next major move.
📌 Key Structure & Liquidity Zones (4H):
🔼 Buy Zone 3,572 – 3,574 (SL 3,565): Fresh demand zone at intraday discount; potential continuation level.
🔽 Sell Scalp Zone 3,530 – 3,526 (SL 3,537): Short-term supply/pivot area; scalp opportunity if rejection happens.
📍 Liquidity Magnet 3,603 – 3,605: Upside imbalance area likely to get filled.
📊 Trading Ideas (Scenario-Based):
🔺 Buy Setup – Demand Zone Reaction
Entry: 3,572 – 3,574
Stop Loss: 3,565
Take Profits:
TP1: 3,585
TP2: 3,595
TP3: 3,605
👉 Demand block in line with bullish order flow. Watch for a liquidity sweep and rejection to fuel trend continuation.
🔻 Sell Scalp Setup – Short-Term Reaction
Entry: 3,530 – 3,528
Stop Loss: 3,537
Take Profits:
TP1: 3,520
TP2: 3,510
TP3: 3,500
👉 Intraday supply/pivot area. Best suited for quick scalp trades against the trend, targeting downside liquidity.
🔑 Strategy Note
Overall bias stays bullish, but intraday shorts can work for scalping purposes. The cleaner setup is to buy from 3,572–3,574 for continuation towards 3,600+. Smart money may attempt a liquidity sweep at 3,530 before pushing higher.

“Gold Shines Bright | Bullish Momentum Targeting $3,700🔎 Technical Analysis – XAU/USD (1H Chart)
Trend: Strong bullish trend confirmed, with price making higher highs and higher lows.
Buy Zone: Around 3,590 – 3,600 USD, where buyers stepped in aggressively.
Short-Term Target 🎯: 3,650 – 3,700 USD (already highlighted on chart).
Key Support Levels:
3,561 USD (near-term support)
3,490 USD (major support, bullish structure invalidation if broken)
📌 Outlook: As long as price holds above the buy zone, momentum favors bulls with potential continuation toward 3,700+ USD.
🌍 Fundamental Drivers for Gold Bullishness ✨
Federal Reserve Rate Cuts Expectations 🏦⬇️ – If the Fed signals easing or holds a dovish stance, real yields fall → Gold strengthens.
Weakening US Dollar (DXY) 💵📉 – A softer dollar makes gold more attractive to global investors.
Geopolitical Risks 🌍⚠️ – Rising global tensions increase demand for safe-haven assets like gold.
Central Bank Demand 🏦🔒 – Many central banks are adding gold reserves to hedge against currency risks.
Inflation Hedge 📊🔥 – Gold remains attractive when inflationary pressures stay elevated.

XAUUSD – Wave (4) Pullback Could Launch Wave (5)Namaste Traders
Gold on the M30 chart remains bullish, but the push into the upper channel line signals short-term profit booking. For those trading Gold/USD or tracking Gold in INR terms on MCX, here’s my plan for the upcoming sessions:
🔍 Technical Overview
Price completed Wave (3) around 3697.40, tagging the upper trend channel – a natural zone for sellers to take profits.
The 3666–3670 region has acted as a pivot/support multiple times. I expect a Wave (4) correction into this zone before a fresh rally.
3657 is deeper support and also serves as the invalidation level for the bullish scenario.
If Wave (4) holds, Wave (5) could push towards 3720–3725.
📈 Key Levels
Type Price Level Notes
Resistance 3695–3700 Wave (3) top + upper channel edge – watch for rejection
Support (1) 3666–3670 Primary buy zone for Wave (4)
Support (2) 3657 Strong support & invalidation
Target (5) 3720–3725 Expected Wave (5) extension target
⚙️ Trading Plan
✅ Primary Setup – Buy the Dip (Trend Continuation)
Entry Zone: 3666–3670 (or a small sweep to ~3657).
Confirmation: Look for a bullish engulfing candle, pin bar, or MACD crossover on the M30 chart.
Take Profit:
TP1: 3695–3700 (previous high/resistance)
TP2: 3720–3725 (Wave (5) projection)
Stop Loss: Below ~3652.
Risk/Reward: Aim for 1:2 to 1:3.
⚠️ Secondary Setup – Countertrend Short
If price retests 3695–3700 and forms a strong rejection, a quick countertrend short is possible.
Targets: 3670 → 3657.
Stop Loss: Above ~3703–3707.
Use small position sizing, as this is against the primary trend.
🛡 Risk & Invalidation
A close below 3656 plus a break of the lower trend channel invalidates the bullish Wave (5) scenario.
For Indian traders watching MCX Gold (in INR), keep in mind USD/INR fluctuations – a weaker rupee can amplify gold gains even if spot prices pause.
Always keep risk ≤1–1.5% per trade and avoid chasing late entries.
🧭 Final Thoughts
Gold’s trend is still bullish on the short-term chart. A healthy correction into 3666–3670 could offer a prime entry for Wave (5). Be patient, wait for confirmation, and let the price come to your zone.
Countertrend shorts are valid only on a clear rejection at 3695–3700 – otherwise, stick with the trend.
Good luck and happy trading,

Gold on Fire: Fed Rate Cuts & Global Tensions Fueling the Rally!Hello, fellow traders! Gold (XAU/USD) is on an absolute tear, closing strong at $3,680.80/oz on September 15, 2025, after hitting a new all-time high (ATH) of $3,685.39/oz. The past week has been solid, with gold up 1.6% as the US dollar weakened (down 0.3% to a one-week low) and US bond yields dropped. The market is buzzing with talk of a sure-shot 0.25% Fed rate cut on September 17, with some even betting on a bigger 0.5% move as per the CME FedWatch Tool. Plus, geopolitical tensions and reports of China easing gold import norms are adding more fuel to this fire. Let's do a deep dive and check out some solid trading setups! 💰
Fundamental Analysis: All That Glitters Is Gold! 🌟
Fed Rate Cuts: The latest US data is a mixed bag—the August CPI was hot, but the jobs market is cooling down. This is giving the Fed a clear signal to cut rates for the first time since December 2024. Lower interest rates are a big negative for the US Dollar, making non-yielding assets like gold super attractive. This is a classic "buy the rumor, sell the news" situation, but right now, the rumor is all about buying gold!
Geopolitical Jitters: The upcoming Fed meeting is quite tense, with political drama and a lot of pressure from the White House. This kind of uncertainty is gold's best friend, as it’s the ultimate safe-haven asset.
Chinese Demand: Recent reports suggest China is making it easier to import gold, which means more demand is coming from the world's biggest consumer. Strong buying from both official and private players in China is a major tailwind for gold's upward move.
Technical Analysis: Breaking All Barriers! 📉
Gold has smashed through the Fibo 2.618 level and is in uncharted territory. What's impressive is that the pullbacks are very shallow, just a $10 blip before it resumes its rally. This shows the bulls are in complete control, and selling pressure is minimal. The strategy is simple: look to buy on dips and be very selective about any shorting opportunities.
Resistance Levels: $3704, $3714, $3724
Support Levels: $3694, $3686, $3674, $3666
Trading Setups (Strict Risk Management Is Key):
Buy Scalp:
Zone: $3688 - $3686
SL: $3682
TP: $3691 - $3696 - $3701 - $3706
Buy Zone:
Zone: $3667 - $3665
SL: $3657
TP: $3675 - $3685 - $3695 - $3705 - $3715
Sell Scalp:
Zone: $3704 - $3706
SL: $3710
TP: $3701 - $3696 - $3691 - $3686
Sell Zone:
Zone: $3724 - $3726
SL: $3734
TP: $3716 - $3706 - $3696 - $3686 - $3676
Gold is at an ATH—so be careful of liquidity traps around the Fed announcement! Above $3694, the target is the sky; below, we could see a test of $3666. Manage your risk tightly before September 17! What's your plan: buy the dip or sell the top? Let me know your strategy in the comments! 👇
#Gold #XAUUSD #Fed #RateCuts #CPI #TradingView #MarketUpdate #Forex #Investing #TechnicalAnalysis #GoldTrading #Finance #Geopolitics #CentralBank

Gold 1H – Breakout Liquidity Trap Ahead of ExpansionGold on the 1H timeframe is consolidating around 3,652 after sweeping discount liquidity and reclaiming structure. Price has tapped the breakout zone and is currently trading between the scalp supply in premium and the higher liquidity pools. The structure indicates engineered moves into 3,656–3,658 or deeper liquidity around 3,672–3,674 before the next expansion. Discount demand remains protected at 3,614–3,612.
________________________________________
📌 Key Structure & Liquidity Zones (1H):
• 🔴 SELL ZONE 3,672 – 3,674 (SL 3,679): Premium supply pocket for engineered rejection, targeting 3,660 → 3,650 → 3,640.
• 🔴 SELL SCALP 3,656 – 3,658 (SL 3,663): Short-term premium sweep zone for intraday liquidity grabs, targeting 3,645 → 3,640.
• 🟢 BUY ZONE 3,614 – 3,612 (SL 3,607): Discount demand block aligned with bullish order flow, targeting 3,630 → 3,640 → 3,655.
________________________________________
📊 Trading Ideas (Scenario-Based):
🔻 Sell Setup – Premium Scalp Rejection
• Entry: 3,656 – 3,658
• Stop Loss: 3,663
• Take Profits:
TP1: 3,645
TP2: 3,640
👉 Intraday scalp opportunity if price sweeps into shallow premium liquidity.
🔻 Sell Setup – Deeper Premium Sweep
• Entry: 3,672 – 3,674
• Stop Loss: 3,679
• Take Profits:
TP1: 3,660
TP2: 3,650
TP3: 3,640
👉 Expect an engineered sweep into higher premium before reversal.
🔺 Buy Setup – Discount Demand Reaction
• Entry: 3,614 – 3,612
• Stop Loss: 3,607
• Take Profits:
TP1: 3,630
TP2: 3,640
TP3: 3,655
👉 A high R:R trade if price retraces to the protected demand before expansion.
________________________________________
🔑 Strategy Note
Smart money is likely to manipulate both premium and discount zones near the breakout point. The directional bias favours:
• Scalp sells at 3,656–3,658
• Swing sells at 3,672–3,674
• Discount buys at 3,614–3,612
Strict risk management is essential — expect liquidity sweeps on both sides before the actual expansion.

Elliott Wave Analysis XAUUSD – September 16, 2025
Momentum
• D1: Momentum is currently in an uptrend, suggesting that price may continue to rise for the next 5–6 days.
• H4: Momentum is turning downward, indicating the possibility of a correction today.
• H1: Recently showed a bullish reversal signal, but now there are signs of weakening again. This suggests that the downward move on H1 may not yet be complete.
Wave Structure
• D1: Yesterday’s daily candle created a new high, which indicates that wave iv (black) has likely been completed. The market is now developing in wave v (black).
• H4: Wave iv (black) is likely finished. With H4 momentum turning lower, wave 1 of wave v (black) may already be completed, and the market is now entering a corrective phase.
• H1: Wave v (black) is unfolding into a 5-wave structure (green). Combined with weakening H4 momentum, there are two possible scenarios:
1. This is wave 4 (green), with a maximum correction level around 3662.
2. This is wave 2 of wave v (black – D1), with a potential correction target around 3657.
Since both scenarios point to a similar price zone, we select 3662–3660 as the buy entry zone.
Trading Plan
• Buy Zone: 3662 – 3660
• SL: 3650
• TP: 3698

Gold 1H – Fed Week: Liquidity Sweeps Before FOMCGold on the 1H timeframe is range-bound around 3,643 after a series of ChoCH/BOS prints. Liquidity is stacked above the intraday buy zone at 3,658–3,656 and higher at 3,676–3,678, while discount liquidity sits near 3,615–3,613. With markets pricing a possible Fed cut this week and the dot-plot in focus, expect engineered spikes into premium followed by mean reversion before any sustained move.
________________________________________
📌 Key Structure & Liquidity Zones (1H):
• 🔴 SELL ZONE 3,676 – 3,678 (SL 3,683): Premium resistance for an engineered sweep/rejection targeting 3,665 → 3,655 → 3,645.
• 🟢 BUY ZONE 3,658 – 3,656 (SL 3,651): Intraday demand within prior consolidation targeting 3,665 → 3,670 → 3,675+.
• 🟢 BUY SUPPORT 3,615 – 3,613 (SL 3,610): Discount demand at the base of structure targeting 3,630 → 3,645 → 3,655+.
________________________________________
📊 Trading Ideas (Scenario-Based):
🔺 Buy Setup – Intraday Reclaim (3,658–3,656)
• Entry: 3,658 – 3,656
• Stop Loss: 3,651
• Take Profits:
TP1: 3,665
TP2: 3,670
TP3: 3,675+
👉 Look for a sweep into the zone and an H1 close back above 3,656 to confirm order-flow continuation.
🔺 Buy Setup – Deep Discount Sweep (3,615–3,613)
• Entry: 3,615 – 3,613
• Stop Loss: 3,610
• Take Profits:
TP1: 3,630
TP2: 3,645
TP3: 3,655+
👉 High R:R if liquidity runs into protected demand before the New York session.
🔻 Sell Setup – Premium Sweep to Resistance (3,676–3,678)
• Entry: 3,676 – 3,678
• Stop Loss: 3,683
• Take Profits:
TP1: 3,665
TP2: 3,655
TP3: 3,645
👉 Expect a stop-run above recent highs into premium; invalidate on a firm H1 close above 3,683.
________________________________________
🔑 Strategy Note
Into Fed week, smart money often runs both sides of the book. Bias today favours: discount buys at 3,658–3,656 and 3,615–3,613, and a premium fade at 3,676–3,678. Use reduced size, wait for structure confirmation, and avoid holding through any unexpected Fed headlines or USD spikes.

GOLD SHOWING A GOOD UP MOVE WITH 1:10 RISK REWARD GOLD SHOWING A GOOD UP MOVE WITH 1:10 RISK REWARD
DUE TO THESE REASON
A. its following a rectangle pattern that stocked the market
which preventing the market to move any one direction now it trying to break the strong resistant lable
B. after the break of this rectangle it will boost the market potential for break
C. also its resisting from a strong neckline the neckline also got weeker ald the price is ready to break in the outer region
all of these reason are indicating the same thing its ready for breakout BREAKOUT trading are follws good risk reward
please dont use more than one percentage of your capitalfollow risk reward and tradeing rules
that will help you to to become a bettertrader
thank you
