Gold 1H – Fed Signals & Geopolitics Keep Bulls on the MoveGold on the 1H timeframe is trading around 3,705–3,710 after a strong breakout, staying within a rising channel. Liquidity is concentrated above at the premium resistance zone near 3,716–3,718, while demand is positioned lower at 3,687–3,689 and deeper at the FVG zone 3,654–3,656. Recent dovish signals from the Fed following last week’s rate cut, coupled with rising geopolitical tensions, continue to bolster safe-haven demand. However, upcoming U.S. inflation data and Fed speakers could trigger engineered moves into premium supply before retracements into discount demand zones.
________________________________________
📌 Key Structure & Liquidity Zones (1H):
• 🔴 SELL ZONE 3,718–3,716 (SL 3,725): Premium resistance where liquidity sweeps may cause short-term rejections targeting 3,710 → 3,700 → 3,690.
• 🟢 BUY ZONE 3,687–3,689 (SL 3,680): Near-term demand zone aligned with channel structure, offering a pullback entry targeting 3,695 → 3,700 → 3,715+.
• 🟢 FVG BUY ZONE 3,654–3,656 (SL 3,647): Deeper discount support, attractive for longer setups targeting 3,670 → 3,685 → 3,700+.
________________________________________
📊 Trading Ideas (Scenario-Based):
🔺 Buy Setup – Pullback to Demand (3,687–3,689)
• Entry: 3,687–3,689
• Stop Loss: 3,680
• Take Profits:
TP1: 3,695
TP2: 3,700
TP3: 3,715+.
🔺 Buy Setup – FVG Sweep (3,654–3,656)
• Entry: 3,654–3,656
• Stop Loss: 3,647
• Take Profits:
TP1: 3,670
TP2: 3,685
TP3: 3,700+
🔻 Sell Setup – Premium Liquidity Run (3,716–3,718)
• Entry: 3,718–3,716
• Stop Loss: 3,725
• Take Profits:
TP1: 3,710
TP2: 3,700
TP3: 3,690.
________________________________________
🔑 Strategy Note
The Fed’s dovish stance and safe-haven flows from geopolitical risks are sustaining bullish momentum, but intraday structure suggests smart money may first engineer stop-runs into premium resistance before retracing toward demand. Maintain buy-the-dip bias at defined support zones, while cautiously fading liquidity sweeps near 3,716–3,718. Volatility could increase as markets await fresh U.S. inflation data and Fed policy remarks.
Xauusdanalysis

Gold's Rally Continues: Why a Fed Cut Isn't Slowing It DownHello, traders!
Gold started the new week on an impressive note, trading at $3,685 in early Monday's session. The main drivers are the market's continued reaction to the Fed's recent rate cut and escalating geopolitical events. So, the big question is, how far will this rally go?
Fundamental Analysis: Why Is Gold Still Soaring?
Although the Fed cut interest rates by 0.25%—the first time in 2025—Chair Jerome Powell maintained a cautious stance, calling it a "risk management cut." While this initially caused some market jitters, in the long run, lower interest rates are a strong supporting factor for gold.
Lower Rates: They reduce the opportunity cost of holding gold, which is a non-yielding asset.
Geopolitical Tensions: Conflicts in Ukraine and the Middle East are escalating, boosting safe-haven demand. Ukrainian President Zelenskyy reported that Russia carried out a major drone and missile attack, reaffirming gold's role as a protective asset against global risks.
Technical Analysis: Breaking Resistance, The Uptrend Continues
Gold had a powerful rally at the start of the week, successfully breaking the key resistance zone at $370x. The price is currently hovering around $3720 with a slight correction, but the uptrend remains firmly intact.
Outlook: Given the strong upward momentum, short-selling (going short) with a tight stop-loss is extremely risky. We will continue to prioritize long positions (going long) as long as gold holds above the $370x level.
Suggested Trading Strategy (Strict Risk Management):
BUY SCALP
Zone: $3413 - $3711
SL: $3407
TP: $3716 - $3721 - $3726 - $3731 - $3741
BUY ZONE
Zone: $3700 - $3798
SL: $3790
TP: $3708 - $3718 - $3728 - $3738 - $3758
SELL ZONE
Zone: $3734 - $3736
SL: $3744
TP: $3726 - $3716 - $3706 - $3796 - $3779
The market is showing unpredictable volatility. Can gold overcome all barriers and set new records? Share your opinion in the comments below! 👇
#Gold #XAUUSD #Fed #GoldAnalysis #TradingView #FinancialMarkets #TechnicalAnalysis #GoldTrading #USD #Geopolitics
Gold (XAUUSD) Technical Analysis – September 22, 2025Gold (XAUUSD) technical analysis: Strong buy signal at $3,706. Support levels, resistance targets, stop loss strategy. September 2025 trading guide.

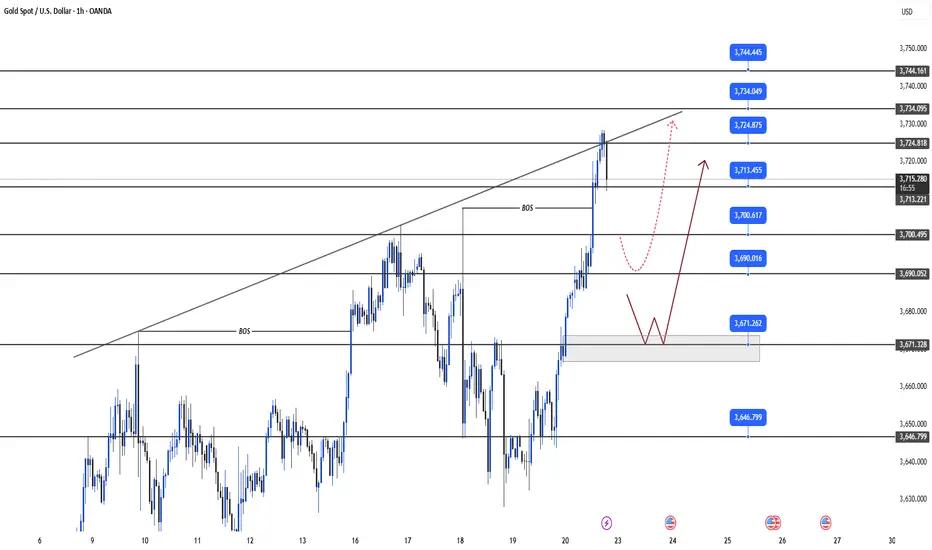
"Bullish Breakout Potential for Gold (XAU/USD) Above Key ?Key Observations:
The price is currently rising and is reaching a key resistance level.
A potential breakout is shown above the resistance at approximately 3,723.
A blue support zone between 3,686 and 3,690 suggests that the price has recently bounced off this level, implying bullish momentum.
The target price shown in the chart (with the green box) is positioned around 3,730, indicating that the trader is expecting further upward movement.
The stop-loss is placed just below the support zone, around 3,672, which suggests that the trader is managing risk.

Fed Dovish Signals & Geopolitical Tensions Boost Gold📊 Market Context
Gold continues to receive solid support from the Fed’s dovish tone and rising geopolitical tensions. However, the USD has extended its rebound from multi-year lows, which may temporarily limit gold’s upside. Broader risk-on sentiment in financial markets could act as a short-term headwind for XAU/USD before the next round of Fed speeches. Still, the long-term bullish trend has re-emerged, and gold is positioned to challenge new all-time highs in the near term—an important signal for Indian traders watching for fresh momentum in precious metals.
🔎 Technical Analysis (H1/H4)
Price has broken above the descending trendline, confirming that bullish momentum has returned.
Short-term support: 3686–3684, maintaining this level preserves the bullish structure.
Additional support: 3670–3668, overlapping with CP and liquidity zones on the chart.
Key resistance: 3720–3722, a crucial reaction level for profit-taking or liquidity sweeps.
🔑 Key Levels
Resistance: 3707 ➡️ 3720
Support: 3685 ➡️ 3669 ➡️ 3658
📈 Scenarios & Trading Plan
✅ BUY ZONE 1: 3686–3684
SL: 3680
TP: 3690 ➡️ 3695 ➡️ 3700 ➡️ 3705 ➡️ 3710 ➡️ 3720 ➡️ …
✅ BUY ZONE 2: 3670–3668
SL: 3664
TP: 3675 ➡️ 3680 ➡️ 3690 ➡️ 3700 ➡️ …
✅ SELL ZONE (Liquidity Trap Watch): 3720–3722
SL: 3726
TP: 3715 ➡️ 3710 ➡️ 3705 ➡️ 3700 ➡️ …
⚠️ Risk Management Notes
Watch for false breakouts at 3720–3722 — price could sweep stops before reversing lower.
Only enter longs with price action confirmation at the buy zones; avoid chasing price mid-range.
Manage trade size carefully given potential volatility from Fed comments and geopolitical news.
✅ Summary
Gold’s long-term bullish trend is firmly back, supported by Fed dovishness and geopolitical factors—key drivers for India’s gold market sentiment. The plan focuses on buying dips at 3686–3684 and 3670–3668 targeting 3705–3720, while short-term selling at 3720–3722 is valid if rejection appears.
📢 Stay updated with MMFLOW TRADING on TradingView for fresh market insights and actionable setups tailored for gold traders

LiamTrading – XAUUSD Trading Scenario for TodayGold continues its robust upward momentum and is now approaching the critical resistance zone around 3,697 – 3,700. This is a confluence point with the Fibonacci extension level and also a zone where sellers might re-enter strongly.
Technical Analysis
On the H1 chart, the price has tested the resistance zone multiple times but hasn't broken through decisively. This indicates that profit-taking pressure is emerging.
The sell confirmation zone will form if the price breaks below 3,685 – 3,686, at which point the correction target could be around 3,673.
The main Buy Zone is located at 3,650 – 3,645, coinciding with previous support and a strong liquidity area. This is a region where a price increase reaction is likely.
Further down, the 3,628 – 3,630 zone is considered solid support on the larger frame, and if retested, it will be a long-term buying opportunity.
Conversely, if the price decisively surpasses the strong resistance zone of 3,720 – 3,730, the upward trend will be confirmed to continue, opening up higher targets around 3,750+.
Trading Plan Reference
Short-term sell around 3,697 – 3,700, SL 3,707, TP 3,686 – 3,673.
Short-term buy around 3,650 – 3,645, SL 3,640, TP 3,673 – 3,690.
Long-term buy around 3,628 – 3,630, SL 3,620, TP 3,660 – 3,690 – 3,720.
These are my personal views on XAUUSD, and you can use them as a reference to build your own plan. If you find this useful, follow me for the latest updates on new gold trading scenarios.

XAUUSD – Daily Trading Plan
Hello Traders,
Gold opened the Asian session holding its price structure firmly. The 3708 level will be the key pivot today:
If price sustains above this level, the next upside targets are 3750 and possibly 3780.
If price reacts lower at 3708 resistance, then 3650 or even 355x could be the zones to watch for buying opportunities.
Fundamental Context
Last week’s correction was triggered by comments from the Fed Chair on interest rate policy. The Fed does not intend to cut rates too frequently, and this week’s PCE data will play a decisive role in shaping the outlook.
Trading Strategy for Today
Buy Setup
Entry: 3650 – 3653
SL: 3645
TP: 3662 – 3675 – 3690 – 3706 – 3725
Sell Setup 1
Entry: 3700 – 3703
SL: 3708
TP: 3690 – 3675 – 3662 – 3650 – 3633
Sell Setup 2
Entry: 3738 – 3740
SL: 3746
TP: 3725 – 3710 – 3700 – 3675 – 3650
Summary
The preferred bias for today is to look for buy opportunities on dips, in line with the broader uptrend.
Follow me to receive the latest updates as soon as market structure changes

Elliott Wave Analysis XAUUSD – September 21, 2025
Momentum
• D1: Momentum is still declining → suggesting that early next week price may either experience a downward move or continue to range sideways.
• H4: Momentum is in the overbought zone → likely to see a corrective move on Monday.
• H1: Momentum is also in the overbought zone → during the Asian session on Monday, a short-term corrective decline is highly probable.
Wave Structure
• D1:
o Scenario 1: Wave v (black) has already completed (refer to H4). This means the market is now in a larger corrective phase, and price is unlikely to break above 3709, the high set last week.
o Scenario 2: Wave 4 (black) of wave v has completed, and Friday’s rally was wave 5 (black) of wave v. In this case, early next week we could see a breakout above 3709 with a daily close higher.
• H4: Since D1 and H4 momentum still support a corrective move on Monday, I will keep the current wave labeling unchanged. Only if price breaks strongly above 3709 will I update the labeling to Scenario 2.
• H1: On D1, the two scenarios are contradictory:
o One scenario suggests a decline.
o The other suggests a new high.
Therefore, the best approach for now is to wait for more confirmation. On H1, the labeling from last Friday (the bearish scenario) has not yet been invalidated and is still supported by both D1 and H4 momentum, so I will continue to monitor this count.
Trading Plan
During complex corrective phases, when wave structures are not yet clear, I do not recommend trading solely based on Elliott Wave. For now, the prudent approach is to continue observing until more data becomes available.
If trading is necessary, it’s better to focus on short-term scalps rather than larger swing positions.

LiamTrading – Long-Term Trend for XAUUSD is Taking ShapeGold continues its robust upward momentum, currently trading around 3,680 – 3,685. After a series of consecutive bullish candles, the price is showing signs of consolidation and slight adjustment, paving the way for crucial scenarios in the upcoming phase.
Technical Analysis
On the Daily chart, the RSI has surpassed the 70 mark, indicating an overbought condition. This is often an early warning sign for a potential correction.
The price structure suggests that the FVG zone of 3,630 – 3,600 will be the first observation point if a short-term correction occurs.
A stronger support zone lies at 3,510 – 3,475, coinciding with Fibonacci levels 0.5 – 0.382, and also the previous resistance area that has been broken. This is considered a potential long-term 'Buy zone'.
If the correction completes, gold has the potential to return to its upward trend with a further target around 3,800 (Fibonacci extension levels 2.618 – 3.618).
Trading Scenarios
Short-term: Monitor the reaction at 3,630 – 3,600. If it holds, there might be a short recovery.
The price area around 3552-3562 should be watched for reactions.
Medium-term: Wait for the price to test the 3,500 – 3,475 zone to find more sustainable buying opportunities.
Long-term: The major trend still leans towards an increase, with an expected target towards 3,800.
This is my personal view on XAUUSD, and you can consider it to build your own plan. If you find it useful, follow me for the latest updates on gold's upcoming scenarios.

XAUUSD – Strong Resistance at 3760–3770 Await ConfirmationHello trader,
Gold continues to fluctuate within the accumulation zone after the recent recovery. Although the larger trend leans towards an increase, a clear confirmation at key resistance-support levels is needed for a stronger breakout.
Strong Resistance: 3760 – 3770, converging with the Fibonacci extension zone. This is a crucial level if the price aims to create a new ATH in the mid-term.
Key level Sell: 3685 – 3695, currently a short-term resistance zone. If the price fails to break through, gold may face downward pressure.
Important Support:
3564 – 3574: mid-term support.
3534 – 3540: deep support zone, aligning with previous liquidity.
MACD H4: Histogram remains weak, momentum is unclear → the market needs further confirmation to clearly define the trend.
Trading Scenario
Bullish Scenario
Condition: Price breaks above 3695 and holds.
Entry: Retest 3665 – 3668.
Target: 3680-3698-3715-3730 – 3760 – 3770.
Extension: If successfully surpassing 3770 → expect a move towards 3800+.
Bearish Scenario
Condition: Price fails at 3695 and reverses.
Entry: Sell at 3685 – 3695 zone upon rejection signal.
Target: 3672-3655-3635 – 3600 – 3574.
Extension: If breaking 3574, the decline may target 3540, or even deeper.
Mid-term Scenario
Price may retest 3534 – 3550 to gather liquidity, then rebound following the larger trend. This will be an attractive long-term Buy zone.
The gold market is at a crucial stage: buyers need to break 3695 to confirm the uptrend, while sellers still have opportunities at the short-term resistance zone. Deep support levels will continue to serve as a foundation for mid-term Buy strategies.
Keep a close watch on 3695 and 3760 – 3770 to determine the next direction.
Stay tuned for the latest scenarios as the price structure evolves.

ETHUSD 2.5R sell side trade scenarioETHUSD is forming sell side trades as current bias and draw on liquidity both are at down side. Price has also left SIBIs to attract price upside for a while and then return back to target. In weekend price may have low volatility and trade possibly generate on Monday or later.
1. There is a daily time frame bearish FVG.
2. There is bearish FVG in 4H TF. Now price is approaching it slowly.
3. These FVGs are forming inside OTE zone.
4. Order flow is bearish. And draw on liquidity is also at downside.
5. Most probably price will take liquidity of FVGs and create MSS/CISD/TS/iFVG in LTF.
6. Price should show rejection/reversal in LTF (5m,1m) at FVG zone.
7. BTC is also forming similar scenario.
All these combinations are signalling a high probability and 2.5R trade scenario.
Note – if you liked this analysis, please boost the idea so that other can also get benefit of it. Also follow me for notification for incoming ideas.
Also Feel free to comment if you have any input to share.
Disclaimer – This analysis is just for education purpose not any trading suggestion. Please take the trade at your own risk and with the discussion with your financial advisor.

XAUUSD - Flag PatternWhats your take on Guys.
#Institutions Consolidation going on - #Accumulation or #Distribution.
Kind of #Triangle #pattern in formation, ##Flagpattern. DO your analysis, Enter trade on Breakout and confirmation side. Trade with #confluence. i would say accumulate at bottom of pattern with SL and Participate in full swing before #Breakout.

GOLD – Breakout / Swept High – Where to BUY?1. Market Overview
Gold prices are consolidating around 3655 – 3660 after showing a short-term bearish structure.
On the H1 chart, we can see clear supply and demand zones:
• Liquidity Buy Zone near 3640 (potential demand area).
• Imbalance / Supply Zone around 3670 – 3680.
The broader higher-timeframe trend is still bullish, but in the near term the market is retesting liquidity levels.
________________________________________
2. Key Levels & Zones
• Liquidity Buy Zone: 3640 – 3645 → important support.
• Sell Scalp Zone / Imbalance: 3670 – 3680 → short-term resistance.
• Higher High Target (HH): 3700 – 3710 → strong higher-timeframe resistance.
• Long-term Support: 3620 – 3630.
________________________________________
3. Main Trading Scenarios
🟢 Long Setup (with trend)
• Wait for price to revisit the Liquidity Buy Zone (3640 – 3645).
• If bullish reversal signals appear (pin bar, engulfing candle, etc.), consider entering a Long position.
🎯 Targets:
• Short-term: 3678 (trendline break retest).
• Mid-term: 3700 – 3710 (higher high).
🔴 Short Setup (scalp only)
• If price pushes into the Sell Scalp Zone (3670 – 3680) and faces strong rejection → take a Short scalp.
• 🎯 Target: 3640 – 3645.
⚠ Note: Shorts go against the main bullish trend, so they should be managed quickly and not held for long.
________________________________________
4. Trade Management Notes
• Focus on Long trades near support, as higher timeframe bias is still bullish.
• Short positions should only be taken as scalp setups near resistance.
• Risk control: limit risk to 1–2% per trade, avoid holding trades against the main trend.
________________________________________
📌 Conclusion
Gold (XAUUSD) is currently testing the descending trendline and resistance zone.
• A successful breakout may lead price towards 3700+.
• Otherwise, the market is likely to dip back into 3640 before starting the next bullish leg.

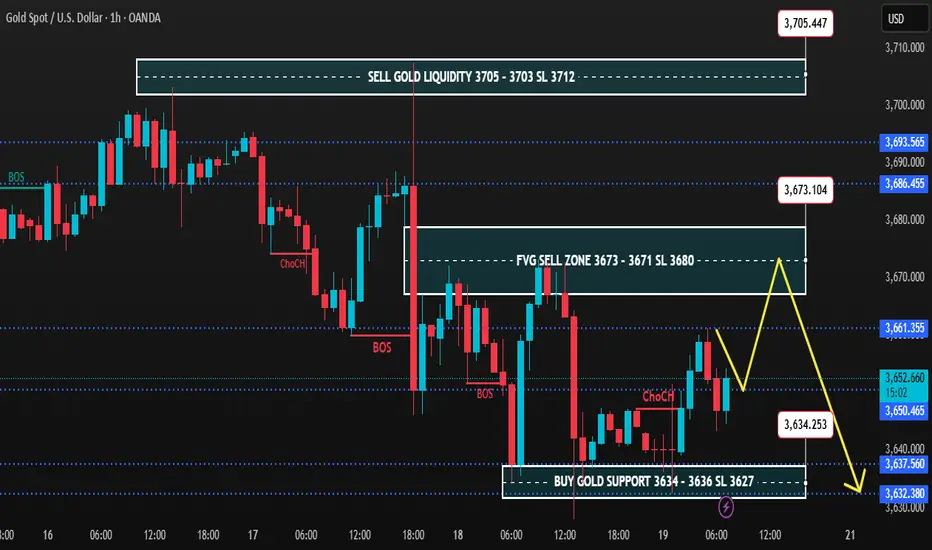
Gold 1H – Risk of Premium Sweeps Before ReversalOn the 1H timeframe, gold is consolidating after consecutive BOS and ChoCH signals, showing rejection from premium levels. The market is oscillating between the fresh FVG sell zone at 3,673–3,671 and the deep discount support at 3,634–3,636. Liquidity remains positioned above 3,705 and below 3,632, keeping scope for engineered sweeps before a clearer directional move emerges.
________________________________________
📌 Key Structure & Liquidity Zones (1H):
• 🔴 FVG SELL ZONE 3,673 – 3,671 (SL 3,680)
Premium intraday pocket for rejection, targeting 3,660 → 3,650 → 3,640.
• 🔴 SELL GOLD LIQUIDITY 3,705 – 3,703 (SL 3,712)
Major premium liquidity trap, likely to precede continuation lower towards 3,690 → 3,675 → 3,660.
• 🟢 BUY GOLD SUPPORT 3,634 – 3,636 (SL 3,627)
Discount demand zone, aiming for recovery towards 3,645 → 3,660 → 3,670 if defended.
________________________________________
📊 Trading Ideas (Scenario-Based):
🔻 Sell Setup – FVG Rejection (3,673–3,671)
• Entry: 3,673 – 3,671
• Stop Loss: 3,680
• Targets:
TP1: 3,660
TP2: 3,650
TP3: 3,640
👉 Expect engineered liquidity grab into the FVG before downside extension.
🔻 Sell Setup – Premium Liquidity Sweep (3,705–3,703)
• Entry: 3,705 – 3,703
• Stop Loss: 3,712
• Targets:
TP1: 3,690
TP2: 3,675
TP3: 3,660
👉 Smart money may sweep highs near 3,705 before resuming bearish leg.
🔺 Buy Setup – Discount Reversal (3,634–3,636)
• Entry: 3,634 – 3,636
• Stop Loss: 3,627
• Targets:
TP1: 3,645
TP2: 3,660
TP3: 3,670
👉 High risk-reward opportunity if gold defends discount demand; suitable for counter-trend scalps.
________________________________________
🔑 Strategy Note
Gold remains under pressure below 3,673–3,705, favouring short setups into premium sweeps. However, close attention is needed at 3,634–3,636, as buyers may attempt to accumulate and reclaim structure. Best practice: trade smaller lots until the New York session provides confirmation of direction.
Gold Dips After Fed Meeting: What's Next for the Market?Hey traders!
After a super volatile session, gold prices took a hit yesterday (September 18). The precious metal dropped 0.4% to $3,643.40/oz, while futures contracts lost 1.1% to $3,678.30/oz. This comes right after gold hit a new record of $3,707.40/oz in the previous session. Is this a signal for a major correction or just a bit of profit-taking? Let's break it down!
Fundamental Analysis: The Market 'Digests' the Fed's Message
While the Fed did cut rates by 0.25% as expected, the message from the meeting wasn't entirely 'dovish'. Fed Chair Jerome Powell raised doubts about the pace of future policy easing. He stressed that the rate cut was just a "risk management" move to address a weakening labor market, not a firm promise for aggressive easing.
USD Recovers: The Fed's cautious stance helped the USD index gain 0.5%, making gold more expensive for holders of other currencies.
Long-Term Drivers Still Strong: Despite the short-term dip, experts remain bullish on gold. The core drivers for its rally are still in place:
BRIC Central Bank Buying: Central banks, especially from China, continue to diversify their reserves, moving away from the USD.
Safe-Haven Demand: Ongoing geopolitical and trade tensions are still a key reason for investors to flock to gold.
Swiss Data Confirms: Data shows that gold exports from Switzerland to China jumped 254% in August 2025 compared to July, which proves that real demand is super strong.
Technical Analysis: Unpredictable Volatility
After the FOMC meeting, gold was all over the place, breaking through resistance and support levels in a flash. The market is reacting more to macro news than to technical patterns right now.
Resistance: $3671, $3686, $3694
Support: $3647, $3632, $3612, $3598
Outlook: Today, we should still prefer long positions if gold stays above the $365x level. However, if gold closes a candle below $364x during the US session, be cautious and consider a switch to sell positions.
Suggested Trading Strategy (Use Strict Risk Management):
SELL ZONE
Zone: $3686 - $3688
SL: $3696
TP: $3678 - $3668 - $3658 - $3648 - $3638
BUY ZONE
Zone: $3616 - $3614
SL: $3606
TP: $3624 - $3634 - $3644 - $3654 - $3664
The market is super sensitive to news right now. Always be careful and don't overtrade. Do you think this is a buying opportunity or a time to step back? Share your thoughts in the comments below! 👇
#Gold #XAUUSD #Fed #GoldAnalysis #TradingView #FinancialMarkets #TechnicalAnalysis #GoldTrading #USD #BRIC

XAUUSD – Correction Target on H4Technical Analysis
After reacting at the Sell Zone – FVG around 3,670, Gold could not sustain the upward momentum and is now showing signs of weakness. The H4 structure indicates that the correction phase is extending, with price likely to retest key support areas below.
On the chart, the support zones at 3,633–3,632 and 3,626 are acting as intermediate levels. If these zones fail to hold, selling pressure may push price deeper towards 3,614–3,612, before testing the major support confluence with Fibonacci extension and the potential Buy Zone at 3,579–3,560.
The RSI is currently hovering around 45–50, suggesting momentum is tilted towards a corrective move rather than a strong uptrend.
Trading Scenarios
SELL Setup (preferred):
Entry: on a retest of the 3,665–3,670 Sell Zone
SL: above 3,675
Targets: 3,633–3,632-3,626-3,614–3,612-3,579–3,560
BUY Setup (short-term / scalping):
Entry: consider buys around 3,626–3,625 support
SL: below 3,618
Targets:3,633-3,645-3,650
Key Levels to Watch
3,670: Sell Zone – confluence with FVG post-FOMC.
3,633–3,626: Short-term support; a break below confirms extended bearish pressure.
3,612: Key level for deciding near-term direction.
3,579–3,560: Potential Buy Zone and main corrective target on H4.
Traders may keep these levels on watch and align positions accordingly. Follow for quicker access to future updates.

XAUUSD –Today’s Trading Outlook | Sell Fill Liquidity & Buy Zone
Hello traders,
In the recent sessions, gold has continued to show strong volatility around important liquidity zones and support–resistance levels. The current structure indicates that sellers remain in control in the short term, while buyers are expected to return only if price reaches deeper support areas.
Technical View
Main Resistance: 3670 – 3680, aligning with the FVG zone → key area for Sell to Fill Liquidity.
Short-term Support: 3630 – 3627. A break below could open the way for a deeper decline.
Buy Scalping Zones: 3613 – 3615 and 3595 – 3598, suitable for quick intraday longs.
Medium-term Buy Zone: 3600 – 3590, confluence with strong liquidity zone and major support.
MACD Indicator: leaning bearish, with a negative histogram, showing selling pressure still dominant.
Trading Scenarios
Sell Setup (priority)
Sell Liquidity Zone: 3670 – 3680
SL: 3685
TP: 3650 – 3635 – 3627 – 3615 – 3600
Buy Scalping
Buy Zone 1: 3613 – 3615 | SL: 3608 | TP: 3625 – 3638 – 3645
Buy Zone 2: 3595 – 3598 | SL: 3590 | TP: 3610 – 3625 – 3638 – 3645 – 3670
Medium-term Buy
Zone: 3600 – 3590
SL: 3584
Extended TP: 3633 – 3660 – 3675
Conclusion
In the short term, gold is likely to retest the upper liquidity zone before continuing with further declines. Sellers remain in control for now, but deeper support zones will provide potential entry levels for medium-term buyers.
Keep a close watch on these key levels and align your trades with your personal strategy.
Follow along to get the earliest updates whenever market structure changes.

Elliott Wave Analysis XAUUSD – September 19, 2025
Momentum
• D1 timeframe: Momentum is currently declining, suggesting that the downtrend may continue until momentum enters the oversold zone. This process could take at least 2 daily candles, including the current one.
• H4 timeframe: Momentum is turning upward, but repeated reversals at the oversold zone, along with overlapping price action, indicate that the market is in a complex corrective phase.
• H1 timeframe: Momentum has already turned upward, with 3 H1 bullish candles formed. It is expected that within 1–2 more candles, momentum will likely reach the overbought zone.
Wave Structure
• D1 timeframe: The 5-wave black structure has been completed. The current correction is expected to last longer compared to the previous WXY triangle correction.
• H4 timeframe: Wave counting is complicated due to overlapping price movements. With momentum now recovering, wave B is likely unfolding, which will then be followed by the completion of wave C.
• H1 timeframe: A temporary channel can be drawn to observe price behavior. The market is likely in wave B (black), forming a Flat structure (ABC in blue). Wave C (blue) is projected to equal wave A (blue) at the 3667 level. This price zone also coincides with the boundary between high and low liquidity areas on the Volume Profile, making it a strong resistance zone for potential short entries.
Trading Plan
• Sell Zone: 3667 – 3670
• SL: 3680
• TP: 3644

GOLD SHOWING A GOOD UP MOVE WITH 1:10 RISK REWARD GOLD SHOWING A GOOD UP MOVE WITH 1:10 RISK REWARD
DUE TO THESE REASON
A. its following a rectangle pattern that stocked the market
which preventing the market to move any one direction now it trying to break the strong resistant lable
B. after the break of this rectangle it will boost the market potential for break
C. also its resisting from a strong neckline the neckline also got weeker ald the price is ready to break in the outer region
all of these reason are indicating the same thing its ready for breakout BREAKOUT trading are follws good risk reward
please dont use more than one percentage of your capitalfollow risk reward and tradeing rules
that will help you to to become a bettertrader
thank you

Gold Breaking Limits – Trend Speaks for ItselfGold Breaking Limits – Trend Speaks for Itself
Gold Market Outlook
Gold continues to demonstrate a well-structured bullish cycle, characterized by steady momentum and clean trend development. The market has transitioned from a prolonged consolidation phase into a sustained directional move, where each breakout is validated by controlled retracements. This reflects strong participation and confidence from larger players.
The sequence of market shifts and break-of-structure signals highlight how short-term pullbacks are consistently absorbed, turning into fuel for further expansion. Price action is orderly, with no signs of erratic volatility, showing that buyers remain in control and liquidity is being managed efficiently.
Overall, gold is moving in line with the broader macro sentiment. The rhythm of accumulation, expansion, and continuation suggests that the current cycle has not yet exhausted its potential. While interim pauses are expected, the structural integrity of the trend continues to favor upside development over the medium term.

Gold’s Next Bullish Move: Key Buy Zones & Targets to Watch Today🔥 Gold (XAUUSD) Bullish Momentum Alert! 🔥
After a strong rally, Gold bounced back impressively from today’s low at 3633 and is pushing up towards 3673. For intraday traders, the setup is clear: look for dips to jump in on the long side around 3654 - 3646 with exciting upside targets ahead!
📈 Trade Setup – Long on Pullback
Entry: Buy Gold at 3654
Add-on Dip: Add more at 3646
Targets: First target 3670-3675, then aiming for 3685
Invalidation: Cut losses if price falls below 3630
📊 Risk/Reward Snapshot
This is a tight-risk, high-reward setup — perfect for traders who want to keep their stops close while chasing solid gains. As always, manage your risk wisely and size your positions according to your plan.
Do you see the same bullish opportunity?
👍 Drop a like if you’re in!
💬 Share your thoughts or questions below — let’s build a sharp, winning community together!
Your feedback fuels us and keeps everyone trading smarter. Let’s make those pips! 🚀
Happy Trading,
– The InvestPro Team

Gold 1H – Retail Sales Impact Before FedOn the 1H chart, Gold is holding near 3,682 after showing a clear Break of Structure. Liquidity is now seen both above the premium resistance at 3,700 and below the Fair Value Gap demand around 3,669–3,667. With U.S. Retail Sales data due at 19:30 IST today, intraday volatility is expected, but overall positioning is still cautious ahead of the Federal Reserve’s interest rate decision later this week. Traders can look for liquidity sweeps towards premium levels before retracements into demand zones.
________________________________________
📌 Key Structure & Liquidity Zones (1H):
• 🔴 SELL ZONE 3,700 – 3,698 (SL 3,707): Premium resistance likely to trigger rejection towards 3,690 → 3,680 → 3,670.
• 🟢 FVG BUY ZONE 3,669 – 3,667 (SL 3,660): Fair Value Gap demand zone for retracements, targeting 3,680 → 3,690 → 3,700+.
• 🟢 BUY SUPPORT 3,641 – 3,639 (SL 3,632): Deep discount support, targeting 3,655 → 3,670 → 3,685+.
________________________________________
📊 Trading Ideas (Scenario-Based):
🔺 Buy Setup – FVG Reclaim (3,669–3,667)
• Entry: 3,669 – 3,667
• Stop Loss: 3,660
• Targets:
TP1: 3,680
TP2: 3,690
TP3: 3,700+
👉 Look for a liquidity sweep into the FVG zone before New York session begins.
🔺 Buy Setup – Discount Sweep (3,641–3,639)
• Entry: 3,641 – 3,639
• Stop Loss: 3,632
• Targets:
TP1: 3,655
TP2: 3,670
TP3: 3,685+
👉 A good risk-to-reward opportunity if price sweeps stops below structure before Retail Sales release.
🔻 Sell Setup – Premium Liquidity Run (3,700–3,698)
• Entry: 3,700 – 3,698
• Stop Loss: 3,707
• Targets:
TP1: 3,690
TP2: 3,680
TP3: 3,670
👉 Expect engineered stop-runs into premium supply before fading lower.
________________________________________
🔑 Strategy Note
While Retail Sales data may bring short-term price swings, market attention is focused on the Fed. Smart Money is likely to trap both sides of liquidity: fading premium near 3,700–3,698 while accumulating buys at 3,669–3,667 and 3,641–3,639. Trade with smaller positions and confirm with H1 closes before entries.
