06/08/2025 XAUUSD GOLD ANALYSIS Xauusd gold breaks support after retest we plan this trade 100pips done in this trade
Xauusdanalysis

Elliott Wave Analysis – XAUUSD August 6, 2025📊
________________________________________
🔍 Momentum Analysis
• D1 Timeframe:
Daily momentum is showing signs of a potential bearish reversal. However, we need to wait for today’s candle to close to confirm the signal. While waiting for confirmation, price may still experience a minor upward move on lower timeframes, but the current bullish momentum is weak and unlikely to extend far.
• H4 Timeframe:
Momentum is also preparing to reverse. We need to observe the current H4 candle for confirmation. Notably, the reversal signal is forming just below the overbought zone, suggesting there may be one more upward push before a potential decline.
• H1 Timeframe:
Momentum is approaching the oversold zone. It may take 1–2 more bearish candles before a short-term bullish rebound occurs.
________________________________________
🌀 Elliott Wave Structure Update
Yesterday’s bullish move was disappointing — instead of pushing directly to the 3402 or 3419 target zones to complete Wave 5, price only broke slightly above 3385 before reversing. This behavior complicates wave analysis by introducing conflicting possibilities.
We currently consider two main scenarios:
Scenario 1: Wave 5 is not yet complete
• Given that D1 momentum is preparing to reverse downward, it’s unlikely that the current move is Wave 1 of Wave 5. A more likely scenario is that Wave 3 of Wave 5 has completed and price is currently in Wave 4.
• The current corrective structure has stopped at the 0.382 Fibonacci level. As long as price remains above 3370 (the 0.5 Fib level), this strengthens the case for a Wave 4 retracement before another leg up in Wave 5.
• Since bullish strength appears limited, we now focus on two main target zones for Wave 5: 3395 and 3402, instead of the previous high at 3419.
Scenario 2: Full 5-wave structure is complete – now in correction
• If the 5-wave pattern has already finished, the current decline marks the beginning of a corrective phase.
• With current momentum conditions, this is still a viable scenario. However, due to the remaining upside possibility, we recommend waiting for today’s D1 candle to confirm momentum before taking any trade.
________________________________________
📌 Trade Plan
For experienced traders:
• Wait for price to reach the 3395–3402 zones.
• Look for reversal signals in those areas to enter short positions.
Suggested trade plan for newer traders:
• Sell Zone: 3395 – 3398
• Stop Loss: 3408
• Take Profits:
o TP1: 3385
o TP2: 3370
o TP3: 3349
________________________________________
✅ Note:
This trade plan should be reassessed after today’s D1 candle closes for confirmation of the momentum shift.

05/08/2025 XAUUSD GOLD TODAY ANALYSIS Xauusd gold in 30 MTF looking bearish if gold given any pullback look for sell and today there is a news ISM @ 7:30pm (IST)
I took this trade on 30MTF

04/08/2025 XAUUSD GOLD analysis for today Xauusd gold given breakout on last NY session with CPI news today gold will be bullish find buying position when it down move in small timeframe #04/08/2025

GOLD NFP Plan – Waiting for Breakout & Riding the Bullish Wave – GOLD NFP Plan – Waiting for Breakout & Riding the Bullish Wave
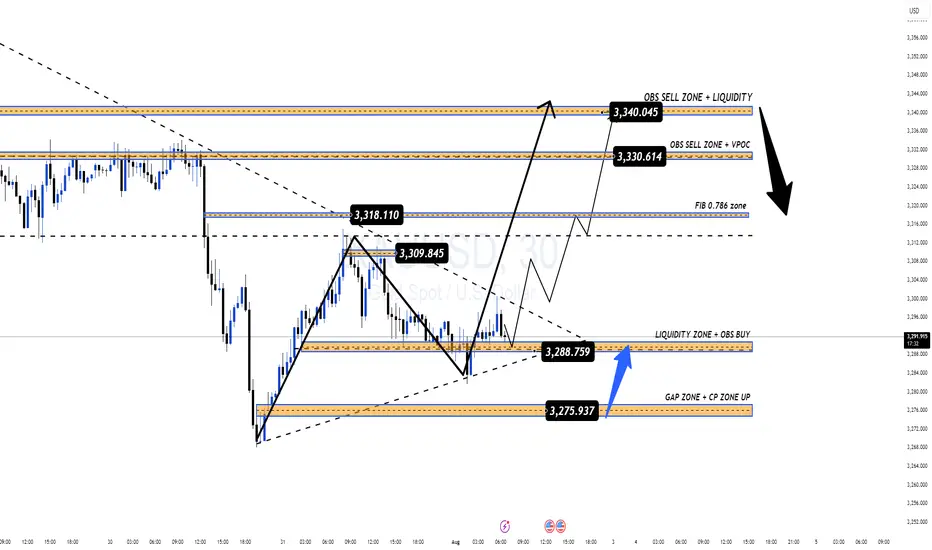
Gold is currently trading inside a large sideways triangle pattern, with price compressing toward the apex. However, based on recent candle structure and yesterday’s reaction at the key level, there’s strong momentum building for bullish continuation—likely forming a Wave 3 breakout if price can decisively break above the current descending trendline.
🔎 Technical Breakdown:
✅ BUY ZONE: 3276 – 3274 (confluence of CP ZONE + GAP + OBS BUY from yesterday)
📈 Price already reacted with +160 PIPS profit from this zone, confirming buyer control
⛓️ Descending trendline is compressing price – a breakout above it could unleash strong bullish momentum
🔄 SELL ZONE: 3339 – 3341 marked by OBS SELL ZONE + liquidity layer
📰 Fundamental Focus:
Today is Nonfarm Payrolls (NFP) day. With current forecasts pointing toward weaker-than-expected U.S. job data, the dollar could face pressure—creating the perfect scenario for gold to spike higher on BUY-side FOMO.
📌 Trade Plan:
🎯 BUY ZONE: 3276 – 3274
❌ Stop Loss: 3270
🎯 Take Profits:
3280 – 3284 – 3290 – 3294 – 3300 – 3305 – 3310 – 3320 – 3330 – 3340 – 3350
⚠️ SELL ZONE (counter-trend): 3339 – 3341
❌ Stop Loss: 3345
🎯 Take Profits:
3335 – 3330 – 3325 – 3320 – 3315 – 3310 – 3305 – 3300
📌 Key Notes:
Favor BUY setups in line with the trend—focus on reaction zones outlined on the chart.
If NFP data is bearish for the dollar, wait for strong confluences before entering any SELL, and avoid shorting prematurely against bullish momentum.
Gold Breakout Watch: Will XAUUSD Surge to $3760?Gold (XAUUSD) has spent the last few weeks coiling within a tight consolidation range, but the wait may soon be over. The daily chart shows a textbook rectangle formation, a powerful pattern that often precedes significant trend continuation. With prices currently pushing toward the upper resistance of this range, a bullish breakout could be imminent—and potentially explosive.
Let’s dive deep into the technical setup, the potential breakout targets, and what levels traders should be watching right now.
📉 The Pattern: Channel Consolidation
Since late May 2025, gold has been trapped in a sideways structure defined by:
Resistance Zone: $3,600 – $3,620
Support Zone: $3,270 – $3,290
This structure has formed after a massive prior rally earlier in the year, making it a classic bullish continuation pattern.
Each pullback into support has been met with buying, while resistance has repeatedly held—but now momentum is building.
Technically, this consolidation has validated itself with multiple swing points at both the upper and lower boundaries. The pattern is clean, well-respected, and supported by repeated reactions at both support and resistance levels. If the price breaks and sustains above the $3,620 resistance area, the pattern will be considered complete, signaling continuation of the prior bullish trend. While volume analysis isn't included in the chart, typically such breakouts are supported by increased participation, which can offer added confirmation.
If a breakout occurs, traders can target multiple price levels based on the height of the rectangle added to the breakout point. The first logical target would be around $3,616, followed by a swing-based target at $3,762. These levels are based on technical projection methods using the measured move technique. Importantly, price has already reached a reversal confirmation target around $3,430, which further validates bullish strength.
However, no setup is complete without acknowledging the risks. If gold fails to sustain the recent rally and instead breaks below $3,280 support, the current setup would be invalidated. This would shift the outlook to bearish and could push prices toward $3,200, $3,120, and possibly even lower toward the psychological support at $3,000.
From a trading perspective, the ideal bullish entry would be on a daily candle close above $3,620 or on a retest of the breakout zone with strong buying confirmation. A protective stop loss can be placed below the breakout candle or around the $3,550 area. Initial targets remain $3,616 and $3,762. In the bearish case, a breakdown below $3,280 would be a cue for shorting opportunities with stops above $3,300 and downside targets at $3,200 and $3,120.
In summary, gold is at a critical point on the chart. The current structure suggests a potential breakout is coming, and traders should be ready to act based on confirmed moves beyond key levels. Whether this pattern leads to a strong bullish continuation or a failed setup, the movement is expected to be sharp and potentially rewarding. This is a high-probability setup worth watching closely in the coming days.
=================================================================
Disclosure: I am part of Trade Nation's Influencer program and receive a monthly fee for using their TradingView charts in my analysis.
=================================================================

Liquidity Sweep Complete – Bullish Continuation Ahead?GOLD ANALYSIS 31/07: Liquidity Sweep Complete – Bullish Continuation Ahead?
🔍 Technical View | XAUUSD | 2H Chart | End of Month Setup
Gold has completed a final liquidity sweep around the 3269–3271 zone and has since rebounded strongly, in line with the prevailing bullish structure. The sharp drop yesterday during the FOMC rate statement appears to have served its purpose: grabbing final sell-side liquidity before preparing for the next bullish leg.
As of now, price is reacting at the 3295 zone, which coincides with the M30 CP (Change of Character) Zone, showing minor intraday retracement. A healthy pullback is likely before a potential bullish breakout of the descending trendline that has been holding price down over recent sessions.
🔵 BUY Strategy: Trend Continuation Setup
We’re watching for potential re-entries on a dip toward the OBS Buy Zone (3286–3284), created after the recent bullish move. This could be the last opportunity to catch the next impulsive leg higher.
Buy Zone: 3286–3284
Stop Loss: 3278
Targets: 3290 → 3294 → 3298 → 3304 → 3308 → 3312 → 3316 → 3320 → 3330 → ???
Key breakout confirmation will come if price closes strongly above 3313 (first key resistance). If broken, this opens the door toward the VPOC zone at 3328–3330, where a high-volume cluster awaits.
🔴 SELL Strategy: Short-Term Rejection Levels
Shorts only become favorable below the VPOC Sell Zone (3328–3330). If price closes above this area, bearish pressure is likely to fade, and bulls will dominate the next leg.
Sell Zone: 3328–3330
Stop Loss: 3335
Targets: 3324 → 3320 → 3315 → 3310 → 3305 → 3300
⚠️ Important: Selling inside a bullish breakout structure is high-risk unless the market gives clear rejection at major supply. Always wait for price action confirmation.
🕯️ Monthly Candle Insight (July Close)
Today marks the final trading day of July. Notably, the last two monthly candles have closed as Doji with long wicks, reflecting deep indecision and ongoing liquidity grabs. This aligns with the upcoming interest rate cut discussions at the next FOMC, which could ignite significant volatility.
📌 Summary:
Liquidity sweep at 3269–3271 is likely complete.
Price now retracing after strong bullish rebound from OBS Buy Zone.
Watch for confirmation above 3313, then 3328–3330 for breakout toward higher zones (335x–337x).
End-of-month close + macro narrative (FOMC) will be crucial to confirm direction.
💡 Pro Tip: Avoid entering late into reactive moves. Wait for retests of clean liquidity zones and use volume-based confluences to validate bias.
📲 Follow us @MMFlowTrading for real-time updates, macro analysis, and market structure insights on gold & major pairs.

XAUUSD
ALWAYS TAKE TRADE WITH CONFIRMATION
Note : Trading in any financial market is very risky. I post ideas for educational purpose only. It is not financial advice. Do not hold us responsible for any potential loss you may incur. Please consult your financial adviser before trading.

GOLD: Is This a Bottom or the Calm Before the Storm?🌐 Fundamental & Macro Landscape
The recent US–EU trade and defense pact has temporarily reduced gold’s appeal as a safe haven.
The US Dollar and stock markets remain strong thanks to positive macroeconomic data.
Current sentiment is risk-on, which typically shifts capital away from metals and into riskier assets.
But the real volatility could come later this week:
📅 High-Impact Events to Watch:
US ADP Employment Report
FOMC Statement + Nonfarm Payrolls (NFP)
These will likely decide whether gold resumes its uptrend or continues sliding lower.
📊 Technical Outlook (H1–H4)
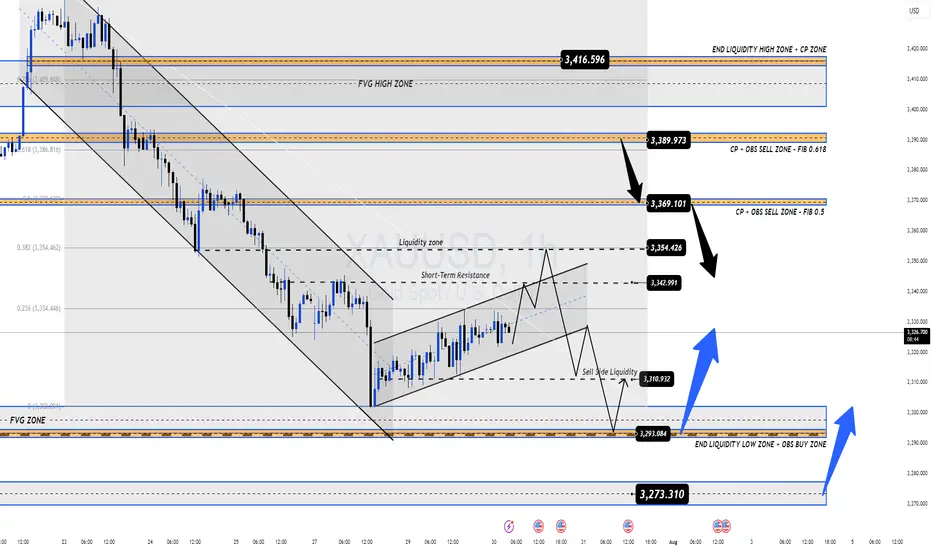
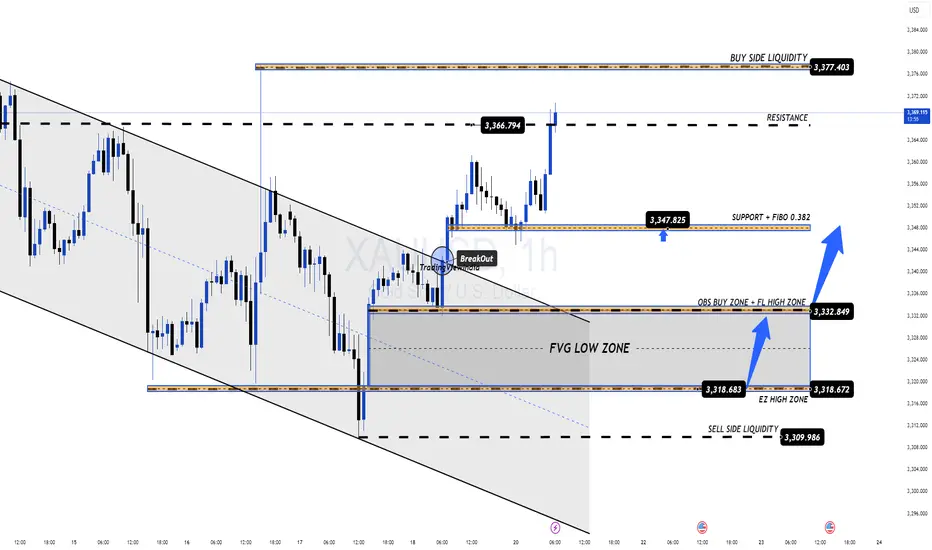
Gold is currently trading within a parallel bullish channel after rebounding from local lows.
However, price is now approaching a key resistance zone around 3342, where we might see either a breakout or a rejection, depending on market sentiment during the upcoming data releases.
🔍 Key Price Zones
🔺 Short-Term Resistance: 3342
🔺 Major Supply Zone: 3369–3388 (Order Block + FVG + Fib 0.5–0.618)
🔻 High-Liquidity Demand Area: 3293–3290
🔻 Deep Demand Zone (FVG): 3275–3273
🔺 Long-Term Resistance Target: 3416
📈 Trade Plan – Based on Price Reaction, Not Prediction
The best trades come from waiting for the right reaction at key zones. No chasing. No guessing.
✅ Scenario 1 – Buy the Dip (Scalp Setup)
Entry: 3293 – 3291
Stop Loss: 3286
Targets: 3296 → 3300 → 3304 → 3308 → 3312 → 3315 → 3320 → 3330
🟢 Works well in high-liquidity zones for quick short-term gains.
✅ Scenario 2 – Buy from Deeper Support (Swing Setup)
Entry: 3275 – 3273
Stop Loss: 3269
Targets: 3280 → 3284 → 3288 → 3292 → 3300 → 3305 → 3310 → 3320 → 3330
🟢 Great setup if price absorbs selling pressure and reverses from FVG demand.
❌ Scenario 3 – Short from Short-Term Resistance
Entry: 3340 – 3342
Stop Loss: 3346
Targets: 3335 → 3330 → 3325 → 3320 → 3310
🔴 Valid only if price fails to reclaim above 3342.
❌ Scenario 4 – Short from Major Supply Zone
Entry: 3369 – 3372
Stop Loss: 3376
Targets: 3365 → 3360 → 3355 → 3350 → 3345 → 3340 → 3330 → 3320
🔴 Higher risk – only act after confirmation (e.g., rejection wicks or bearish candle pattern).
⚠️ Risk Management Tips
Avoid entering right at London or New York opens – too much volatility and false breakouts.
Always wait for confirmation (candle rejection, pin bars, engulfing, etc.).
Use strict stop-loss rules – FOMC + NFP can spike price in both directions.
💡 Final Tips for Indian Traders
Trade with patience – the best setups often appear when others are panicking.
Respect your capital – don’t overleverage during high-volatility news events.
Focus on price action – not emotions or fixed bias.
📌 If you found this gold analysis helpful, feel free to drop your thoughts in the comments or follow for daily updates on XAU/USD.
Let’s grow and trade smarter, one setup at a time.
Namaste 🙏 | Trade safe, trade with clarity.
GOLD: Is This Just the Calm Before a Bigger Move? – GOLD: Is This Just the Calm Before a Bigger Move?
Gold has dropped nearly $50 in the last 4 sessions — showing strong bearish momentum, but is the downside exhausted? Or is this just a pause before continuation?
🔍 Macro Drivers:
Recent US–EU defense and trade agreements have weighed on gold's safe-haven appeal.
Strong US economic data has pushed USD and equities higher, redirecting flows out of precious metals.
Market sentiment is leaning short-term risk-on, which is bearish for gold – but key technical levels are approaching.
📊 Technical Context – H12 Structure:
Price broke below 3,342 key support, retested it and rejected — validating short-term supply zone.
Price is now consolidating between Sell-side liquidity (3,301–3,292) and deeper FVG/OBS zone around 3,270.
Above, multiple sell zones align at Fib 0.5–0.618 retracement with order blocks and fair value gaps.
🔧 Trade Scenarios (Plan for Reaction – Not Prediction):
🟢 BUY SCALP – Quick bounce off demand zone
Entry: 3,292 – 3,290
SL: 3,285
TPs: 3,296 → 3,300 → 3,305 → 3,310 → 3,315 → 3,320 → 3,325 → 3,330
📍Low-risk intraday bounce play from liquidity pocket
🟢 BUY SWING – Deeper test of FVG/OBS zone
Entry: 3,272 – 3,270
SL: 3,265
TPs: 3,276 → 3,280 → 3,284 → 3,288 → 3,292 → 3,294 → 3,300 → open
📍Higher R:R setup if price sweeps final liquidity zone
🔴 SELL SCALP – Rejection from short-term resistance
Entry: 3,340 – 3,342
SL: 3,346
TPs: 3,335 → 3,330 → 3,325 → 3,320 → 3,310
📍Reaction-based trade if price fails to reclaim the zone
🔴 SELL SWING – Deeper pullback into macro zone
Entry: 3,370 – 3,372
SL: 3,376
TPs: 3,365 → 3,360 → 3,355 → 3,350 → 3,345 → 3,340 → 3,330 → 3,320
📍FVG + CP zone overlap with strong OB; ideal for patient sellers
⚠️ Risk Notes:
Watch for false breakouts/liquidity traps near session opens.
Wait for price confirmation; reaction over prediction.
Maintain disciplined risk management – this is a volatile area.
🧭 I’ll be tracking price behavior at these zones closely.
If this approach to mapping price action resonates with you —
Feel free to stay connected or share your bias in the comments.

XAU/USD 1H – Range Consolidation Below Ichimoku Cloud. Chart Review & Technical Insight
1. Ichimoku Cloud & Overall Structure
Price is below the Ichimoku Cloud, with the cloud ahead sloping downward—indicative of bearish short‑term momentum and resistance overhead as long as the cloud holds above price.
The Kijun-sen (blue) line is above the Tenkan-sen (red), reinforcing the bearish bias on this timeframe.
2. Price Action & Key Zones
A support zone around 3,327–3,330 USD/oz is visible, underpinned by multiple rejection taps and price consolidation (“$$$” zone). A clean break below could open the path toward the 3,320’s or lower imbalance region.
On the upside, resistance lies near 3,339–3,340, backed by the cloud’s lower boundary and the Kijun-sen level.
The highlighted green rectangle appears to signal a potential bullish breakout target zone toward 3,365–3,392, contingent on recovery above the cloud.
3. Momentum & Trade Considerations
Momentum is weak, with price moving sideways inside a low‑volatility rectangle on diminishing volume and few directional impulses.
Possible ABC corrective structure is forming as marked, suggesting price may oscillate sideways or continue correcting within established bounds.
A bullish scenario would require clearing the Ichimoku Cloud and resistance at 3,340–3,360 USD.
Conversely, a bearish breakdown below ~3,327 could confirm continuation deeper into the 3,320s or toward the next significant demand zone near 3,300 USD.
✅ Summary
Bias: Slightly bearish to neutral until price can clear the Ichimoku Cloud.
Key Levels to Watch:
Support: 3,327–3,330 (immediate), then 3,320–3,300.
Resistance: 3,339–3,365, cloud top near 3,365, further target zone 3,392.
Scenarios:
Bullish breakout: Close above cloud → potential rally toward 3,365–3,392.
Bearish breakdown: Close below 3,327 → deeper correction toward 3,320 and lower imbalance areas.

Gold (XAU/USD): Supply Zone Rejection & Bearish Breakdown Chart Breakdown:
Supply zone rejection: Gold revisited the “supply zone” (light green/grey area) and failed to break above — a classic signal of seller dominance.
Uptrend invalidated: A sharp rise (steep black trendline) ended with a peak marked by the green arrow, followed by a decisive breakdown.
Ichimoku Cloud test: Prices slipped through the Ichimoku components, reinforcing the shift to bearish sentiment.
Potential targets: The red/green risk‑reward box highlights a short position, targeting ~3,347 then ~3,318 levels (blue labels) as initial support zones.
Strong supply base: The extensive grey zone below marks a "stronger supply zone" — this could cap any modest bounce and keep the downtrend intact.
🔍 Interpretation:
Bias: Bearish — sellers have taken control after a failed breakout.
Strategy: Short on rallies toward the mid‑green/red box (~3,373–3,380), targeting ~3,347 first and then ~3,319. Watch for support at the strong supply region (~3,292) for potential reversal or consolidation.
Risk management: Keep stop above the red zone—above recent highs (~3,380+) to limit risk.
🚀 In a nutshell: After failing to break supply and losing its short‑term uptrend, gold appears poised for a pullback. The next key levels to watch are ~3,347 and ~3,319—where buyers might step back in, or the downtrend continues toward the deeper supply base.

Critical Breakdown: BTC/USD Poised to Fall — Waiting on H4 CloseAnalysis of the BTC/USD 4‑Hour Chart
From the chart you provided, here's how the technical situation looks:
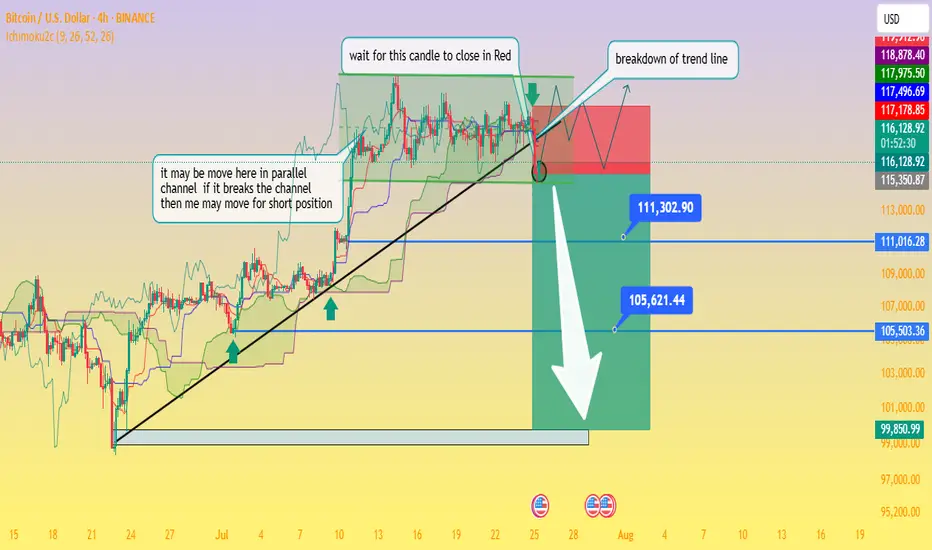
Ascending trendline support has been tested multiple times and was recently breached this afternoon, signaling a possible shift from the bullish setup to a bearish continuation.
The price is now trapped within a descending triangle formation beneath a well‑defined swing high resistance zone. This reflects indecision in the market, with neither buyers nor sellers in clear control
Business Insider
+15
Fxglory Ltd
+15
Bitcoin News
+15
.
Key levels to monitor:
Support zone: ~$115,500, extending down to ~$111,300 and ~$105,600 as deeper targets if bearish momentum strengthens.
Resistance zone: ~$119,000–120,000 area, forming strong overhead supply
Economies.com
DailyForex
Bitcoin News
.
The chart’s annotations align with a classic breakout strategy—with the caveat: wait for a confirmed close below the trendline before considering short positions (as noted in your “wait for this candle to close in red” comment).
Breakout confirmation would likely pave the way toward your indicated profit zones near ~$111k and ~$105k, with a larger potential down to ~$99.8k if further downside pressure builds.
🔍 What the Broader Market Signals
Technical sentiment from sources covering today’s analysis shows BTC/USD hovering just under $120,000, stuck within the defined range of $115.5k support to $120k resistance
Economies.com
.
While there’s still neutral momentum in indicators like RSI and MACD, the short-term direction leans bearish if the breakdown is confirmed on the H4 timeframe
Fxglory Ltd
.
Analysts emphasize that sustained movement above $116.5k could retarget resistance near $119–120k. A failure there and a move below $115.5k may thrust price deeper toward your downside zones
DailyForex
.
✅ Trading Strategy Overview
Scenario Trigger Target Levels
Bearish Breakdown H4 candle closes below trendline ~$115.5k $111.3k → $105.6k → possible $99.8k zone
Bullish Rejection Bounce back above ~$116.5k and trending above resistance $119k–120k retest, potential breakout if sustained
Neutral / Wait-and-see No decisive candle close yet Hold for confirmation
⛳ Final Thoughts
chart highlights a critical point: don’t act prematurely. Wait for a decisive H4 candle close below the trendline before committing to shorts. Confirmed bearish action around the breakout could open the path to the lower targets you identified. However, if price rebounds above support and climbs above $116.5k, a short-term retest of $119k–120k is still in range.
Traders should maintain prudent risk management—watching the unfolding price action around these pivot points without overreaching. Let me know if you'd like help crafting entry/exit zones or risk profiles for this setup!
Gold Tests Key Support – Time to Buy or More Downside Ahead?🌐 Market Overview
Gold remains under pressure following yesterday’s sharp sell-off, driven largely by macro-political tensions and profit-taking at recent highs.
🔻 On July 24th, former President Trump made a surprise visit to the Federal Reserve headquarters — a move interpreted by markets as subtle pressure on the Fed to start cutting rates.
While the Fed hasn’t signaled any immediate easing, short-term bond yields have dipped slightly — reflecting growing rate-cut expectations.
The US Dollar, however, remains firm, showing markets are still hesitant to fully price in a Fed pivot after strong economic data.
📊 Technical Outlook
On the H2 timeframe, gold continues to trade within a broader bullish structure, but price action is now hovering near a critical Keylevel at 3338, aligned with a rising trendline and VPOC zone. A breakdown below this level could open the door for deeper liquidity grabs toward 332x and even 329x.
Volatility is high, and price is moving in wide ranges — ideal conditions for short-term scalp setups.
🎯 Trading Strategy
🔽 Scalp Buy (Short-Term Bounce Opportunity)
Entry: 3338 – 3336
Stop Loss: 3332
Targets: 3342 – 3346 – 3350 – 3354 – 3360 – 3365 – 3370 – 3380
🟢 Buy Zone (Deeper Pullback, Reversal Potential)
Entry: 3312 – 3310
Stop Loss: 3305
Targets: 3316 – 3320 – 3325 – 3330 – 3340 – 3350 – 3360 – 3370 – 3380
🔻 Sell Zone (If Price Retests Resistance)
Entry: 3374 – 3376
Stop Loss: 3380
Targets: 3370 – 3366 – 3360 – 3355 – 3350 – 3340 – 3330
🧭 Key Price Levels
Support: 3350 – 3338 – 3325 – 3310 – 3294
Resistance: 3374 – 3390 – 3400 – 3421
⚠️ Risk Management & Notes
As we head into the weekend, the market is prone to unexpected liquidity sweeps and sharp reversals.
Only consider short-term BUY positions for today. Avoid holding long-term buys until there's confirmation that the lower liquidity zones have been fully swept.
Strictly follow TP/SL discipline to protect capital — especially in volatile, low-news sessions like this.
💬 Enjoying these detailed trade plans?
📈 Follow the MMF TradingView channel for daily market updates, high-probability trade setups, and pro-level insights designed for serious traders.

Gold Pulls Back as Expected, Long-Term Buying Opportunity Ahead🟡 XAUUSD 24/07 – Gold Pulls Back as Expected, Long-Term Buying Opportunity Ahead
🧭 Market Overview
Gold dropped sharply from the 343x area, exactly as anticipated, after breaking the rising channel on the H1 chart and starting to sweep liquidity zones below.
Key factors influencing price action today:
Global markets are awaiting the final outcome of US-EU-China tariff negotiations.
Focus now shifts to next week’s FOMC meeting, where talks of potential rate cuts are intensifying.
Tonight’s PMI and Jobless Claims from the US could introduce unexpected volatility.
📊 Technical Outlook
While the broader trend remains bullish on D1 and H4 timeframes, the short-term H1 chart shows a clear break in structure. Price is currently exploring key FVG zones and OBS levels below.
If these liquidity zones are fully filled, it could set up a highly attractive long-term BUY opportunity, especially as markets price in future Fed rate cuts.
🎯 Today’s Trading Strategy
📌 Short-Term SELL Opportunity
→ Look for early entries at resistance zones, but only with proper confirmation.
📌 Long-Term BUY Setup
→ Target strong technical confluences at deeper levels. Be patient — focus on clean RR setups, don’t rush into early longs.
🔎 Key Price Levels to Watch
🔺 Resistance Zones (Above):
3393 – 3404 – 3414 – 3420 – 3428
🔻 Support Zones (Below):
3375 – 3366 – 3352 – 3345 – 3330
🔽 Trade Scenarios
✅ BUY ZONE: 3352 – 3350
SL: 3345
TP: 3356 → 3360 → 3364 → 3370 → 3375 → 3380 → 3390 → 3400
🔻 SELL ZONE: 3414 – 3416
SL: 3420
TP: 3410 → 3406 → 3400 → 3395 → 3390 → 3380
⚠️ News Alert
Stay cautious with tonight’s US PMI and Jobless Claims releases — these could cause sharp spikes.
✔️ Use proper SL/TP
✔️ Avoid emotional trades
✔️ Let structure confirm before entries
📣 From MMF Team – Trade Smarter Together
If you find this analysis helpful and want more daily trading plans like this:
👉 Follow the MMF channel right here on TradingView — we deliver real, actionable market strategies, not just generic analysis.
🎯 Updated daily. Straight from the charts. Built for traders.

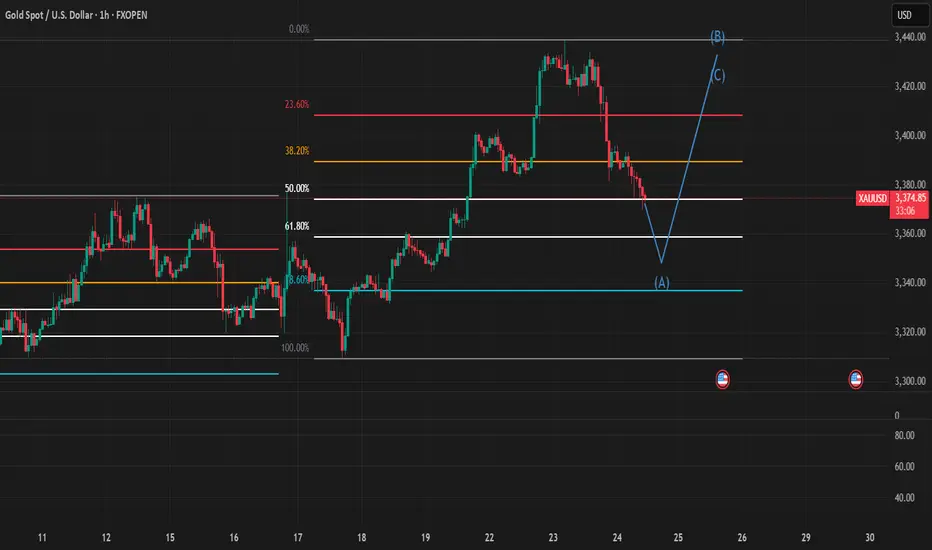
Gold breaks 61.8% Fibonacci retracement level 3358
**Gold Positional Trade Setup:**
If Gold breaks 61.8% Fibonacci retracement level and closes above **3358**, consider initiating a **long position**.
* **Entry:** Above 3358 (after a confirmed close)
* **Target:** 3440
* **Note:** Maintain a proper risk-reward ratio and adhere to your risk management strategy.
---
Watch for a Potential Pullback (July 23) - GOLD PLAN XAUUSD – Is the Bullish Wave Losing Steam? Watch for a Potential Pullback (July 23)
📰 Market Overview
Gold made a strong rally last night, fueled by:
Fed Chair Powell’s speech, which avoided any controversial remarks or hints about stepping down.
Rising geopolitical tensions between the US, China, and the EU, with August 1st looming as a critical deadline.
A dip in US bond yields and the dollar, giving risk assets — including gold — room to rise.
While there’s no major news on today’s calendar, the market could remain volatile within a wide range.
📉 Technical Outlook
Gold seems to be wrapping up its bullish wave as seen on the H4 chart. On the H1 and M30 timeframes, reversal candles are starting to form — an early signal of potential correction.
The short-term support at 3412 – 3410 is the key zone to watch. If that breaks and we get a clean breakdown from the trendline, a deeper pullback could be underway — possibly heading toward liquidity zones lower down.
Two main Fair Value Gap (FVG) areas on H1 are also in play as high-probability liquidity targets.
Down at the 335x region, we have a confluence of FIB 0.618 retracement and historical buying interest — making it an attractive zone for long setups if the price reacts properly.
📌 Trade Setups for Today
🔻 SELL ZONE: 3469 – 3471
Stop Loss: 3475
Take Profits: 3465, 3460, 3455, 3450, 3445, 3440, 3430, 3420
→ Ideal zone to look for bearish setups after a retest.
🔸 BUY SCALP: 3385 – 3383
Stop Loss: 3379
Take Profits: 3390, 3394, 3398, 3402, 3406, 3410
→ Short-term buy for intraday traders catching the pullback.
🔹 LONG-TERM BUY ZONE: 3356 – 3354
Stop Loss: 3350
Take Profits: 3360, 3364, 3368, 3372, 3376, 3380, 3390, 3400
→ This is the deep liquidity zone worth watching for high-conviction buy entries.
⚠️ Risk Reminder
With fewer news catalysts, gold may trap traders by sweeping liquidity in both directions.
Stick to your plan, follow TP/SL strictly, and avoid chasing price. Let the market come to you.
💬 Sometimes the best trade is waiting for the right level. Stay patient, stay sharp.

GOLD - PULLBACKS LIKELY BEFORE CONTINUED UPSIDE - UPTREND INTACTSymbol - XAUUSD
CMP - 3369.50
Gold has been advancing steadily since the start of the trading session, moving toward the 3374 area of interest. Following a breakout above prior consolidation resistance, the metal may now be poised to retest this breakout level before continuing its upward trajectory.
The current rally is supported by heightened trade related risks and a softening US dollar. After briefly declining to 3310, gold resumed its upward momentum, with a key objective at the 3368 resistance level. The recovery is underpinned by ongoing uncertainty surrounding Trump’s trade policy, market anticipation ahead of Powell’s upcoming speech, and broader geopolitical tensions - including trade disputes with the EU, political instability in Japan, and recent criticism of the Federal Reserve from the White House. These factors have prompted a temporary flight to safety, benefiting gold.
From a technical perspective, gold is in a post-breakout realization phase following the consolidation breakout. However, resistance at 3368 has capped further gains for now, and a near-term pullback remains possible. The 3350–3355 support zone is currently in focus. Sustained bullish control above this level could reignite upward momentum and reestablish the breakout continuation.
Key Resistance Levels: 3368, 3374
Key Support Levels: 3345, 3332
The broader market bias remains bullish, bolstered by dollar weakness and persistent risk aversion. Market participants are closely monitoring developments involving Trump and remarks from Powell. Should Powell signal a dovish shift - such as a potential rate cut announcement (e.g. during tomorrow’s 12:30 GMT statement) - gold may extend its gains.

XAUUSD – Gold Intraday Market Outlook (22/07)PLan XAUUSD TRADING BY MMFLOW SYSTEM - 22/07
Gold saw a sharp rally yesterday, completing its bullish wave structure for the day. However, as price approached the key psychological resistance around $3400, we started to see signs of exhaustion, with a clear bearish reversal candle forming at the top. This is the first indication of a possible correction in today’s session.
🔍 Technical Analysis
After forming a short-term top, gold is now entering a retracement phase and has tested a major support area – the FVG High Zone on H1 timeframe. If bearish pressure continues and this zone is broken, price may drop further to seek deeper liquidity zones.
🔽 Buy Zones to Watch Today
✅ Zone 1 – EL (End Liquidity within FVG): 3367 – 3350
→ Historically a strong reaction zone – good for short-term bounce entries.
✅ Zone 2 – Confluence of FIBO 0.5 – 0.618 + VPOC (3350 – 3335)
→ Ideal for long-term buy setups, as this zone overlaps key technical signals and previously saw strong buyer interest.
📌 Trade Setup Suggestions
🔸 BUY ZONE: 3351 – 3349
SL: 3344
TP targets: 3355 – 3360 – 3365 – 3370 – 3375 – 3380 – 3390 – 3400 – ???
🔸 BUY SCALP: 3366 – 3364
SL: 3360
TP: 3370 – 3375 – 3380 – 3385 – 3390
🔻 SELL ZONE: 3420 – 3422
SL: 3427
TP: 3415 – 3410 – 3405 – 3400 – 3390 – 3385
⚠️ Risk Reminder
Although there’s no major economic data today, traders should stay cautious. Unexpected volatility could arise from political developments or central bank commentary. In low-news environments, gold tends to consolidate tightly and then break out aggressively.
🔐 Always use Stop Loss and Take Profit to protect your capital – the market can surprise even the most experienced traders.
📈 Trading Strategy
Short-term bias: Favouring a pullback scenario.
Medium to long-term plan: If price drops deeper into key liquidity zones, that could offer excellent opportunities to load up on long positions, anticipating a strong upside move as the market prices in future Fed rate cuts and gold seeks new all-time highs.
💬 Stay focused, trade with confirmation, and always manage your risk. Patience and discipline will separate you from the crowd.

XAUUSD DAILY UPDATES DATE:22/07/2025XAUUSD retest between 0.5 and 0.618 i can buy this level... otherwise i will wait for confirmation bullish candle at 1hr and 4hr trendline.
This is just an idea not a financial advise, Please manage proper risk management

GOLD PLAN 21/07 – START OF THE WEEK FACES STRONG RESISTANCE GOLD PLAN 21/07 – START OF THE WEEK FACES STRONG RESISTANCE – WAIT FOR CONFIRMATION!
Market Overview:
Gold rebounded swiftly after a minor correction late last week, mainly fueled by ongoing geopolitical tensions. While there are no major economic events scheduled this week, macro headlines and global conflicts will likely drive volatility and direction for gold prices in the coming sessions.
Technical Outlook:
Price is quickly approaching a key resistance zone and may retest the Buy Side Liquidity area around 3377 – 3380.
A short-term reaction from sellers is possible, aiming to fill the Fair Value Gaps (FVG) below.
⚠️ Selling at current levels carries higher risk unless clear reversal signals appear. Patience is key!
Trading Plan for Today:
🔹 BUY ZONE: 3331 – 3329
SL: 3325
TP Targets:
3335 – 3340 – 3344 – 3348 – 3352 – 3358 – 3364 – 3370
🔹 SELL ZONE (risky – confirmation needed): 3377 – 3379
SL: 3383
TP Targets:
3372 – 3368 – 3364 – 3360 – 3350
Key Notes:
The 3347 zone currently acts as short-term support for bulls. If this breaks, gold may slide back to fill lower FVG zones.
Watch closely for volume activity during the London session to confirm intraday bias.
Always respect your SL/TP levels to protect your capital, especially early in the week when volatility can spike unpredictably.
💬 Stay patient, trust the structure, and let price come to your zones. Trading is a game of waiting, not chasing!
Good luck, traders!
GOLD WEEKLY OUTLOOK | JULY 21–25 GOLD WEEKLY OUTLOOK | JULY 21–25
Get Ready for a New Trading Week 🇮🇳
🔍 Market Recap:
Gold showed a strong bullish reversal late last week after sweeping liquidity around the FVG ZONE near 3310. Price quickly surged toward the OBS SELL ZONE around 335x–336x.
By Friday’s close, however, price reacted sharply to a confluence of technical zones (OBS + FIBO) and settled below the VPOC, hinting at a potential short-term top.
📉 Outlook for July 21–25:
📌 No major economic events are lined up next week.
⚠️ However, geopolitical tensions, global trade policies, and military news could bring sudden volatility.
Stay alert for unexpected liquidity spikes!
🧠 Technical Setup – H1 Mid-Term View:
Gold has been forming multiple Fair Value Gaps (FVGs) due to aggressive bullish moves.
While price has reached new highs, lower FVG zones remain unfilled – creating a strong possibility of a retracement.
🔁 Expected Scenario:
We may see price retrace to the 3310–3305 zone to fill these gaps, then potentially resume bullish movement.
📍 Trading Strategy for the Week:
🔸 Wait for price to enter lower FVG zones
🔸 Look for early BUY signals at key confluence areas such as:
CP zones
Fibonacci retracement levels
Volume/price reaction levels
🎯 Bullish Target Zones:
Primary target remains: 333x – 336x
If momentum continues after the pullback, we could see a move toward the Buy Side Liquidity near 3371.749
✅ Key Reminders for Indian Traders:
🚫 Avoid emotional buying at highs (no FOMO!)
📏 Stick to your TP/SL rules – risk management is critical, especially during uncertain global headlines
📊 Stay focused and trade with a plan
🌟 Wishing you a restful weekend. Come back refreshed and ready to dominate the charts next week!
🚀 Good luck & happy trading

18/07 Gold Outlook – Final Friday Liquidity Moves Ahead!🟡 Gold Outlook – Final Friday Liquidity Moves Ahead!
Will Gold maintain its bullish pace or face weekend volatility? Stay ahead of the market!Why Gold is Moving – Key Macro Drivers
Gold bounced back sharply after a dip caused by stronger-than-expected US economic data. Here’s what Indian traders need to keep in mind:
📊 Rate cut hopes remain high as US core inflation remains sticky.
💣 Middle East tensions continue, with Israel launching more airstrikes on Syria.
🌐 Trade war risks increase as EU threatens $84B in tariffs on US goods.
🟡 Gold is acting as a safe haven in times of inflation concerns and global uncertainty.
👉 All of these factors support gold’s upside — especially heading into the weekend when low liquidity can cause price swings.
📉 Technical Picture – Zones in Play
Gold reversed from FLZ H2 (3310) — a key liquidity and demand zone. Sellers took profits, triggering a surge in buy volume. The price has since tested the OBS Sell Zone + Continuation Pattern (CP) around 334x with strong resistance.
Today, we expect price to revisit lower liquidity pools on the M30–H2 timeframe before the next breakout.
🧭 Key Levels for Friday – Watch Closely
✅ Buy Zone: 3318 – 3316
SL: 3312
TP Targets: 3322 – 3326 – 3330 – 3335 – 3340 – 3345 – 3350 – 3360
💼 Scalp Buy Zone: 3326 – 3324
SL: 3320
TP: 3330 – 3335 – 3340 – 3345 – 3350 – 3360
⚠️ Sell Zone: 3363 – 3365
SL: 3370
TP: 3360 – 3355 – 3350 – 3346 – 3342 – 3338 – 3335 – 3330
🔔 Important Notes for Indian Traders
Today is Friday, and even though there’s no major economic news, the risk of liquidity sweeps and volatility is high. Protect your capital with solid risk management and stick to your TP/SL strategy.
📌 Plan your entries from strong technical zones and don’t chase price — let the market come to you.
