XAUUSD – Head & Shoulders Pattern Forming on H4 💛 XAUUSD – Head & Shoulders Pattern Forming on H4 🎯
🌤 Overview
Hello everyone, Lana here again 💬
After a strong drop, Gold is forming a clear Head & Shoulders structure on the H4 timeframe, aligned with the long-term ascending trendline. This pattern suggests the possibility of a bullish move back toward previous highs — but price may still dip lower to complete the structure first.
💹 Technical Analysis (ICT Perspective)
The Left Shoulder – Head – Right Shoulder is gradually shaping around the trendline + supporting FVG.
The upper 50% Fibonacci area is a reasonable zone for the right shoulder to form. If price breaks above the neckline, it may head toward the major liquidity zone around 4200.
In the short term, the 4118–4120 zone serves as resistance + neckline, making it suitable for a technical Sell setup.
The 4040–4042 area aligns with the trendline + Order Block, forming a strong support zone for potential Buy entries if price makes a deeper correction.
🎯 Trading Plan (For Reference Only)
💢 SELL Scenario (scalping at resistance)
Sell: 4118–4120
Stop Loss: 4125
Take Profit: 4105 → 4086 → 4060 → 4040
💖 BUY Scenario (preferred with the main pattern)
Buy: 4042–4040
Stop Loss: 4034
Take Profit: 4075 → 4090 → 4100 → 4140 → 4200
⚠️ Important Notes
Trading based on patterns is always expectation-driven, so combine it with candlestick confirmation on smaller timeframes (M15–M30) before entering.
Upcoming FOMC Meeting and NFP report, especially after the long U.S. government shutdown period, may cause unpredictable volatility.
Reduce position size and avoid holding large trades during major news events.
🌷 Final Thoughts from LanaM2
The H4 Head & Shoulders pattern on Gold is offering attractive opportunities for both short-term Sells and trend-aligned Buys 💛
Stay patient, wait for price to reach the marked zones, follow your stop-loss rules, and avoid FOMO during high-impact news.
If you found this helpful, please 💛 Like – 💬 Comment – 🔔 Follow LanaM2 for daily Gold insights!
Xauusdanalysis

Elliott Wave Analysis – XAUUSD (18 November 2025)1️⃣ Momentum
D1 Timeframe:
D1 momentum is approaching the oversold zone, signaling that a potential reversal may be forming.
Although this does not confirm a daily reversal yet, it is an early warning that bearish momentum may be weakening soon.
H4 Timeframe:
H4 momentum is also nearing the oversold zone, suggesting that a reversal or recovery bounce could appear shortly.
H1 Timeframe:
H1 momentum is beginning to turn upward, indicating that in the short term we can expect a bullish pullback on the H1 timeframe.
________________________________________
2️⃣ Wave Structure
D1 Wave Structure:
Price is currently still moving inside wave Y.
With D1 momentum entering the oversold zone, we do not have a confirmed reversal yet, but it alerts us to the rising probability of one forming soon.
Wave W previously took 8 days to complete. Since momentum cycles often form in 5–8 daily candles, this time structure can be used as a reference when observing the development of wave Y, as waves W and Y tend to share similar timing characteristics.
________________________________________
H4 Wave Structure:
On H4, a 5-wave sequence (blue) has completed, and price is currently in wave 5.
Combined with D1 momentum nearing oversold, this leads to three possible scenarios:
1️⃣ Scenario 1:
This 5-wave decline is wave (1) of a larger 5-wave structure inside purple wave Y.
If so, once wave (5) finishes, we will see a wave (2) pullback, aligning with the upcoming D1 momentum reversal.
2️⃣ Scenario 2:
Wave Y may end earlier than expected, failing to reach the 3746 target.
If this occurs, a new trend could begin sooner, coinciding with the next D1 momentum reversal.
3️⃣ Scenario 3:
D1 momentum enters the oversold zone but remains compressed there, dragging price lower for a deeper extension before any reversal happens.
These three possibilities help guide our chart observation and prepare for multiple outcomes.
________________________________________
H1 Wave Structure:
On H1, price is also forming a 5-wave decline (blue) and is currently in wave 5.
The projected target for wave 5 is around 3958, which is where we expect a Buy setup.
Additionally, RSI is showing bullish divergence across the lows, reinforcing the probability that price is completing wave 5 and preparing for a short-term bounce.
________________________________________
3️⃣ Trade Plan
• Buy Zone: 3959 – 3957
• Stop Loss: 3938
• TP1: 4000
• TP2: 4096
• TP3: 4145

Current Market Structure & Key Observations Previous Trend: The Current Market Structure & Key Observations
Previous Trend: The chart shows a strong uptrend from late October, peaking around November 14th at approximately $4,400. This peak marked a significant reversal.
Correction/Reversal: Since the peak, the price has undergone a sharp downward correction or potential reversal.
Trendline Interaction: The price has recently fallen to and is currently interacting with a major long-term ascending trendline (the solid black line).
Current Price: The price is hovering right at the trendline, indicated by the dashed pink line at approximately $4,034.
Analysis of the Projected Path (Red Lines)
The red lines drawn on the chart suggest a specific bearish scenario:
Trendline Break and Retest: The price is shown to break below the ascending trendline. This is a critical technical signal, often indicating the end of the uptrend and the start of a downtrend.
Pullback/Retest: The price then executes a pullback back up to the broken trendline (now acting as a resistance level). The projected high for this pullback is around $4,060.
Bearish Continuation: After failing to break back above the trendline, the price is projected to continue its decline, heading towards the area of $3,900 and then possibly $3,850 in the following days.
Potential Scenarios (Alternative View)
While the red lines illustrate a clear bearish path, it's important to consider an alternative:
Scenario 1: Bearish Continuation (As Projected)
Action: If the price confirms a breakout below the trendline (closes below it on multiple candles), the trendline turns into resistance.
Target: The focus shifts to lower support levels, with initial targets around $3,900 - $3,850. This confirms the end of the recent uptrend.
Scenario 2: Trendline Hold/Bounce
Action: If the trendline acts as strong support and the price fails to close significantly below it, it could lead to a bounce.
Target: A bounce would target the previous swing high before the major drop, potentially aiming back toward $4,150. This would maintain the longer-term bullish structure.

GOLD H1 – Hawkish Fed Pressure Ahead of Key NFP Data🟡 XAUUSD – Intraday Smart Money Plan | by Ryan_TitanTrader (18/11)
📈 Market Context
Gold is trading inside a bearish corrective channel as markets react to hawkish Federal Reserve commentary and positioning ahead of this week’s U.S. NFP data.
• Fed officials signaled a stronger stance against premature rate cuts, keeping USD supported and limiting gold’s upside.
• Price continues to hover near $4,080, reflecting uncertainty as traders balance Fed tone with upcoming labour-market reports.
Institutional order flow shows controlled downside pressure, with engineered liquidity sweeps forming around both channel extremes.
🔎 Technical Analysis (1H / SMC Structure)
• Structure: Price remains inside a Bearish Correction Channel, creating consecutive BOS points, confirming distribution.
• Premium Sell Zone: 4107–4105 aligns with a previous mitigation block + internal liquidity.
• Discount Buy Zone: 3983–3985 sits at the lower boundary of the channel + liquidity sweep zone.
• Liquidity:
→ Buy-side liquidity above 4107 (clean equal-high pocket).
→ Sell-side liquidity resting around 3985–3976, where prior long positions were removed.
🔴 Sell Setup (Premium Reaction Zone)
• Entry: 4,107 – 4,105
• Stop-Loss: 4,117
• Take-Profit Targets:
→ 4,060 (minor imbalance fill)
→ 4,030 (BOS retest)
→ 3,985 (discount zone)
📌 Execute only after a liquidity sweep into the zone + bearish BOS on M5–M15.
🟢 Buy Setup (Discount Reaction Zone)
• Entry: 3,983 – 3,985
• Stop-Loss: 3,976
• Take-Profit Targets:
→ 4,030 (short-term structure high)
→ 4,060 (inefficiency midpoint)
→ 4,105 (premium retest)
📌 Valid if price taps channel low + shows bullish displacement.
⚠️ Risk Management Notes
• Expect volatility as markets digest hawkish Fed remarks before NFP.
• Avoid entering trades inside the 4020–4070 chop region without clear BOS.
• Reduce position size during news hours.
• Trail stops once price clears each liquidity pocket.
📝 Summary
Gold remains pressured by Fed rhetoric, but liquidity is building at both extremes.
• Sell Zone: 4107–4105 (premium mitigation area)
• Buy Zone: 3983–3985 (discount liquidity sweep)
Price is likely to form a manipulation → reaction → continuation pattern within the channel.
📍 Follow @Ryan_TitanTrader for more Smart Money updates ⚡
🎁 More insights & gifts on my TradingView profile.

GOLD (XAU/USD): THE BATTLE OF NFP AND FED!1️⃣ TECHNICAL VIEW (TA): Awaiting Sell Confirmation
Structure: The short-term uptrend has ended, prices are adjusting/reversing.
Main Supply Zone (Order Block - OB): Prices are retracing to the ideal sell zone (around $4,064 - $4,081).
Strategy: Prioritise seeking SELL signals at the OB zone.
Target: $3,976 and $3,931 if the OB zone holds.
2️⃣ FUNDAMENTAL VIEW (FA): Interest Rate Pressure
Selling pressure is increasing from:**
Fed Rate Cut Expectations Dwindle: The probability of a 25bps rate cut in December has fallen below 50%. The "Higher for Longer" signal reduces Gold's appeal.
Upcoming Risks: The market awaits NFP and FOMC Minutes. Strong data will bolster USD and sink Gold.
⚠️ Opposing risk: Uncertainty from the US Government shutdown and geopolitical tensions (Russia/Ukraine) may restrain the decline.
#XAUUSD #Gold #TradingSetup #SELLZone #Fed #NFP #PriceAction #SmartMoneyConcepts #Forex

OVERVIEW FOR TODAY - CHART H1 OVERVIEW
Price is currently sitting inside the POC zone – the area with the highest traded volume → the market usually consolidates here before choosing a direction.
Prior trend: Strong uptrend → distribution → correction.
The ascending trendline has been broken → short-term trend is bearish (downtrend).
Volume Profile shows the VAH above as strong resistance, and VAL below as strong support.
1: Price bounces from POC → moves up toward VAH (medium probability)
Conditions:
Price holds above the POC zone (~4000–4010).
Bullish price action appears (pin bar, engulfing, break of structure on H4).
Targets:
4120–4160 (VAH zone) → this is major resistance.
If VAH breaks → trend may resume upward with a larger target around 4300+.
Assessment:
Possible, but not the highest probability, because recent bearish momentum is still strong.
2: Price breaks below POC → retest → drops to VAL (HIGHEST PROBABILITY)
Current candles show strong rejection from VAH → falling directly into POC → bearish confirmation.
If D1 closes below the POC:
Bearish continuation becomes likely.
Targets:
3920–3950 (VAL zone) → very strong support.
Volume Profile thins out here → price tends to move quickly through this area.
Assessment:
This is the most likely scenario because:
✔ Trendline is broken.
✔ Weak bullish reaction at VAH.
✔ Volume Profile structure favors a move downward into VAL.
3: Price breaks below VAL → deeper drop toward Demand zone (low probability but dangerous)
Conditions:
D1 closes below 3920 (VAL)
Breaks the horizontal support.
Deep Targets:
3550–3600 (major Demand zone).
This is where the longer-term uptrend may recover.
Assessment:
Low probability, but if triggered → gold will make a sharp correction.
FINAL CONCLUSION
Highest probability: BEARISH continuation → drop toward VAL zone (3920–3950)
Because:
Strong rejection from VAH
Price sitting weakly on POC
Short-term structure turning bearish
[bTrading Suggestions
For short setups:
Look to sell on a retest of POC (4000–4010).
SL above VAH (4060–4080).
TP at VAL.
For long setups:
Only buy at VAL zone when clear reversals appear (pin bar, engulfing).
Avoid buying between POC → VAL.
⚠️ Disclaimer
All analyses and insights provided in this content are for informational purposes only and should not be considered financial advice. The financial market carries inherent risks, and every trader is fully responsible for their own decisions. Trade with a plan, discipline, and proper risk management.

Pressured Below 4050$ as Bears Target the 4,000$ Liquidity BreakGold continues to trade under heavy selling pressure, staying capped beneath 4,050$ and hovering just above the major liquidity floor at 4,000$.
With fading expectations for a December Fed cut and cautious global sentiment, buyers remain defensive while sellers maintain structural control.
📊 Technical Outlook (H1)
Price remains inside a tight 4,053$ → 4,000$ distribution zone, with the descending trendline keeping gold suppressed.
The POC around 4,053$ is acting as a firm ceiling; every retest so far has been rejected.
Fibonacci projections from the last drop highlight two major downside liquidity zones:
3,945$ → first liquidity cluster
3,876$ → deeper extension and key demand
Current structure resembles a bear flag, hinting that the market may be preparing for another downside expansion.
🎯 Key Scenarios
1️⃣ Bearish Breakdown (Primary Scenario)
If gold loses 4,000$, expect momentum to accelerate into:
3,945$
3,876$
This remains the most probable path while price holds below 4,053$.
2️⃣ Liquidity Sweep → Short-Covering Bounce
If price sweeps 3,945$ and forms bullish rejection wicks:
A relief bounce could develop back toward 4,000$,
Then 4,053$ (POC)
And possibly 4,098$ if buyers gain traction.
Still a corrective move unless bulls reclaim the upper structure.
❌ Invalidation (Bearish Bias Weakens)
H4 acceptance above 4,098$
→ would shift the narrative and force a reassessment of trend direction.
⚜️ MMFLOW TRADING Insight
Gold is still trading below value and below the trendline — this is not a bullish environment yet.
The market must either break 4,000$ or reclaim 4,053$–4,098$ before any stronger directional conviction returns.
“Let the market show its hand. In a downtrend, weak rallies are opportunities — not reversals.”

LiamTrading – XAUUSD H1 | Gold on a downward trend, hitting ...💛 LiamTrading – XAUUSD H1 | Gold on a downward trend, hitting strong support around 4005 🎯
Gold has plunged from its peak, currently “visiting” the 4005–3990 zone, where trendline + POC/OB + high liquidity converge. This is a zone where a technical rebound might occur, but the short-term trend remains bearish, so any BUY orders need to wait for clear confirmation.
🔍 Fundamental Analysis
Goldman Sachs forecasts that during 2025–2026, central banks will purchase an average of ~80 tons of gold per month, a significant driver that could push gold towards 4,900 USD/oz by the end of 2026.
This keeps the long-term trend of gold bullish, but in the short term, deep corrections like the current one are normal to “shake off” positions before big money returns.
📊 Technical Analysis
Current trend:
H1 is still in a short-term downtrend phase (lower high – lower low), with prices below the 4080–4100 resistance zone and below the nearest descending trendline.
Main support zones:
4005–3990: intersection of long-term rising trendline, POC – OB, old VAH/VAL zone → crucial support, potential for bottom-fishing buying force.
3975–3977: deeper support, coinciding with liquidity zone & recent low.
Key resistance zones:
4098–4100: confluence of resistance + trendline test → ideal zone to watch for SELL retracement.
Above is the cluster 4011 – 4053 – 4077 – 4098–4100 acting like “steps” for scalping orders.
Volume Profile:
Heavy trading volume around the 4000–4020 zone → prices tend to revisit this area multiple times before moving away.
🎯 Reference Trading Scenarios
SELL – following the downtrend (priority)
Entry: 4098–4100
SL: 4105
TP: 4082 → 4060 → 4035 → 4012
Price retraces to resistance + descending trendline.
Only trigger when M15–H1 shows clear rejection candles (pin bar/bearish engulfing) around 4098–4100.
BUY – catching the rebound at strong support
Entry: 3975–3977
SL: 3970
TP: 3995 → 4025 → 4050 → 4080
Confluence support zone at channel bottom + POC/OB + liquidity.
Only BUY when there is strong rejection or a clear reversal pattern (M15–H1).
⚠️ Price zones to watch for scalping
4011 – 4053 – 4077 – 3939
These zones are suitable for short scalps, prioritising the main trend (currently bearish), quick exits – do not hold positions too long.
🧠 Risks & Invalidations
H1 closes above 4105 → reduces SELL priority, wait for new structure.
H1 closes below 3970 → bad structure for BUY side, potential for further decline to lower zones.
Are you watching to BUY or SELL gold in this zone?
👉 Comment your perspective & Follow LiamTrading channel for daily XAUUSD plans.

XAUUSD – TWO MAIN SCENARIOS FOR THE DAY: MONITOR REACTION AT...💛 XAUUSD – TWO MAIN SCENARIOS FOR THE DAY: MONITOR REACTION AT TRENDLINE 🎯
🌤 1. Overview
Hello everyone 💬
Gold is currently waiting at the H4 trendline, indicating the market is lacking volume to decide the next direction.
Although the price is adjusting after the drop from the 4,400 USD zone, the larger trend is still supported by strong buying flows from central banks.
💹 Market Context
According to Goldman Sachs, the current decline is only temporary, as the demand for gold as a safe haven asset remains strong:
US bond yields are falling
USD is weakening
The US economy is under pressure from unemployment and inflation
In September alone, central banks purchased 64 tonnes of gold, and forecasts suggest that November may continue this strong accumulation trend.
💹 Technical Analysis
📉 If Gold breaks below the trendline → the market will trigger strong selling pressure, pulling back to the 395x zone, where there is low liquidity and important support.
📈 Conversely, if the price holds the trendline and volume pushes up, a short-term upward structure will form.
📌 The 4068 zone is a key level — if the price retests this area and falls back, Buy will only activate when it reaches 4034.
🎯 Reference Trading Scenarios
🔻 SELL – When breaking the trendline (priority if volume is strong)
Sell 4036–4038 │ SL: 4044
TP: 4010 → 3995 → 3970 → 3945
🔹 BUY – Strong support 395x
Buy 3952–3954 │ SL: 3957
TP: 3975 → 3995 → 4030
🔸 BUY maintaining trend (if price rebounds at 4068)
Buy at 4034 after confirmation signal
⚠️ Important Note
Volume is currently low, making the market prone to stop sweeps, so enter orders with small volume.
The larger trend is still supported by flows from central banks, but in the short term, Gold may fluctuate strongly around the trendline.
Prioritize trading based on price reactions at key zones rather than predicting direction in advance.
🌷Gold is in a sensitive phase at the H4 trendline 💛
If you find this useful, please 💛 Like – 💬 Comment – 🔔 Follow LanaM2 to receive daily gold analysis ✨

WILL GOLD CONTINUE TO DROP?1. Market Context Yesterday, gold was almost in accumulation throughout the Asian–European session and only broke out strongly in the latter half of the US session.
After breaking out of the accumulation zone, the price dropped sharply around 4006 – a crucial key level – and surged strongly from there.
However, statements from FED members remain hawkish, affirming the stance of keeping interest rates high for longer and not considering rate cuts yet.
This creates
-Downward pressure on gold
-Cash flow leaning towards USD
------>>Market sentiment prioritises SELL on price recovery
➡️ Conclusion: Today, the main scenario remains SELL following the trend, BUY is only a secondary strategy & short scalp when reaching strong support.
🎯2. Today's Trading Scenario
(SL: 10 points TP 10 points. RR ratio:1-2/1:3/1:5)
🔻 Main SELL (priority)
SELL Zones:
4050 – 4055
4075 – 4080
4105 – 4110
🟦 Secondary BUY
BUY Zones:
3996 – 3994
3965 – 3960
3935 – 3930
3895 – 3890

GOLD H1 – Will Retail Sales Trigger Gold’s Next Big Move?🟡 XAUUSD – Intraday Smart Money Plan | by Ryan_TitanTrader (17/11)
📈 Market Context
Gold is trading inside a corrective phase as markets anticipate today’s U.S. Retail Sales data and several Fed speeches — both crucial for assessing whether inflation momentum is slowing or rebounding.
• Weak retail numbers may hint at cooling consumer strength, supporting safe-haven bids in gold.
• Strong data could revive USD demand, prompting sell-side setups from premium zones.
Institutional flows show engineered pushes into inefficiency before a directional leg unfolds.
🔎 Technical Analysis (1H / SMC Structure)
• Structure: Gold is forming a short-term accumulation at the discount range after consecutive bearish candles and a deep liquidity sweep below 4030.
• FVG Sell Zone: 4140–4138 aligns with an unmitigated FVG + internal liquidity — ideal for sell-side reactions.
• Discount Zone: 4008–4010 is the last clean demand zone + sweep area, matching the chart’s projected bullish inducement.
• Liquidity:
→ Buy-side liquidity rests above 4140.
→ Sell-side liquidity remains exposed near 4000–3995.
🔴 Sell Setup (Premium Reaction Zone)
• Entry: 4,140 – 4,138
• Stop-Loss: 4,150
• Take-Profit Targets:
→ 4,095 (intra-day imbalance fill)
→ 4,060 (previous BOS block)
→ 4,010 (discount accumulation area)
📌 Trade only after a liquidity sweep into FVG + bearish BOS on M5–M15.
🟢 Buy Setup (Discount Reaction Zone)
• Entry: 4,010 – 4,008
• Stop-Loss: 4,000
• Take-Profit Targets:
→ 4,060 (short-term structure high)
→ 4,095 (mid-range inefficiency)
→ 4,138 (final premium reaction zone)
📌 Valid if price sweeps 4008 and shows bullish BOS + displacement.
⚠️ Risk Management Notes
• Expect volatility during the U.S. Retail Sales release.
• Avoid chasing price inside the 4060–4100 chop region.
• Lock profits at each liquidity level and trail stops.
• Keep total risk under 1–2% per setup.
📝 Summary
Gold remains in a engineered pullback phase with clear liquidity pockets at both extremes.
• Sell Zone: 4140–4138 (FVG / premium reaction zone)
• Buy Zone: 4008–4010 (discount accumulation zone)
A clean manipulation–reaction–continuation pattern is likely before the next intraday move.
📍 Follow @Ryan_TitanTrader for more Smart Money updates ⚡
Check out my TradingView profile for special gifts 🎁

XAUUSD Bearish Breakout Setup from Ascending Triangle Retest1. Market Structure
The chart shows a strong downtrend, followed by a Break of Structure (BOS) to the downside.
After BOS, price formed a corrective ascending structure (an ascending triangle / rising wedge).
2. Current Pattern
Price is moving upward in a corrective manner, showing lower bullish strength.
The ascending trendline is acting as temporary support.
The horizontal resistance at the top of the triangle reflects slowing bullish momentum.
3. Short Entry Logic
The marked point (yellow circle) shows price tapping the ascending trendline.
The red arrow indicates entry short, expecting a breakdown from this rising structure.
This matches the logic:
✔ Downtrend
✔ BOS
✔ Weak bullish correction
✔ Short at trendline retest before a bearish continuation
4. Target Expectation
The “TARGET” label points upward, but based on context this seems contradictory.
Given BOS and corrective rise, the logical target is downward, toward previous liquidity levels or lows.
The triangle breakout normally aligns with continuation of the previous trend, which is bearish.
5. Trade Bias
Bias: Bearish
Reason: Structural break + corrective pullback + rising wedge = continuation pattern.
6. Risk Considerations
Stop-loss usually goes above the most recent swing high inside the correction.
Watch for any strong bullish candle breaking above the ascending structure — that invalidates the setup.

XAU/USD TRADING PLAN 17/11/20251️⃣ CONTEXT
Last Friday saw a drop of ~200 points → confirming strong selling pressure.
No major news today, expected movement:
Wide sideways 4030–4120
Sell bias (priority to sell at high zones)
The major trend remains in a down channel, any rise is mainly for unloading.
2️⃣ GENERAL RULES
SL: 10 points for all trades
TP: 10 points for all trades
3️⃣ SELL ZONES (PRIMARY)
4120–4125
4146–4148
4160–4165
4182–4185
4210–4215 (strongest resistance of the day)
4️⃣ BUY ZONES (RETRACEMENT)
4056–4050
4033–4030
3996–3994
3966
3888
5️⃣ SUMMARY
Bias: Sideways → priority to Sell.
Sell at resistance zones, Buy at strong support zones.
SL/TP adjusted according to RR ratio 1:1, 1:2
Pay attention to appropriate volume

XAU/USD – Rebalancing Structure, Support Zone Holding Steady⏰ Timeframe: 30m
📅 Update: 17/11/2025
🔍 Market Context
After the extended decline late last week, gold is gradually stabilizing around the 4,050–4,080 USD zone, showing a positive reaction at the structural support zone.
The recent Break of Structure (BOS) sequence indicates that the selling momentum is gradually weakening, while the newly formed Order Block is acting as a temporary balance for the market.
The current structure slightly leans towards a technical recovery, as buying flows are returning around the main support zone.
📊 Technical Structure
Support Zone (4,049–4,080 USD): a critical support zone, confluencing with the previous liquidity bottom.
Order Block (4,096–4,115 USD): a short-term supply-demand area, potentially a retest point before the price expands higher.
Resistance Zone (4,145 USD): the first intermediate level to overcome to confirm upward momentum.
Target Zone (4,210 USD): the upper liquidity zone, corresponding to the potential expansion mark of the recovery wave.
🎯 Market Outlook
Priority scenario for the day:
1️⃣ Gold may retest the Order Block zone 4,096–4,115 USD before forming the first push up to 4,145 USD.
2️⃣ If buying pressure is maintained and this resistance zone is broken, the expansion momentum may head towards 4,210 USD, corresponding to a higher liquidity zone.
3️⃣ Losing the 4,049 USD mark will invalidate the recovery structure and bring the market back to a lower balance zone.
🧠 Analyst’s View
The market is currently in a reaccumulation phase after a strong correction.
Buyers still maintain a technical advantage as long as the price remains above the 4,049 USD support zone.
Observing price behavior around the Order Block and the 4,145 USD zone will be key signals to confirm the strength of this recovery wave.
🛡️ Risk Note
The current phase is a “pullback phase” within the larger structure.
Traders should wait for clear price behavior confirmation at technical zones rather than predicting movements in advance.

Gold Technical Rebound to FVG, Prioritise WATCHING FOR SELL at 4📊 Market Structure
Gold has completed a strong decline from the peak of 4.21x, leaving consecutive Break of Structure (BoS), confirming a short-term bearish structure.
The drop through the Breakout zone of 4.10x indicates a dominant selling force.
Currently, the price is bouncing from the Premium Zone 4.05x, aligning with the technical rebound behaviour after a strong sell-off.
The BUY side is merely pulling the price back to the abandoned liquidity zones (FVG 4.12x – 4.15x) before the SELL side can regain control.
The upper FVG zone is where the price often returns to fill after a steep fall. This is also the confluence zone between:
FVG (Fair Value Gap)
Old candle body Breaker
Fibonacci Premium
→ The risk of selling at these zones is very high.
💎 Key Technical Zones
Rebound zone for Sell
FVG 1: 4.101 – 4.126
FVG 2 (Strong Confluence): 4.126 – 4.150
Support zone – target to hit
Premium Zone $$$: 4.050 – 4.052
Lower FVG: 4.030 – 4.035
High probability price scenario: Rebound to FVG → reaction → continue to decline to 4.03x.
🎯 Trading Plan – Prioritise SELL
1️⃣ SELL Setup – High Probability
Wait for price to rebound to the above FVG zones:
Entry SELL:
4.118 – 4.126
Can add orders at higher: 4.140 – 4.150
Stop-loss: above 4.158
TP1: 4.101
TP2: 4.050
TP3: 4.030
✔️ This is a trend-following setup, selling at premium, adhering to SMC principles.
✔️ The current price is just beginning the rebound, not yet meeting BUY conditions.
2️⃣ BUY Setup – Only activate on deep Discount
Entry BUY: 4.030 – 4.035 (Lower FVG)
SL: below 4.020
TP: 4.070 – 4.100
→ BUY is only for counter-trend traders and must wait for a clear discount.
🧠 Vincent’s View
The market is in a distribution – decline phase, every rebound aims to pull liquidity.
As long as the price does not close above 4.150, SELL remains the optimal strategy for the day.
Observe closely when the price hits 4.12x – 4.15x, this is a “high-risk” zone for the BUY side and a “great opportunity” for the SELL side.
“Sell where the liquidity lives — that’s where institutions strike.” ⚜️
⏰ Timeframe: 1H
📅 Update: 17/11/2025
✍️ Analysis by: Captain Vincent

GOLD (XAU/USD): 2 Crucial Orders Before the NFP Storm!📉 Technical Analysis (SMC - 2H)
Trend: Decline after a clear MSS/BOS.
Focus: Price is retracing to the Selling Zone (Premium) to fill the FVG.
⚔️ Detailed Trading Plan (R:R > 1:2)
1. Priority Strategy: SELL Limit (Trend Following)
Entry: 4,157.782 (FVG Peak - Supply Zone)
Stop Loss (SL): 4,206.895 (Safe SL above the nearest structural peak)
Take Profit 2 (TP2): 4,051.733 (Main structural target - Nearest bottom)
Objective: Participate in the ongoing price decline.
2. Counter-trend Strategy: BUY Limit (Technical Rebound)
Entry: 4,051.733 (Nearest structural bottom - Support)
Stop Loss (SL): 4,018.699 (SL below lower FVG)
Take Profit 2 (TP2): 4,126.333 (Rebound to the upper FVG bottom)
Objective: Capitalise on the technical rebound from strong support.
🚨 Basic Risk: This Week's Focus
Hawkish Fed: Officials like Schmid assert high inflation, unwilling to ease policy, maintaining high interest rates (Negative for Gold).
Major News: FOMC Minutes (Wednesday) and especially NFP (Thursday) will determine the short-term momentum of USD/Gold.
Risk Management: Gold will be highly volatile from Wednesday. Adhere to SL and manage capital under 2% per order.
#Gold #XAUUSD #Forex #TechnicalAnalysis #FVG #SmartMoney #Fed #NFP #TradingView

XAUUSD – UPDATE ON SCENARIO AFTER WEEKLY OPEN💛 XAUUSD – UPDATE ON SCENARIO AFTER WEEKLY OPEN 🎯
🌤 Overview
Hello everyone 💬
Gold prices at the start of the week are mostly unchanged, the price structure on H4 remains the same, so Lana continues to maintain the old trading strategy.
Currently, gold is weakly reacting around the medium-term resistance area, not strong enough to break through – but also no clear reversal signals.
💹 Technical Analysis
📉 Prices are moving within a narrow range between key liquidity zones:
Zone 4138–4140 is the near resistance, where the market has repeatedly reacted with declines.
Zone 4200 coincides with confluence fibo + descending trendline – strong resistance.
Zone 3990–3988 is important support, also a lower liquidity area, suitable for technical rebound Buy.
Market liquidity is weak, as shown by the pin bars and narrowing range.
🎯 Reference Trading Plan
💢 SELL (priority on correction rhythm)
4138–4140 | SL: 4146 | TP: 4120 → 4105 → 4089
4200 | SL: 4212 | TP: 4185 → 4160 → 4133
💖 BUY (strong support)
3990–3988 | SL: 3984 | TP: 4002 → 4032 → 4060
⚠️ Market Insight (Macro Insight)
Gold declines simultaneously with US stocks and Bitcoin, indicating a lack of liquidity across the market.
This behaviour is common during phases like:
Financial Crisis 2008
Early pandemic panic 2020
Investors are forced to sell even profitable assets to cover losses, causing gold – despite being a safe haven asset – to also decline. This reflects a strong increase in cash demand and widespread fear.
🌷 Conclusion with LanaM2
Gold is moving within a tight range and is heavily dependent on liquidity 💛
If you find this useful, please 💛 Like – 💬 Comment – 🔔 Follow LanaM2 for daily gold analysis ✨

Gold Still in Distribution, FOCUS ON SELL Setups at 4,10x–4,14x 🔍 Market Context
Risk sentiment remains fragile as investors reassess the global rate and stimulus story.
Goldman Sachs notes that rising worries about the size of Japan’s fiscal stimulus are bringing financial risk premia back, putting pressure on long-term JGBs and the JPY. Capital tends to rotate into USD and yield-bearing assets in this environment, which limits the upside for gold in the short term.
📊 XAU/USD Technical Structure (H1)
After topping around 4,242 USD, gold broke its short-term uptrend and is now moving in a descending structure.
Price is currently capped below the 0.5–0.382 Fibonacci area around 4,11x, which overlaps with a strong supply / Sell Liquidity zone on the chart.
Below price, we have a series of liquidity / support pockets:
4,098 – 4,077 – 4,048 USD: short-term downside liquidity levels.
OBS BUY ZONE around 4,00x: major demand zone where price previously launched a strong rally.
Current price action shows sellers still in control – every bounce into 4,10x–4,14x is being rejected quickly, which fits a “sell the rally” approach.
🎯 Trend-Following Trade Ideas (for reference)
Zones below are technical areas to watch, not signals or financial advice.
Scenario 1 – Shallow Pullback Sell
Sell Zone 1: 4,102 – 4,104
SL: 4,110
TP levels:
TP1: 4,098
TP2: 4,077
TP3: 4,048
Idea: Price makes a minor intraday pullback into local supply, then resumes selling pressure toward lower liquidity pockets.
Scenario 2 – Deeper Pullback into Fib/Trendline Confluence
Sell Zone 2: 4,142 – 4,144
(confluence of descending trendline + Fibonacci combo)
SL: 4,150
TP levels:
TP1: 4,133
TP2: 4,105
TP3: 4,088
TP4: 4,060
Idea: If the market grabs more upside liquidity first, the 4,14x zone offers a better R:R area to align with the H1 downtrend.
⚜️ MMFLOW TRADING View
As long as price stays below 4,14x and H1 structure keeps printing lower highs, gold remains in a distribution phase.
Pullbacks into the 4,10x–4,14x liquidity band are treated as opportunities to optimize SELL entries, while the 4,00x OBS BUY ZONE is the key area to reassess any potential larger bottoming process.
“In a downtrend, our job isn’t to call the bottom – it’s to use every weak bounce to sell from a better position.”
Elliott Wave Analysis – XAUUSD (Week 3, November)
1. Momentum
W1 Timeframe
W1 momentum is preparing to turn upward. This suggests that within 1–2 weeks, weekly momentum may reverse, potentially starting a medium-term bullish phase lasting 4–5 weeks. It also signals that the current bearish trend may weaken next week.
D1 Timeframe
D1 momentum has already turned downward, so the primary expectation for next week remains bearish.
H4 Timeframe
H4 momentum is turning upward, meaning that on Monday we may see a corrective bounce or sideways movement before the downtrend resumes.
________________________________________
2. Wave Structure – W1
Price is still in a corrective phase, likely forming wave 4 of the larger cycle.
This wave count remains valid as long as price closes above 3746.
If price closes below 3746, the entire structure must be reassessed.
________________________________________
3. Wave Structure – D1
Wave 4 is unfolding as a W–X–Y (purple) combination.
Friday’s strong decline confirms that D1 momentum has reversed downward, suggesting that purple wave X is complete and price is now developing purple wave Y.
Targets for Wave Y (purple):
• Target 1: Equal to wave W → 3746
• Target 2: 1.618 × W, a very deep zone
o If price reaches this deeper zone, the structure may no longer represent yellow wave 4, and the count must be re-evaluated.
________________________________________
4. Wave Structure – H4
With Friday’s sharp decline, waves (1) and (2) in blue are temporarily labeled.
The decline is steep, clean, and non-overlapping — all characteristics of a 5-wave impulsive structure, supporting the expectation that purple wave Y will also unfold as a 5-wave decline rather than a triangle. Further confirmation is needed next week.
Given the target at 3746, wave (3) is expected to extend. The current pullback remains valid as long as price does not exceed 4211, which still fits as wave 2 within wave (3).
________________________________________
5. Monday Pullback Zones
H4 momentum indicates a likely bullish correction early next week. Two key resistance zones:
Zone 1 – 4096
“This zone aligns with the 0.382 retracement from blue wave (2) to the current low at 4046. It is also an ideal wave (4) zone if price peaks here before continuing downward.”
Zone 2 – 4145
“This level corresponds to the previous wave (1) in blue. If price reaches this zone, the pullback may represent wave 2 within wave (3). I will update this scenario in more detail on Monday.”
________________________________________
6. Conclusion
The main trend remains bearish.
I expect price to reach the 3746 target for purple wave Y next week, aligning with the projected timing shown by the two vertical blue lines on the H4 chart, while D1 momentum moves into oversold territory.
When price reaches this zone and W1 momentum fully turns upward, it may signal the beginning of a new medium-term bullish trend.

BTCUSD 45m – Pennant Breakout Setup Toward 100k Target1. Pattern Formation: Bullish Pennant
The chart shows a pennant, formed after a sharp downward move followed by price compression.
The upper trendline is descending, the lower trendline ascending, converging into a tightening triangle.
This is typically a continuation pattern, but because the preceding move was downward, traders will often wait for confirmation from the breakout direction.
2. Breakout Attempt
The price is breaking slightly above the upper trendline, marked as ENTRY.
This suggests a potential bullish breakout, but:
The breakout candle is still small.
Ideally, you’d want volume confirmation (not shown in the image).
3. Stop-Loss Placement
The STOP LOSS is placed safely under:
The lower pennant trendline
Recent consolidation lows
This gives a logical invalidation level—if price drops below this, the breakout has failed.
4. Target Projection
The target of $100,006 is consistent with a measured move calculation:
Height of the initial impulse (the pole)
Added to the breakout point
On your chart, the projected move equals about +10%, also labeled on the right.
5. Risk–Reward
The setup shows good R:R, since:
Stop-loss is close
Target is distant
However, pennants can generate fakeouts, so caution is warranted.
6. Market Context (from the chart only)
Current price around $95,984.
The overall trend in the 45-minute view appears mixed:
Strong drop earlier
Stabilization
Compression
The breakout direction will determine the next phase.

Gold/XAUSSD weekly analysis and possible sell/buy scenarios....Currently gold is showing pressure and generating sell signals. There are multiple sell opportunities developed in Gold in different time frames. And we can anticipate couple of opportunities out of these will trigger. Gold has already created CISD on HTF and tested daily FVG and changed delivery and showing down fall in price. There is already one sell scenario executed. And we can see few more in coming week.
1. Price has already changed delivery in daily time frame and tasted daily FVG and price is falling now.
2. Currently price is holding at daily FVG and we may see slight pull back around the levels of 424152 & 4205 and then further fall till ~3888 level.
3. We can see another higher probability sell scenario at 4300 level if aforementioned levels are breached.
4. RSI is also showing sell side pressure, giving another confluence.
5. Most probably price will take liquidity of FVG/RDRB level and create MSS/CISD/TS/iFVG in LTF.
6. Price should show rejection/reversal in respective LTF (1h/15m) at FVG zone.
7. Take the trade only once clear entry model i.e. turtle soup. iFVG break, CDS or MSS happens on LTF
All these combinations are signalling a high probability and ~10R trade scenario.
Note – if you liked this analysis, please boost the idea so that other can also get benefit of it.
Also follow me for notification for incoming ideas.
Also Feel free to comment if you have any input to share.
Join me on live stream for real time update.
Disclaimer: This analysis is for educational purposes only and does not constitute investment advice. Please do your own research (DYOR) and check with your financial advisor before making any trading decisions.

LiamTrading – XAUUSD H1 | Two scenarios for the new weekLiamTrading – XAUUSD H1 | Two scenarios for the new week: wait for reactions at 4100 & Fibonacci zone – prioritise bullish trades when the market recovers
Gold is completing a technical rebound after a sharp drop, and H1 is showing two clear scenarios for the new week. The medium-term trend remains a corrective decline, but on H1, the price is in a rebound phase, so bullish trades will be prioritised – as long as the lower liquidity zones are maintained.
The key this week lies at 4100, where FVG, Fibonacci, and liquidity converge – this is the decisive point to see if gold will bounce back or continue to decline deeply.
🔍 Technical Analysis (Fibonacci • Trendline • Liquidity • Volume Zone)
Fibonacci H1: The price may rebound to Fib 0.5 (~4140–4150) – a zone with high liquidity & likely to show a bearish reaction.
Fib 0.382 (~4120–4130) is currently the first short-term resistance.
Price Structure: The medium-term downtrend is still present, but H1 is forming a rebound wave → prioritise buying when the price pulls back at the support zone.
The descending trendline is still controlling the market. If it breaks the trendline + holds above 4130–4150 → the uptrend is confirmed stronger.
Important liquidity zones:
4100: liquidity confluence + previous bullish resistance → strong reaction zone.
4085 and 4060: liquidity bottoms – if breached, it will trigger a deep decline scenario.
4032: FVG + Fibonacci bottom – the "break or hold" zone for buyers.
Key resistance this week: 4161 – 4187 – 4138 – 4111
📈 TRADING SCENARIOS FOR THE NEW WEEK
Scenario 1 – Bullish trade (priority)
Logic: Gold is rebounding; if it holds 4100 and pulls back strongly → target is the upper Fibonacci zone.
Entry: 4100–4111
SL: 4090
TP: 4138 → 4161 → 4187
Suggestion: Wait for strong signals like pin bar or engulfing H1 to confirm the rebound bottom.
Scenario 2 – Bearish trade (when the market fails to hold the bottom)
Logic: If gold breaks the H1 bottom and retests 4100 without holding → the medium-term downtrend continues to activate.
Entry: 4100–4108 (retest after break)
SL: 4120
TP: 4085 → 4060 → 4032
Suggestion: Only enter when H1 closes below 4100.
🌍 Macro Analysis – Fed causes market noise
According to the latest data from CME Watch:
54.1% chance the Fed maintains rates at 375–400 bps
45.9% chance the Fed cuts rates
The ratio is almost balanced → the market is very indecisive, creating unpredictable volatility ahead of the 10/12 meeting.
In this environment, gold often reacts strongly to unexpected news, so prioritise trading at liquidity zones – wait for clear confirmation.
⚠️ Invalidation Conditions
Price closes below 4060 → fully prioritise bearish trades.
Price closes above 4161 → strong bullish trade activated, discard all sell setups.
What scenario are you preparing for the new week?
Please comment & hit Follow on LiamTrading channel to receive the earliest analysis every day!

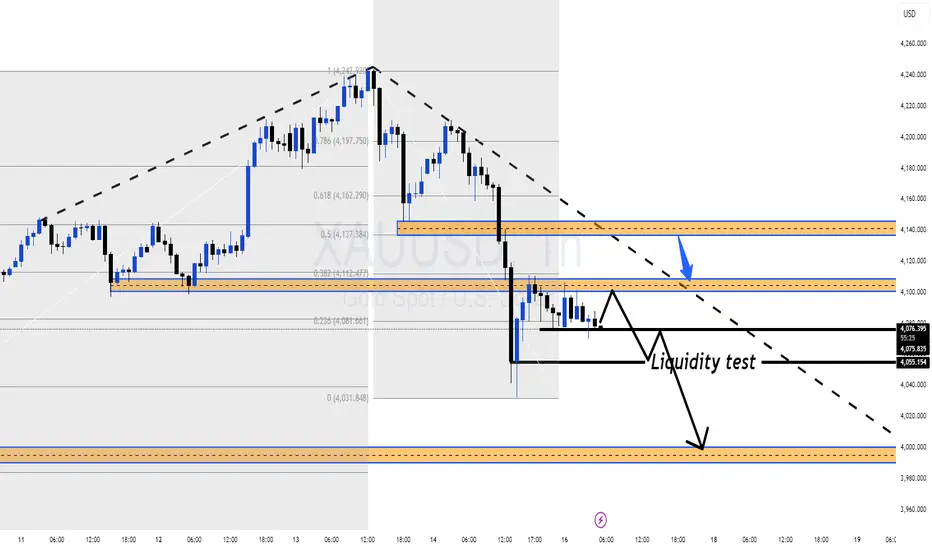
XAUUSD – H4 SCENARIO FOR THE WEEK 17–21/11 💛 XAUUSD – H4 SCENARIO FOR THE WEEK 17–21/11 🎯
🌤 1. Overview
Hello everyone, it's Lana here again 💬
The new week begins with a narrowing trading range on the H4 chart, signalling that gold is preparing for a more significant move. The current medium-term trend needs to break the descending trendline above to confirm the return of the buyers.
💹 Technical Analysis
📉 The end-of-week downtrend is entering a technical rebound phase and is likely to continue declining towards the 4000 trendline – a confluence with a strong liquidity zone.
🟣 Key price levels to watch include: 4138 – 4200 – 4212 – 4037. These are liquidity concentration points, expected to have a clear reaction according to market sentiment.
🔹 Traders can use Fibonacci retracement to spot selling entry points, combined with confirmation signals on smaller time frames (M15–M30).
🌐 Macro Context
The financial market is facing difficulties as US tax policies change continuously, putting pressure on both Gold and Bitcoin.
The end of the year is also a characteristic phase of the economic slowdown cycle, where the market tends to adjust more strongly.
🎯 Reference Trading Scenario (Reference Trading View)
Priority is given to selling according to the technical rebound, especially when the price enters the confluence Fibo + liquidity zones.
Buying is only considered when the price reacts strongly at the 4000 trendline or the 4037 zone.
🌷 6. Conclusion with LanaM2
Gold is in a zone preparing for a big move 💛
Be patient and wait for reactions at important liquidity zones to have a better and safer entry point.
If you find it useful, please 💛 Like – 💬 Comment – 🔔 Follow LanaM2 to receive daily gold analysis! ✨
