Elliott Wave Analysis XAUUSD – 07/01/2025
1. Momentum
D1 Timeframe
– D1 momentum is currently approaching the overbought zone
– We need to wait for today’s D1 candle close for confirmation:
– Either momentum fully enters the overbought zone
– Or it starts to reverse to the downside
– We wait for the candle close to confirm the next signal
H4 Timeframe
– H4 momentum is currently declining
– This indicates that bearish momentum on the H4 timeframe is still dominant
– Main scenario: price continues to decline until H4 momentum reaches the oversold zone and shows a bullish reversal signal
H1 Timeframe
– H1 momentum is approaching the oversold zone
– There are signs of a potential bullish reversal
– In the short term, a technical rebound on the H1 timeframe is likely to occur
2. Elliott Wave Structure
D1 Timeframe
– The current structure is wave 2 or wave B of the purple wave Y
– The ongoing upward move is likely approaching completion
– This wave 2/B has a high probability of ending when D1 momentum confirms a bearish reversal
H4 Timeframe
– The wave 2 or wave B structure has already reached its valid target zone
– H4 momentum is declining
– Expectation: the top has likely been formed
– Main strategy: look for Sell opportunities on H1 pullbacks
H1 Timeframe
– The wave 2 or wave B structure is forming an ABC pattern (red)
– The current upward move is considered wave C of the corrective structure
– At the moment, a short-term bullish momentum move on H1 may occur; however, if H1 momentum reverses upward from the oversold zone while price fails to create a new high, this will provide additional confirmation that wave 2 or wave B has been completed
3. Price Zones & Technical Confluence
– Based on the Volume Profile, two high-liquidity zones have been identified, acting as strong resistance levels
4484 Zone
– A high-liquidity area
– Confluence with the 0.786 Fibonacci retracement of the previous 1–2–3–4–5 bearish wave
4521 Zone
– A high-liquidity area
– The target of the red wave C
– Wave C has a length equal to 1.618 times wave A
– These two zones are used as the primary Sell Zones
4. Trading Plan
Scenario 1
– Sell Zone: 4484 – 4486
– SL: 4501
– TP1: 4445
– TP2: 4398
– TP3: 4348
Scenario 2
– Sell Zone: 4520 – 4522
– SL: 4540
– TP1: 4445
– TP2: 4398
– TP3: 4348
Xauusdanalysis

Gold pauses; rotation, not continuation.🟡 XAUUSD – Intraday Smart Money Plan | by Ryan_TitanTrader (07/01)
📈 Market Context
Gold remains structurally bullish on higher timeframes, following a strong impulsive expansion that delivered price deep into premium. However, recent price action signals a transition from expansion into distribution, with Smart Money beginning to engineer corrective rotations rather than chasing continuation.
As the market digests USD flows, U.S. yield sensitivity, and positioning ahead of upcoming U.S. data, Gold is currently rotating between internal liquidity zones. This environment typically favors liquidity sweeps, inducement, and mean reversion, rather than clean directional breakouts.
Today’s session is best approached with level-based execution, patience, and confirmation — not prediction.
🔎 Technical Framework – Smart Money Structure (1H)
Current Phase:
HTF bullish structure with an active intraday corrective leg from premium.
Key Idea:
Expect Smart Money to react at internal supply (4428–4430) for short-term distribution, or at discount demand (4412–4410) for re-accumulation before the next leg.
Structural Notes:
• HTF bullish structure remains intact
• Clear BOS printed during the upside expansion
• Price rejected from premium and is rotating lower
• Internal supply at 4428–4430 acts as sell-sensitive zone
• Demand at 4412–4410 aligns with OB + EMA support + liquidity pocket
💧 Liquidity Zones & Triggers
• 🟢 BUY GOLD 4412 – 4410 | SL 4402
• 🔴 SELL SCALP 4428 – 4430 | SL 4438
🧠 Institutional Flow Expectation
Liquidity sweep → MSS / CHoCH → BOS → displacement → OB/FVG retest → expansion
🎯 Execution Rules
🟢 BUY GOLD 4412 – 4410 | SL 4402
Rules:
✔ Liquidity sweep into discount demand
✔ Bullish MSS / CHoCH on M5–M15
✔ Strong upside BOS with displacement
✔ Entry via refined bullish OB or FVG mitigation
Targets:
• 4425 — initial reaction
• 4435 — internal liquidity
• 4480–4500 — premium retest if momentum expands
🔴 SELL SCALP 4428 – 4430 | SL 4438
Rules:
✔ Price taps internal supply / EMA resistance
✔ Bearish MSS / CHoCH on lower timeframe
✔ Clear downside BOS confirming distribution
✔ Entry via bearish FVG refill or supply OB
Targets:
• 4418 — first imbalance
• 4410 — demand interaction
• Trail aggressively (scalp setup)
⚠️ Risk Notes
• Premium zones favor stop hunts and fake continuations
• Volatility may expand during U.S. session
• No entries without MSS + BOS confirmation
• Scalp sells require strict risk control
📍 Summary
Gold remains structurally bullish, but today’s edge lies in Smart Money’s intraday rotation:
• A sweep into 4412–4410 may reload longs toward premium, or
• A reaction at 4428–4430 offers a controlled scalp sell back into demand.
Let liquidity move first.
Let structure confirm second.
Smart Money engineers — patience profits. ⚡️
📌 Follow Ryan_TitanTrader for daily Smart Money gold breakdowns.

XAUUSD – Bullish Structure, Look for Pullback BUY📌 Market Context
Gold continues to trade within a bullish short-term structure after completing a corrective leg and forming a clear higher low. The recent consolidation below resistance suggests the market is in a rebalancing phase, not a reversal.
From a fundamental standpoint, the USD remains under pressure amid cautious risk sentiment and expectations of softer monetary conditions, which keeps gold supported on pullbacks.
📊 Technical Structure (H1)
Market structure remains HH – HL, bullish bias intact.
Price is consolidating below key resistance after an impulsive leg up.
Current price action reflects liquidity absorption before the next expansion.
Key observations from the chart:
Prior sell-off failed to break the bullish structure.
Demand zones below are holding well.
Fibonacci retracement aligns with demand, reinforcing buy-side interest.
🔑 Key Levels to Watch
Major Resistance:
• 4,534
• 4,503
Intraday Resistance / Reaction Zone:
• 4,477
Key BUY Zones:
• 4,452
• 4,397 (main demand & structure support)
🎯 Trading Plan – MMF Approach
Primary Scenario (BUY the Pullback):
Prefer BUY setups on pullbacks into 4,452 → 4,397.
Look for bullish confirmation (reaction, rejection, momentum shift).
Targets:
→ TP1: 4,477
→ TP2: 4,503
→ TP3: 4,534
Alternative Scenario:
If price fails to hold above 4,397 on H1 close, stand aside and reassess structure before taking new positions.
⚠️ Risk Management Notes
Avoid chasing price near resistance.
Let the market come back into discount zones.
Follow structure, not emotions.

XAUUSD – Bullish Structure Intact, Focus on Pullback BUY📌 Market Context
Gold continues to trade within a bullish short-term structure after completing a corrective leg and forming a clear higher low. The recent consolidation below resistance suggests the market is in a rebalancing phase, not a reversal.
From a fundamental standpoint, the USD remains under pressure amid cautious risk sentiment and expectations of softer monetary conditions, which keeps gold supported on pullbacks.
📊 Technical Structure (H1)
Market structure remains HH – HL, bullish bias intact.
Price is consolidating below key resistance after an impulsive leg up.
Current price action reflects liquidity absorption before the next expansion.
Key observations from the chart:
Prior sell-off failed to break the bullish structure.
Demand zones below are holding well.
Fibonacci retracement aligns with demand, reinforcing buy-side interest.
🔑 Key Levels to Watch
Major Resistance:
• 4,534
• 4,503
Intraday Resistance / Reaction Zone:
• 4,477
Key BUY Zones:
• 4,452
• 4,397 (main demand & structure support)
🎯 Trading Plan – MMF Approach
Primary Scenario (BUY the Pullback):
Prefer BUY setups on pullbacks into 4,452 → 4,397.
Look for bullish confirmation (reaction, rejection, momentum shift).
Targets:
→ TP1: 4,477
→ TP2: 4,503
→ TP3: 4,534
Alternative Scenario:
If price fails to hold above 4,397 on H1 close, stand aside and reassess structure before taking new positions.
⚠️ Risk Management Notes
Avoid chasing price near resistance.
Let the market come back into discount zones.
Follow structure, not emotions.

2026 Entry Setup 3 Before Trade Entry Follow the Step:-
Step 1:- Identify the Trend
Step 2:- Bullish Trend Wait for Support Price & Reversal Candlestick(Take Buy)
Step 3:- Bearish Trend Wait for Resistance & Reversal Candlestick(Take Sell)
Step 4:- Fibonacci retracement confirm
Step 5:- Wait for Reversal candlestick
My Trading Role:-
1. Don't Lose capital
2. Trade less Earn More
Focus On:-
1. Quality Trades
2. Risk Management
3. Self - Discipline
RISK WARNING:- All trading involves risk. Only risk capital you're prepared to lose. This video has not given any investment advice, only for educational purposes.

“Gold Base Holds — Ready for Breakout?”📊 Technical Chart Analysis (XAU/USD)
📌 Key Levels
Strong Support Zone (Red Box) – Price has been respecting this area and has bounced multiple times — signaling accumulation/support.
Mitigated FVG & CHoCH Area (Green Zone) – This area shows prior imbalance and a possible change of character, now acting as resistance.
Higher Resistance Region (Dark Grey) – A key supply zone the price may target if bullish momentum continues.
Important Horizontal Levels:
• Around ~4300—support (green line)
• Around ~4258—deeper support (red horizontal)
📈 Bullish Scenario (Preferred)
✔ Price is holding above support.
✔ A potential CHoCH (Change of Character) indicates buyers may be stepping in.
✔ The mitigated FVG zone above ~4375/4400 is a logical target if bullish momentum resumes.
✔ The black dashed path on your chart suggests a retest of the support before continuation.
Bullish Path:
Retest support
Bounce and clear local resistance
Rally up toward the grey supply zone above ~4400–4500
📉 Bearish Alternative
If support breaks decisively:
Price could revisit the deeper support ~4258 (red horizontal)
Then possibly resume higher momentum from that level (red dashed path)
🧠 Fundamental Reasons Supporting Bullish Gold (2026)
Here are core macro drivers that could push gold prices higher:
✔ 1. Central Bank Buying & Safe-Haven Demand
Major central banks have been accumulating gold reserves aggressively, reinforcing structural demand and reducing available supply.
The Times of India
✔ 2. Anticipated Monetary Easing
Markets increasingly expect interest rate cuts or easier policy from major central banks in 2026. Lower rates reduce the opportunity cost of holding gold (which doesn’t yield interest).
State Street Global Advisors
✔ 3. Weakening U.S. Dollar
Gold is priced in USD — a weaker dollar typically boosts gold due to increased purchasing power for foreign buyers.
State Street Global Advisors
✔ 4. Geopolitical & Economic Uncertainty
Inflation risk, geopolitical tensions, and global macro instability have historically driven capital into gold as a hedge and safe-haven asset.
Financial Times
✔ 5. Portfolio Diversification & ETF Inflows
Record flows into gold ETFs and strategic institutional allocations have supported price strength.
Morgan Stanley
🟢 Bullish Fundamental Summary
Gold’s fundamentals point to a continued structural bull cycle — even if price consolidates in the short term. Central bank demand, possible rate cuts, USD weakness, and geopolitical uncertainty all provide strong backing for a continued uptrend into 2026.
State Street Global Advisors
+1
📌 Technical + Fundamental Confluence
Bullish Scenario is stronger if:
• Support holds above ~4300–4258
• Price breaks above mitigation zone around ~4400
• Volume increases on upward moves

XAUUSD M30 – Pullback BUY according to OB + GAP + Fibo🔎 Market Structure (SMC)
• Price has clearly BOS increased, confirming the short-term trend is still bullish
• Currently, the price is moving on an upward trendline, the decline is just a technical pullback
• No CHoCH decrease has appeared → no reversal signal yet
🟢 Key BUY Zone (Confluence Zone)
• Bullish OB + Fibo 0.5–0.618: 4,416 – 4,397
• This is a valid demand zone because:
OB is below the price
Coincides with the Fibo retracement of the BOS move
Located above the HL structure
👉 Prioritize BUY when the price retraces to this zone and a clear price reaction appears (reject / engulf / hold bottom).
🟡 Deep BUY Zone – GAP / FVG
• FVG – GAP not yet filled: 4,348 – 4,332
• This is a deep liquidity zone, only activated when:
The OB above is breached
The price has not yet broken the large frame upward structure
👉 Used for patient BUY, no FOMO.
🎯 Targets (Liquidity above)
• TP1: 4,490
• TP2: 4,514
• TP3: 4,533 – 4,553 (Liquidity Sell $$$)
❌ Invalidation
• Price closes M30 below the entire GAP zone (4,332)
→ Upward structure is broken, canceling the entire BUY scenario
📌 Quick Summary
• Bias: Bullish – Buy the dip
• Main BUY zone: OB + Fibo 0.5–0.618
• Deep BUY: FVG / GAP
• Do not SELL against the trend when there is no CHoCH decrease

Elliott Wave Analysis XAUUSD – 06/01/2026
1. Momentum
D1 Timeframe
– D1 momentum is currently rising
– It may take another 1–2 D1 candles for momentum to enter the overbought zone
– This suggests the current bullish move still has room to extend and may last another 1–2 days before a clear reversal signal appears
H4 Timeframe
– H4 momentum is currently in the overbought zone and preparing for a bearish reversal
– In the near term, H4 is likely to form a corrective move / bearish reversal
– This downside move is expected to last at least several H4 candles once the momentum reversal is confirmed
H1 Timeframe
– H1 momentum is still rising
– However, only 1–2 more H1 candles are needed for momentum to enter the overbought zone
– Therefore, a short-term bearish reversal on H1 is highly likely
2. Elliott Wave Structure
D1 Timeframe
– The D1 structure remains within the purple wave Y
– Price is likely forming wave 1 or wave A of the bearish leg within wave Y
– The completion of wave 2 or wave B is likely to coincide with the next bearish reversal of D1 momentum
H4 Timeframe
– The structure of purple wave Y is more clearly visible on H4
– H4 momentum is currently preparing for a bearish reversal, suggesting a downside move ahead
– Confirmation requires at least one bearish H4 candle
– Once confirmed, the Sell scenario will continue to be prioritized
H1 Timeframe
– The current recovery move is forming a 3-wave ABC structure
– Price has already exceeded the Fibonacci target zone outlined in yesterday’s plan
– Price is now approaching a major liquidity zone at 4471
3. Liquidity Zones & Price Scenarios
– The major liquidity zone is highlighted by the red box on the chart
– This zone is located between 4471 – 4521
Primary Scenario
– When price first approaches the outer edge at 4471, a bearish reaction is highly likely
– This area is considered a preferred zone to look for a potential top
Bullish Continuation Scenario
– If H4 momentum reverses lower and moves into oversold territory
– While the corrective decline does not close below 4398
– Then we should prepare for another bullish continuation toward the 4471 – 4521 liquidity zone
Strong Bearish Scenario
– If price closes below the 4398 level
– Or even moves into the lower liquidity zone at 4348 – 4317
– Then the market is likely to enter a strong bearish phase toward deeper targets of wave Y
4. Trading Plan
– Sell Zone: 4470 – 4472
– Stop Loss: 4490
– TP1: 4405
– TP2: 4348
– TP3: 4072
➡️ Overall Strategy
– Continue to prioritize Sell setups around the 4471 area as planned
– Wait for additional confirmation from H4 and H1 momentum to enter trades with higher probability

XAUUSD Smart Money Levels: Demand 4325, Supply 4494🟡 XAUUSD – Intraday Smart Money Plan | by Ryan_TitanTrader (05/01)
📈 Market Context
Gold remains structurally bullish on higher timeframes, but current price action reflects a premium-side liquidity operation rather than clean continuation. After a strong upside leg, price is now rotating inside premium where Smart Money typically distributes positions before initiating corrective delivery.
Today’s focus revolves around USD strength, U.S. yield sensitivity, and ongoing Fed rate path speculation, with traders positioning ahead of upcoming U.S. macro releases and Fed commentary. As real yields fluctuate and risk sentiment remains fragile, Gold continues to attract safe-haven flows — but not without engineered pullbacks.
This environment favors liquidity sweeps, false continuation, and inducement above highs, rather than impulsive breakout buying.
🔎 Technical Framework – Smart Money Structure (1H)
Current Phase:
Higher-timeframe bullish structure with an active short-term corrective leg from premium.
Key Idea:
Expect Smart Money interaction either at internal supply (4492–4494) for distribution, or HTF demand (4327–4325) for re-accumulation before the next expansion.
Structural Notes:
• HTF bullish structure remains valid
• Recent CHoCH confirms corrective rotation
• Buy-side liquidity above highs has been partially tapped
• Supply cluster at 4492–4494 acts as distribution zone
• Demand zone at 4327–4325 aligns with OB + liquidity pool
💧 Liquidity Zones & Triggers
• 🟢 BUY GOLD 4327 – 4325 | SL 4317
• 🔴 SELL GOLD 4492 – 4494 | SL 4500
🧠 Institutional Flow Expectation
Liquidity sweep → MSS / CHoCH → BOS → displacement → OB/FVG retest → expansion
🎯 Execution Rules
🟢 BUY GOLD 4327 – 4325 | SL 4317
Rules:
✔ Liquidity sweep into HTF demand
✔ Bullish MSS / CHoCH confirmation on M5–M30
✔ Strong upside BOS with impulsive candles
✔ Entry via refined bullish OB or FVG mitigation
Targets:
• 4390 — initial displacement
• 4450 — internal liquidity
• 4490+ — premium retest if USD weakens
🔴 SELL GOLD 4492 – 4494 | SL 4500
Rules:
✔ Reaction into premium supply zone
✔ Bearish MSS / CHoCH on lower timeframe
✔ Clear downside BOS confirming distribution
✔ Entry via bearish FVG refill or supply OB
Targets:
• 4455 — first imbalance fill
• 4395 — internal discount
• 4327 — HTF demand sweep
⚠️ Risk Notes
• Premium zones favor fake breakouts and stop hunts
• Volatility may spike around U.S. data and Fed remarks
• No entries without MSS + BOS confirmation
• Stops often triggered before real displacement
📍 Summary
Gold remains structurally bullish, but today’s edge lies in trading Smart Money’s range:
• A sweep into 4327–4325 may reload longs toward 4450–4490, or
• A reaction at 4492–4494 offers a sell opportunity back into discount.
Let liquidity move first.
Let structure confirm second.
Smart Money engineers — patience profits. ⚡️
📌 Follow Ryan_TitanTrader for daily Smart Money gold breakdowns.

XAUUSD Smart Money Levels: Demand 4312, Supply 4436XAUUSD – Intraday Smart Money Plan | by Ryan_TitanTrader (05/01)
Market Context
Gold remains structurally bullish on higher timeframes, yet short-term price action shows pullback pressure after premium liquidity was elected near 4440. As markets brace for ongoing USD direction from macro catalysts (Fed commentary, U.S. jobs data, Treasury yields), institutional participation is oscillating between liquidity hunts and controlled re-accumulation.
Global risk sentiment and safe-haven bids are intensifying as traders weigh inflation trajectory with central bank pivot expectations — leading Gold to exhibit rotational distribution behavior rather than clean continuation. Controlled swings and sweep-driven moves dominate price progression.
This environment favors engineered liquidity access and inducement, not blind breakout chasing.
Technical Framework – Smart Money Structure (1H)
Current Phase:
Higher-timeframe bullish bias with short-term corrective displacement.
Key Idea:
Expect structural engagement near HTF demand (~4312–4314) or internal supply liquidity (~4434–4436) before meaningful displacement sequences.
Structural Notes:
• HTF bullish structure remains intact
• Recent CHoCH confirms corrective leg
• Buy-side liquidity above recent highs is targeted
• Supply cluster near 4436 acts as engineered lure
• Demand confluence aligns with institutional accumulation
Liquidity Zones & Triggers
• BUY GOLD 4314 – 4312 | SL 4304
• SELL GOLD 4434 – 4436 | SL 4444
Institutional Flow Expectation
Liquidity sweep → MSS / CHoCH → BOS → displacement → internal supply retest → expansion
Execution Rules
BUY GOLD 4314 – 4312 | SL 4304
Rules:
✔ Liquidity sweep into HTF demand
✔ Bullish MSS / CHoCH confirmation on M5–M30
✔ Clear upside BOS with impulse candles
✔ Entry via refined demand OB or FVG fill
Targets:
• 4370 — initial displacement
• 4410 — internal supply test
• 4440+ — extended run if USD weakens
SELL GOLD 4434 – 4436 | SL 4444
Rules:
✔ Reaction into internal supply cluster
✔ Bearish MSS / CHoCH confluence
✔ Downside BOS with momentum shift
✔ Entry via bearish FVG refill or supply OB
Targets:
• 4390 — first discount zone
• 4350 — deeper pullback
• 4314 — HTF demand scan
Risk Notes
• False breaks favored near thin Asian session volume
• Macro catalysts (U.S. data, Fed speakers) may spike volatility
• Avoid entries without MSS + BOS confirmations
• Stops triggered by engineered liquidity hunts
Summary
Gold remains structurally bullish, but today’s edge lies in disciplined entries and liquidity awareness:
• A sweep into 4312–4314 may reload longs with targets up to 4410–4440, or
• A reaction near 4434–4436 provides a fade opportunity back into discount.
Let liquidity initiate the move. Let structure confirm.
Smart Money sets traps — retail chases them.
Follow Ryan_TitanTrader for daily Smart Money gold breakdowns.

My Entry Setup 2 :- 2026 Before Trade Entry Follow the Step:-
Step 1:- Identify the Trend
Step 2:- Bullish Trend Wait for Support Price & Reversal Candlestick(Take Buy)
Step 3:- Bearish Trend Wait for Resistance & Reversal Candlestick(Take Sell)
Step 4:- Fibonacci retracement confirm
Step 5:- Wait for Reversal candlestick
My Trading Role:-
1. Don't Lose capital
2. Trade less Earn More
Focus On:-
1. Quality Trades
2. Risk Management
3. Self - Discipline
RISK WARNING:- All trading involves risk. Only risk capital you're prepared to lose. This video has not given any investment advice, only for educational purposes.

XAUUSD (Gold) H1 – Bullish Structure Shift with FVG SupportTechnical Analysis (H1)
Market Structure
The chart shows a clear bullish shift after a prior bearish leg.
A CHoCH (Change of Character) to the upside confirms the transition from bearish to bullish market structure.
Multiple BOS (Break of Structure) levels to the upside indicate strengthening bullish momentum.
Order Flow & Liquidity
Price respected a bullish BOS after sweeping sell-side liquidity near the recent lows.
The impulsive bullish move created stacked Fair Value Gaps (FVGs) below current price, suggesting strong institutional participation.
These FVGs act as premium demand zones for potential pullbacks.
Key Zones
Bullish FVG / Demand Zone: ~4,330 – 4,380
→ Ideal area for bullish continuation if price retraces.
Current Price: ~4,439
Upside Liquidity / Target: ~4,500 – 4,550
→ Equal highs and external liquidity resting above.
Bias
Bullish continuation bias as long as price holds above the most recent BOS and FVG support.
Shallow pullbacks into FVGs are likely to be bought.
Invalidation
A strong H1 close below the lowest FVG (~4,330) would weaken the bullish bias and suggest deeper retracement.
Trade Idea (Conceptual)
Buy on retracement into FVG zone
Targets: 4,485 → 4,520 → 4,550
Risk: Invalidation below demand structure

XAUUSD – M30 Trading Plan | Buy Demand + GAP–FiboAUUSD – M30 Trading Plan | Buy Demand + GAP–Fibo
🔍 Market Context (SMC)
The price has formed an upward BOS, confirming the short-term trend still belongs to the BUY side. The current decline is just a technical pullback to rebalance the cash flow, there is no bearish CHoCH → no reason to reverse the bias.
OB is below the current price, so this area is Demand (Buy Zone),
🟢 Primary Scenario – BUY according to Demand + GAP + Fibo
• Confluence Buy Zone:
Demand / Bullish OB + GAP (iFVG) + Fibo 0.5 – 0.618
→ price range: 4.40x – 4.39x
• Entry Logic:
The price retraces to the GAP not fully filled, coinciding with the Fibo retracement of the upward BOS → high probability of a BUY reaction.
• Target:
TP1: nearest previous peak
TP2: expand according to structure if there is a continued BOS
• Invalidation:
M30 candle closes below the entire Demand / GAP area → cancel the BUY scenario
⚠️ Secondary Scenario – Not prioritized
If the price does not retrace to GAP – Fibo but continues sideways or breaks the peak → stay out, do not chase BUY without a proper pullback.
📌 Summary
• Trend: Bullish after BOS
• Optimal BUY point: Demand + GAP + Fibo (0.5–0.618)
• Only SELL when there is a clear bearish CHoCH (currently none)

Elliott Wave Analysis XAUUSD – Week 2 of January
1. Momentum Analysis
Weekly (W1)
Weekly momentum is clearly turning bearish, therefore the medium-term primary trend remains bearish.
Daily (D1)
Daily momentum is preparing to reverse to the upside, which suggests that a corrective bullish move lasting at least several days is likely during this week.
H4
H4 momentum is currently bearish; however, this signal was confirmed by the Friday close. Due to weekend market closure and geopolitical risks (US – Venezuela tensions), we will wait for Monday’s market open to observe price behavior before taking action.
2. Elliott Wave Structure
Weekly Structure (W1)
The strong bearish weekly close, combined with confirmed bearish reversal of W1 momentum, provides additional confirmation that purple wave Y of yellow wave 4 is forming.
👉 Target zones for purple wave Y:
- First target: 4072
- Second target: 3761
Daily Structure (D1)
The sharp decline from the 4549 area may have completed wave 1 or wave A of the purple wave Y structure.
Since D1 momentum is preparing to turn bullish, the market is likely to experience a corrective rebound forming wave 2 or wave B over the next few days.
⚠️ Important invalidation:
If D1 momentum reaches the overbought zone and reverses, while price breaks above 4549, then this Elliott Wave count will no longer be valid and must be reassessed.
H4 Structure
On H4, I am expecting a corrective bullish ABC structure (red) to develop.
- Price is currently trading inside a high-liquidity zone at 4317 – 4348, which is considered a strong support area. This is where red wave B is expected to complete.
- After that, red wave C is projected to rise toward the upper liquidity zone, specifically around 4471, to complete the ABC correction before the primary bearish trend resumes.
Key resistance zones:
- 4445
+ 0.618 Fibonacci retracement of the prior decline
+ Confluence where red wave C equals red wave A
→ This will be the first Sell-scouting zone.
- 4471
+ Boundary between high and low liquidity zones
→ This is the secondary Sell-scouting zone in our trading plan.
3. Trading Plan
Sell Scenario 1
Sell Zone: 4444 – 4446
Stop Loss: 4455
TP1: 4405
TP2: 4348
TP3: 4072
Sell Scenario 2
Sell Zone: 4470 – 4472
Stop Loss: 4490
TP1: 4405
TP2: 4348
TP3: 4072

XAU/USD: Retrace to Supply, Await Next Move Reaction◆ Market Context (M30)
After the previous sharp decline, gold has formed an upward CHoCH and upward BOS, confirming a short-term recovery. The price is currently approaching the upper Supply zone, where strong selling pressure was previously observed.
◆ Structure & Flow (SMC)
• The nearest bottom is held firm at Demand / OB, indicating that buying flow is still effective.
• The current upward move is characterized by recovery + rebalancing, not a breakout of a major trend.
• The upper Supply zone is the area to watch for price reaction to confirm the next direction.
◆ Key Levels
• Supply Zone: ~4,390 – 4,401
• Buy Fibo (scalp / pullback): ~4,345 – 4,350 (Fibo 0.5)
• Demand / OB: ~4,305 – 4,315
• Upper Liquidity: ~4,430+
◆ Trading Scenarios
➤ Scenario 1 – BUY pullback (priority when structure holds)
• Price retraces to 4,345 – 4,350
• Price holding reaction / candle rejecting decline appears
• Target: 4,390 → 4,430
• Invalid: M30 closes below 4,315
➤ Scenario 2 – SELL reaction at Supply (short-term)
• Price hits 4,390 – 4,401 but does not break
• Rejection / breakdown appears on M5–M15
• Target: 4,350 → 4,320
• This is a counter-trend scalp, not the main trend.
◆ Summary
• Short-term bias: Sideway → Slightly Bullish, prioritize BUY on retrace.
• Upper Supply is the decisive zone: strong break → continued rise, rejection → technical correction.
• Avoid FOMO in the middle range, wait for price to reach confluence zone.

XAUUSD (H1) – Short-term Correction After ATH Lana focuses on sell rallies, waiting for a deeper buy zone 💛
Quick overview
Market state: Sharp sell-off after failing to hold above ATH
Timeframe: H1
Current structure: Strong bearish impulse → corrective rebound in progress
Intraday bias: Sell on pullbacks, buy only at major support
Technical picture (based on the chart)
Gold printed a clear distribution top near ATH, followed by a strong bearish displacement. This move broke the short-term bullish structure and shifted momentum to the downside.
Price is now attempting a technical rebound, but so far this looks corrective rather than impulsive. As long as price stays below key resistance, Lana treats this as a sell-the-rally environment.
Key observations:
Strong bearish candle confirms loss of bullish control
Current rebound is moving into prior liquidity + Fibonacci reaction zone
Market is likely building a lower high before the next move
Key levels to trade
Sell zone – priority setup
Sell: 4392 – 4395
This zone aligns with:
Prior structure resistance
Fibonacci retracement area
Liquidity resting above current price
If price reaches this zone and shows rejection, Lana will look for sell continuation.
Buy zone – only at strong support
Buy: 4275 – 4278
This is a higher-timeframe support zone and the first area where buyers may attempt to step back in. Lana only considers buys here if price shows clear reaction and stabilization.
Intraday scenarios
Scenario 1 – Rejection at resistance (preferred)
Price retraces into 4392–4395, fails to break higher, and rolls over → continuation to the downside, targeting deeper liquidity.
Scenario 2 – Deeper correction then recovery
If selling pressure extends, price may sweep liquidity into 4275–4278 before forming a base for a larger rebound into the new year.
Market tone
The recent move reflects profit-taking and risk reduction after an extended rally. With year-end liquidity thinning out, price action can remain volatile and deceptive, making zone-based trading essential.
This analysis reflects Lana’s technical view and is not financial advice. Always manage your own risk and wait for confirmation before entering trades 💛

XAUUSD Pullback – Monitor Supply Before Next MoveMarket Context (Short-Term)
Gold has printed a strong bearish impulse, followed by a technical pullback phase. The current upside move is corrective in nature, driven by liquidity rebalancing, not a confirmed trend reversal.
Market Structure & Price Action
Short-term structure remains bearish with lower highs in place.
The ongoing recovery is a pullback within a bearish leg, not a new bullish trend.
No valid bullish break of structure has been confirmed on the intraday timeframe.
Key Technical Zones
Supply / Sell Reaction Zone: 4,401 – 4,462
→ Major distribution area. Expect selling pressure and potential bearish reaction.
Intermediate Resistance: 4,348 – 4,350
→ Current reaction zone where price may consolidate or fake-break before the next move.
Demand / Buy Zones:
4,322 – 4,326
4,285 – 4,290
→ Liquidity-rich demand areas where the pullback may complete.
Primary Scenario (MMF Bias)
Price continues to retrace into the 4,40x supply zone, shows rejection or bearish confirmation, then rotates lower toward the demand zones below.
Alternative Scenario
If price accepts above 4,401 with strong bullish displacement and clean structure, the pullback could extend toward the higher supply near 4,46x.
Flow & Macro Considerations
Early-year liquidity remains thin, increasing the probability of liquidity sweeps on both sides. Patience is required—wait for price reaction at key zones rather than chasing momentum.
Conclusion
Bias remains bearish-to-neutral while below supply. Focus on price reaction at key zones, not direction. Let the market reveal intent.

Elliott Wave Analysis XAUUSD – January 2, 2026
🎉 Happy New Year 2026
Wishing everyone a disciplined, consistent, and profitable trading year ahead.
1. Momentum Analysis
Daily (D1)
Daily momentum is currently approaching the oversold zone and preparing for a bullish reversal. This suggests that in the coming period, the market is likely to see a corrective rebound lasting at least several days, until D1 momentum reaches the overbought area.
H4
H4 momentum is currently in the overbought zone, which increases the probability of a bearish momentum reversal on the H4 timeframe in the near term.
H1
H1 momentum is compressed and overlapping within the overbought zone, indicating a high probability that H1 momentum will continue to turn bearish.
2. Elliott Wave Structure
Daily (D1)
After the strong sell-off, we can identify approximately five consecutive bearish D1 candles, which aligns well with the observation that D1 momentum is preparing to reverse upward from oversold conditions.
Therefore, the upcoming advance is likely to be Wave 2 or Wave B, within the structure of the purple Wave Y.
This expected rebound may move in sync with D1 momentum. As a result, we should closely monitor price behavior as D1 momentum enters the overbought zone for confirmation.
- If D1 momentum reaches overbought but price fails to create a new high, this will further confirm the continuation of the purple Wave Y scenario.
- The projected targets for Wave Y remain at 4072 and 3761.
H4
The prior decline on H4 can be counted as Wave 1 or Wave A within the purple Wave Y structure.
The current recovery is likely forming Wave 2 or Wave B.
⚠️ If price breaks decisively above 4549 while D1 momentum is already overbought, the current wave-count scenario would be invalidated and require reassessment.
H1
A complete five-wave bearish structure (red) has already formed.
According to Elliott Wave principles, a completed five-wave move is typically followed by at least a three-wave corrective structure.
With D1 momentum preparing to reverse bullishly, if today’s D1 candle closes with bullish confirmation, this corrective rally could extend for several days, but should not break above the 4549 level.
Since this advance is likely Wave 2 or Wave B, its characteristics are expected to be:
- Slow price movement
- Overlapping and choppy sub-waves
👉 For this reason, I recommend short-term trading only at this stage and avoiding aggressive long-term buy positions.
3. Resistance Zones & Key Levels
The expected completion zones for the corrective rebound are:
- 4376
- 4405
- 4445
Among these:
- 4405 and 4445 are strong confluence resistance zones, aligning with the 50% and 61.8% Fibonacci retracement of the prior decline.
- These areas are considered ideal zones to look for long-term sell opportunities, targeting the completion of the purple Wave Y.
4. Trading Plan
Sell Scenario 1
- Sell zone: 4404 – 4406
- Stop loss: 4415
- TP1: 4344
- TP2: 4275
- TP3: 4072
Sell Scenario 2
- Sell zone: 4444 – 4446
- Stop loss: 4465
- TP1: 4405
- TP2: 4275
- TP3: 4072

if GOLD break DEC 2025 low then gold dump 10-15% below if GOLD break DEC 2025 low then gold dump 10-15% below
if GOLD break DEC 2025 low then gold dump 10-15% below if GOLD break DEC 2025 low then gold dump 10-15% below if GOLD break DEC 2025 low then gold dump 10-15% below v
v

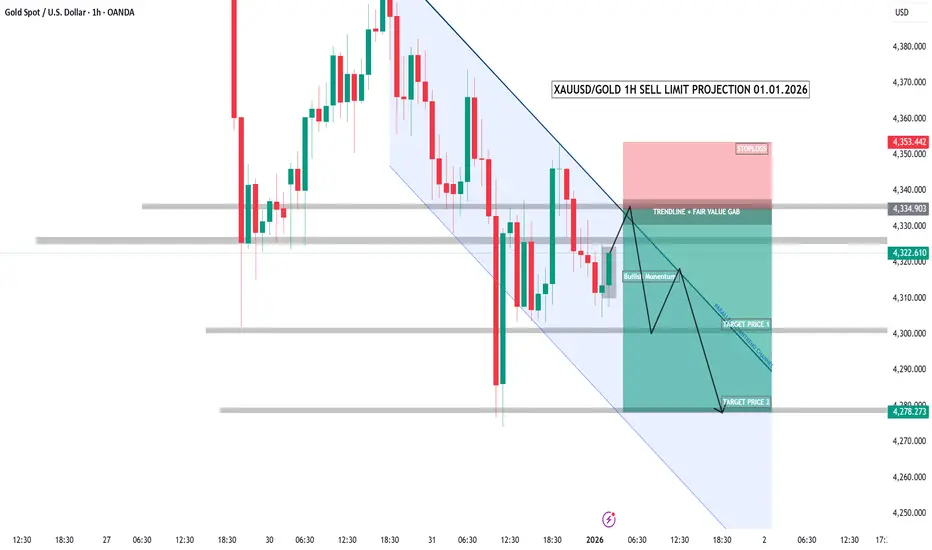
XAUUSD/GOLD 1H SELL LIMIT PROJECTION 01.01.26This is XAUUSD – Gold – on the 1-hour timeframe.
The market is clearly in a downtrend,
forming lower highs and lower lows.
Price is currently in a pullback phase within the trend.
This pullback is moving into a strong confluence zone —
the descending trendline combined with a fair value gap.
This area acts as a high-probability sell zone.
Sell limit area:
4330 to 4340.
Here, we expect a short-term bullish move to trap buyers,
followed by a strong rejection and continuation to the downside.
Stop loss:
4353 — a clear invalidation of the setup.
Target one:
4300 — a short-term support level.
Target two:
4278 — a strong demand zone and trend continuation target.
This is a pullback sell strategy.
Trade with the trend, not against it.
No emotions.
No overtrading.
Only structure, discipline, and patience.
Smart Money reloading Gold after liquidity sweep?🟡 XAUUSD – Intraday Smart Money Plan | by Ryan_TitanTrader (30/12)
📈 Market Context
Gold remains structurally supported on higher timeframes, but current price action reflects controlled volatility and liquidity engineering rather than trend continuation.
With markets reacting to fresh U.S. data expectations, USD yield fluctuations, and ongoing geopolitical uncertainty, Gold continues to attract safe-haven interest — yet extended intraday ranges suggest Smart Money is actively positioning rather than chasing price.
Recent headlines around Fed rate path uncertainty and mixed U.S. macro signals keep Gold bid on pullbacks, while thinning liquidity into the year-end session increases the likelihood of stop hunts and engineered traps on both sides of the range.
Smart Money behavior favors drawing liquidity first, confirming structure later — not clean breakouts.
🔎 Technical Framework – Smart Money Structure (1H)
Current Phase:
HTF bullish structure with short-term corrective compression
Key Idea:
Expect liquidity interaction at discount (4320–4318) or reaction from internal supply (4465–4467) before any sustained displacement.
Structural Notes:
HTF bullish BOS remains valid
Prior CHoCH triggered a corrective leg
Price is compressing under bearish trendline
Discount zone aligns with potential accumulation
Buy-side liquidity rests above internal highs
Sell-side liquidity recently probed and absorbed
💧 Liquidity Zones & Triggers
• 🟢 BUY GOLD 4320 – 4318 | SL 4310
• 🔴 SELL GOLD 4465 – 4467 | SL 4475
🧠 Institutional Flow Expectation
Liquidity sweep → MSS / CHoCH → BOS → displacement → FVG / OB retest → expansion
🎯 Execution Rules
🟢 BUY GOLD 4320 – 4318 | SL 4310
Rules:
✔ Liquidity grab into discount zone
✔ Bullish MSS / CHoCH on M5–M15
✔ Clear upside BOS with impulsive displacement
✔ Entry via bullish FVG fill or refined demand OB
Targets:
4360
4400
4465 – extension if USD weakens and risk sentiment deteriorates
🔴 SELL GOLD 4465 – 4467 | SL 4475
Rules:
✔ Reaction into internal supply / premium imbalance
✔ Bearish MSS / CHoCH on LTF
✔ Downside BOS with momentum shift
✔ Entry via bearish FVG refill or supply OB
Targets:
4430
4385
4320 – extension if USD strengthens or yields rise
⚠️ Risk Notes
Compression favors false breakouts
No execution without MSS + BOS confirmation
Expect volatility during U.S. session
Reduce risk around USD yield spikes or Fed-related headlines
Thin liquidity amplifies stop hunts
📍 Summary
Gold remains bullish by structure, but today’s edge lies in patience, not prediction.
Smart Money is likely to engineer liquidity before committing:
• A sweep into 4320–4318 may reload longs toward 4400–4465, or
• A reaction near 4465–4467 could fade price back into discount.
Let liquidity move first. Let structure confirm.
Smart Money waits — retail reacts. ⚡️
📌 Follow @Ryan_TitanTrader for daily Smart Money gold breakdowns.

XAUUSD 1H: Structure Shift & Support-Based RecoveryOn the 1H timeframe, XAUUSD is currently in a corrective phase after rejection from the All-Time High near 4560. The sharp bearish move from the highs suggests profit booking and short-term distribution, not a confirmed long-term trend change. Price has now reacted from a strong support zone around 4345–4300, which earlier acted as a consolidation area and is showing demand through rejection wicks and slowing downside pressure. Market structure indicates possible base formation, with price trying to hold above support and stabilise. As long as price remains above 4300, a gradual recovery towards 4390–4415 is possible, followed by 4480–4520 if buying momentum improves. A decisive move below 4300 would invalidate the recovery scenario and increase downside risk.
This analysis is purely based on technical price action and is for educational purposes only.

XAUSUD (Gold) | Technical Outlook | Last Day of Analysis 2025Gold is showing short-term weakness despite a bullish higher-timeframe trend (weekly/monthly). Current price action is driven by profit booking and momentum selling, with volatility keeping key levels in focus. As long as gold trades below 4,350, the intraday bias remains bearish, with downside levels at 4,327 → 4,305 (key) → 4,282, and a break below 4,305 opening room toward 4,275. Rallies below resistance are likely to be sold. A bullish reversal is only valid on a strong break and hold above 4,370, followed by acceptance above 4,395, which can open upside toward 4,416–4,450. For today, selling near resistance offers higher probability, while long positions should be considered only on confirmed breakout strength.
