The Unstoppable Rise of GoldTechnical Analysis (XAU/USD):
Gold is trading around $3,816, showing continued bullish strength along the upward trend line. Price has respected higher lows, confirming buyers remain in control. Key short-term support levels are visible at $3,797, $3,759, and $3,718. As long as price stays above the $3,718 zone (major support), the bullish structure remains intact.
The chart indicates two bullish scenarios:
A direct continuation higher from current levels.
A potential retest of the $3,797 – $3,759 zone before another push upward.
Upside targets in the coming sessions stand between $3,860 – $3,900, with further momentum potentially extending beyond $3,925.
Fundamental Analysis:
Safe-Haven Demand: Persistent geopolitical uncertainties and global economic slowdown fears are keeping gold attractive as a safe-haven asset.
Central Bank Policies: If the Fed maintains a dovish stance or signals rate cuts, real yields may decline, further boosting gold.
Inflation Hedge: Despite cooling in some regions, sticky inflation supports long-term gold demand.
Central Bank Purchases: Record gold buying by global central banks continues to provide a solid floor under prices.
Conclusion:
Gold remains in a strong bullish phase, with technicals showing steady upward momentum and fundamentals reinforcing demand. Any dips toward $3,759–$3,718 may offer buying opportunities as long as the trendline holds, while the broader outlook points toward further gains.
Xauusdforexsignal

Gold Approaches All-Time High with Strong Bullish MomentumAnalysis:
Gold (XAU/USD) is showing strong bullish momentum after breaking through the buy zone around the $3,450 level. Price action has respected the ascending channel and successfully pushed above key resistance levels.
Currently, gold is trading at $3,473, with the next major target set at the all-time high (ATH) of $3,550, as highlighted on the chart. The breakout above the consolidation zone suggests continued buyer strength, supported by high trading volume.
If the bullish momentum sustains, we can expect a new ATH around $3,550+, while a failure to hold above $3,450 may bring a short-term pullback toward $3,400 – $3,346 support levels.
Overall, sentiment remains bullish, and gold looks ready to test higher highs if momentum continues.
Would you like me to also create a trade plan (entry, stop loss, take profit levels) for this setup?

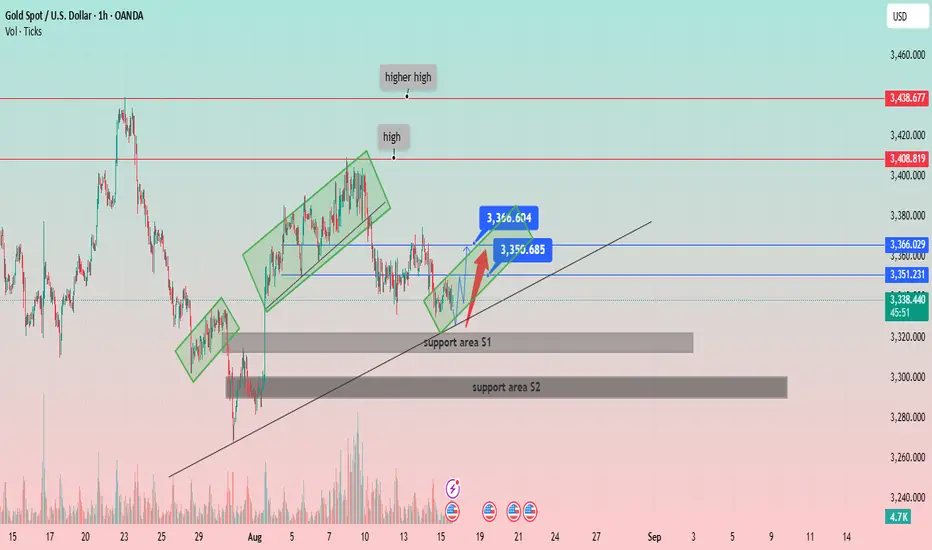
XAU/USD: Navigating the Uptrend and Key Support LevelsPrice Structure: Gold has been forming a series of higher highs and higher lows, indicative of a general uptrend. The chart labels a "high" and a "higher high," confirming this bullish structure.
Support and Resistance:
Two key support areas are identified:
Support area S1: A narrow zone around 3,320 USD. The price recently bounced off this area.
Support area S2: A broader, more significant zone around 3,290 USD, which appears to have been a strong support level in the past.
Several horizontal resistance levels are marked:
Immediate resistance: Around 3,351.231 USD and 3,366.029 USD.
Higher resistance: At 3,408.819 USD and 3,438.677 USD.
Channels and Trendlines:
The price has been moving within a series of ascending channels (highlighted in green rectangles), suggesting a stair-step upward movement.
A primary ascending trendline (black line) serves as a long-term support, with the price currently hovering just above it.
Recent Price Action and Projections:
The price recently broke out of a small downtrend and is showing signs of recovery from the "support area S1."
A potential price path is drawn with a red arrow, indicating a possible move towards the immediate resistance levels around 3,351 USD and 3,366 USD.
The chart highlights two specific price points, 3,360.604 USD and 3,350.685 USD, which likely represent a short-term trading range or target.
Volume: The volume spikes visible at key price points (e.g., at the low on July 30 and during the recent drop) indicate strong market activity.
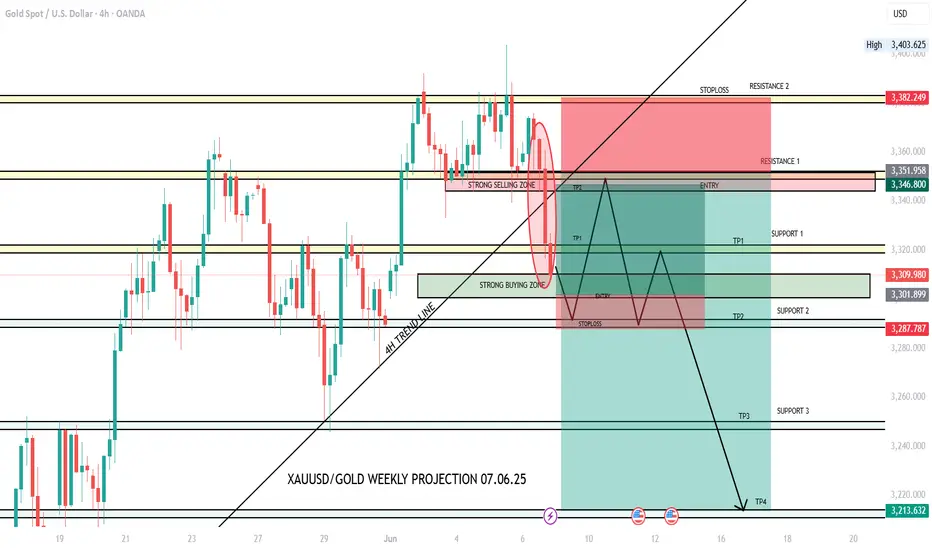
XAUUSD/GOLD WEEKLY PROJECTION 07.06.25Strong Selling Zone: Area near the top, where price has been rejected multiple times.
Strong Buying Zone: Area near the bottom, suggesting demand or potential price support.
Trend Line: Uptrend line intersecting around the strong buying zone — potential bounce area.
Resistance & Support Levels:
Resistance 1 & 2
Support 1, 2, & 3
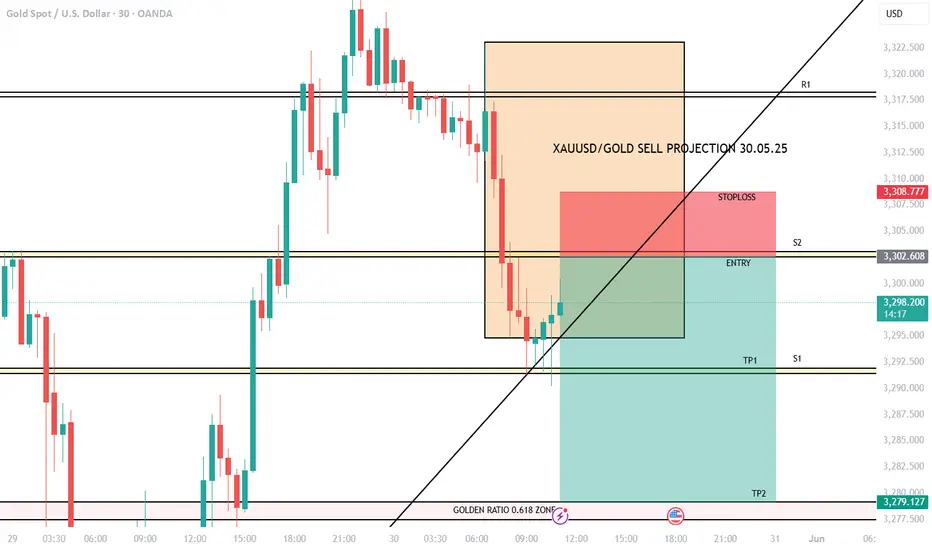
XAUUSD/GOLD SELL PROJECTION 30.05.25The red zone above the entry point marks the risk (stop loss), while the larger green zone below indicates the potential reward (profit targets TP1 and TP2), implying a favorable risk-to-reward ratio.
GOLD SHOWING A GOOD UP MOVE WITH 1:10 RISK REWARD GOLD SHOWING A GOOD UP MOVE WITH 1:10 RISK REWARD
DUE TO THESE REASON
A. its following a rectangle pattern that stocked the market
which preventing the market to move any one direction now it trying to break the strong resistant lable
B. after the break of this rectangle it will boost the market potential for break
C. also its resisting from a strong neckline the neckline also got weeker ald the price is ready to break in the outer region
all of these reason are indicating the same thing its ready for breakout BREAKOUT trading are follws good risk reward
please dont use more than one percentage of your capitalfollow risk reward and tradeing rules
that will help you to to become a bettertrader
thank you

XAUUSD/GOLD WEEKLY PROJECTION 03.03.25A primary reason for gold price falls is a strong US dollar, as gold has an inverse relationship with the dollar, meaning when the dollar strengthens, gold prices tend to decrease; other factors include rising interest rates, which can make alternative investments more attractive to investors, leading to decreased demand for gold, and a stable economic environment that reduces the need for gold as a safe haven asset

XAUUSD WEEKLY BUY PROJECTION its price increases in response to events that cause the value of paper investments, such as stocks and bonds, to decline.

Gold Trading Strategy for 20th November 2024Gold Trading Signal
Current Price: ₹2632.20
Trading Levels:
Buy Above: ₹2640
Trigger a long position when the price closes above ₹2640 on a 1-hour candle.
Resistance Levels:
₹2665 (Initial Resistance)
₹2693 (Next Resistance)
Sell Below: ₹2620
Trigger a short position when the price closes below ₹2620 on a 1-hour candle.
Support Levels:
₹2598 (Initial Support)
₹2585 (Next Support)
Key Notes:
Monitor price action carefully around the buy and sell levels.
Ensure proper risk management by setting stop-loss orders slightly above or below resistance and support levels, respectively.
Consider additional confirmations such as volume or RSI divergences before entering trades.
Disclaimer:
This analysis is for educational and informational purposes only. It is not financial advice or a recommendation to trade. Trading in the financial markets involves substantial risk and may not be suitable for all investors. Past performance is not indicative of future results. Always consult with a qualified financial advisor before making trading decisions.

Gold Trading Strategy for 13th November 2024Gold Trading Strategy: Buy Above 2,605 / Sell Below 2,589
Current Price: 2,599.00 USD
Key Levels:
Buy Signal: If the price closes above 2,605 on the one-hour candle, it indicates a potential upward trend, suggesting a good time to consider buying.
Sell Signal: If the price closes below 2,589 on the one-hour candle, it suggests a potential downward trend, indicating it might be a good time to consider selling.
Market Analysis:
The current price is hovering around 2,599.00 USD, just below the buy signal level.
The market is showing signs of bullish momentum, but it's important to monitor the price closely, especially around the 2,590 to 2,605 levels, which could act as support or resistance.
Recommendations:
Buy: If the price sustains above 2,605 on the one-hour candle close, consider entering long positions. Book profit at regular intervals or use a trailing stop loss to protect your profit, with targets at 2,625 and 2,640.
Sell: If the price breaks below 2,589 on the one-hour candle close, consider short positions. Book profit at regular intervals or use a trailing stop loss to protect your profit, with targets at 2,575 and 2,560.
Disclaimer: This is only for educational purposes. You may do your own analysis before taking any trading decisions.

Gold levels for Trading Day 5th November 2024Gold Trading Strategy: Buy Above 2,744 / Sell Below 2,723
Current Price: 2,733.00 USD
Key Levels:
Buy Signal: If the price closes above 2,744 on the one-hour candle, it indicates a potential upward trend, suggesting a good time to consider buying.
Sell Signal: If the price closes below 2,723 on the one-hour candle, it suggests a potential downward trend, indicating it might be a good time to consider selling.
Market Analysis:
The current price is hovering around 2,733.00 USD, just above the sell signal level.
The market is showing signs of bearish momentum, but it's important to monitor the price closely, especially around the 2,4200 to 2,4250 levels, which could act as support.
Recommendations:
Buy: If the price sustains above 2,744 on the one-hour candle close, consider entering long positions with targets at 2,760 and 2,780.
Sell: If the price breaks below 2,723 on the one-hour candle close, consider short positions with targets at 2,700 and 2,680.
Disclaimer: This is only for educational purposes. You may do your own analysis before taking any trading decisions.

GOLD SHOWING A GOOD UP MOVE WITH 1:5 RISK REWARD GOLD SHOWING A GOOD UP MOVE WITH 1:5 RISK REWARD
DUE TO THESE REASON
A. its following a rectangle pattern that stocked the market
which preventing the market to move any one direction now it trying to break the strong resistant lable
B. after the break of this rectangle it will boost the market potential for break
C. also its resisting from a strong neckline the neckline also got weeker ald the price is ready to break in the outer region
all of these reason are indicating the same thing its ready for breakout BREAKOUT trading are follws good risk reward
please dont use more than one percentage of your capitalfollow risk reward and tradeing rules
that will help you to to become a bettertrader
thank you

GOLD SHOWING A GOOD UP MOVE WITH 1:10RISK REWARD GOLD SHOWING A GOOD UP MOVE WITH 1:10 RISK REWARD
DUE TO THESE REASON
A. its following a rectangle pattern that stocked the market
which preventing the market to move any one direction now it trying to break the strong resistant lable
B. after the break of this rectangle it will boost the market potential for break
C. also its resisting from a strong neckline the neckline also got weeker ald the price is ready to break in the outer region
all of these reason are indicating the same thing its ready for breakout BREAKOUT trading are follws good risk reward
please dont use more than one percentage of your capitalfollow risk reward and tradeing rules
that will help you to to become a bettertrader
thank you

XAUUSD SHOWING A GOOD DOWN MOVE WITH 1:7 RISK REWARDXAUUSD SHOWING A GOOD DOWN MOVE WITH 1:7 RISK REWARD
DUE TO THESE REASON
A. its following a rectangle pattern that stocked the market
which preventing the market to move any one direction now it trying to break the strong resistant lable
B. after the break of this rectangle it will boost the market potential for break
C. also its resisting from a strong neckline the neckline also got weeker ald the price is ready to break in the outer region
all of these reason are indicating the same thing its ready for breakout BREAKOUT trading are follws good risk reward
please dont use more than one percentage of your capitalfollow risk reward and tradeing rules
that will help you to to become a bettertrader
thank you
XAUUSD SHOWING A GOOD DOWN MOVE WITH 1:7 RISK REWARD
DUE TO THESE REASON
A. its following a rectangle pattern that stocked the market
which preventing the market to move any one direction now it trying to break the strong resistant lable
B. after the break of this rectangle it will boost the market potential for break
C. also its resisting from a strong neckline the neckline also got weeker ald the price is ready to break in the outer region
all of these reason are indicating the same thing its ready for breakout BREAKOUT trading are follws good risk reward

A decending triangle patterns showing on XAUUSD WITH 1:10 RRA decending triangle patterns showing on XAUUSD
A short term 15m tradeing setup showing on gold
Selling setup
With a risk reward ratio of 1:10
The setup giving clarity to selling because in longterm it's a Down TREND
Also in a pick top lable
And forming a DOWN setup
So according to the combine results of
15minit 1hour and daily chat
And the short term setup
All are of them indicating the same SELLING SETUP
A decending triangle patterns showing on XAUUSD
A short term 15m tradeing setup showing on gold
Selling setup
With a risk reward ratio of 1:10
The setup giving clarity to selling because in longterm it's a Down TREND
Also in a pick top lable
And forming a DOWN setup
So according to the combine results of
15minit 1hour and daily chat
And the short term setup
All are of them indicating the same SELLING SEUP

GOLD SETUP TRADE WIH 1:5 RISK REWARDGOLD SETUP TRADE WIH 1:5 RISK REWARD
A good selling setup detected on XAUUSD
It's showing a BULL MOVE due to these reason
1. It's following THE 60 M trendline here
2. It's ready to break the neckline
3. In day chat it's showing the heavy bullish pressure
Just grab out will your own risk
4. also in day chat its showing its trying to break the 1d big trendline
it will consolidate here but after breakout the upcoming move will be OSM
With a small amount
Stay connected
Stay happy
Bande mataram
GOLD SETUP TRADE WIH 1:6 RISK REWARD
A good selling setup detected on BTCUSD
It's showing a BULL MOVE due to these reason
1. It's following THE 60 M trendline here
2. It's ready to break the neckline
3. In day chat it's showing the heavy bullish pressure
Just grab out will your own risk
With a small amoun4. also in day chat its showing its trying to break the 1d big trendline
it will consolidate here but after breakout the upcoming move will be OSM
With a small amountt
Stay connected
Stay happy
Bande mataram

GOLD SETUP TRADE WIH 1:10 RISK REWARDGOLD SETUP TRADE WIH 1:10 RISK REWARD
A good BUYING setup detected on XAUUSD
It's showing a BULL MOVE due to these reason
1. It's following THE 60 M trendline here
2. It's ready to break the neckline
3. In day chat it's showing the heavy bullish pressure
Just grab out will your own risk
4. also in day chat its showing its trying to break the 1d big trendline
it will consolidate here but after breakout the upcoming move will be OSM
With a small amount
Stay connected
Stay happy
Bande mataram
GOLD SETUP TRADE WIH 1:10 RISK REWARD
A good buying setup detected on gold
It's showing a BULL MOVE due to these reason
1. It's following THE 60 M trendline here
2. It's ready to break the neckline
3. In day chat it's showing the heavy bullish pressure
Just grab out will your own risk
Stay happy

LONGTERM GOLD BUY SETUP TRADE WIH 1:10 RISK REWARDGOLD SETUP TRADE WIH 1:10 RISK REWARD
A good selling setup detected on XAUUSD
It's showing a BULL MOVE due to these reason
1. It's following THE 60 M trendline here
2. It's ready to break the neckline
3. In day chat it's showing the heavy bullish pressure
Just grab out will your own risk
With a small amount
Stay connected
Stay happy
Bande mataram
GOLD SETUP TRADE WIH 1:10 RISK REWARD
A good selling setup detected on GOLD
It's showing a BULL MOVE due to these reason
1. It's following THE 60 M trendline here
2. It's ready to break the neckline
3. In day chat it's showing the heavy bullish pressure
Just grab out will your own risk
With a small amount
Stay connected
Stay happy
Bande mataram

GOLD SETUP TRADE WIH 1:6 RISK REWARDGOLD SETUP TRADE WIH 1:5 RISK REWARD
A good selling setup detected on XAUUSD
It's showing a BULL MOVE due to these reason
1. It's following THE 60 M trendline here
2. It's ready to break the neckline
3. In day chat it's showing the heavy bullish pressure
Just grab out will your own risk
With a small amount
Stay connected
Stay happy
Bande mataram
GOLD SETUP TRADE WIH 1:6 RISK REWARD
A good selling setup detected on BTCUSD
It's showing a BULL MOVE due to these reason
1. It's following THE 60 M trendline here
2. It's ready to break the neckline
3. In day chat it's showing the heavy bullish pressure
Just grab out will your own risk
With a small amount
Stay connected
Stay happy
Bande mataram

GOLD SETUP TRADE WIH 1:8 RISK REWARDGOLD SETUP TRADE WIH 1:8 RISK REWARD
A good falling detected on GOLD
It's showing a fall due to these reason
1. It's following THE 1H trendline here
2. It's ready to break the neckline
3. In day chat it's showing the heavy bearish pressure
Just grab out will your own risk
With a small amount
Stay connected
Stay happy
Bande mataram
Follow for more
GOLD SETUP TRADE WIH 1:8 RISK REWARD
A good falling detected on GOLD
It's showing a fall due to these reason
1. It's following THE 30 M trendline here
2. It's ready to break the neckline
3. In day chat it's showing the heavy bearish pressure
Just grab out will your own risk
With a small amount
Stay connected
Stay happy
Bande mataram
Follow for more

27TH GOLD PREDICTION As of June 27, 2024, the price of gold (XAU/USD) is trading at about $2,299, showing a bearish trend. This recent decline in gold prices can be attributed to factors such as increased USD buying and the anticipation of future rate cuts by the Federal Reserve. Despite this bearish momentum, key support levels remain at $2,300 and $2,287, while resistance is noted at $2,319.43. The 50-day and 200-day EMAs (Exponential Moving Averages) at $2,319.43 and $2,331.28 are critical levels for a potential bullish reversal.
Here is the strategy signal today for selling:
SELL XAUUSD 2318-2325
SL 2327
TP 2300

GOLD DAILY ANALYSISGo through the analysis carefully, and do trade accordingly.
SHUBHAM_FX 'BIAS for the DAILY.
Current price- 2150
"if Price stay above 2172 then next target is 2200 and 2250 and above that 2310.
"if Price stay below 2165 then next target is 2130 and 2112 and below that 2088.
-POSSIBILITY-1
Wait (as geopolitical situation are worsening )
-POSSIBILITY-2
Wait (as geopolitical situation are worsening)
Best of luck
Never risk 2% of principal to follow any position.
Support us by liking and sharing the post.
