Elliott Wave Analysis – XAUUSD Trading Plan | June 2, 2025
🌀 Current Wave Structure
On the H1 timeframe, wave 2 (black) appears to have completed as a zigzag pattern, with price reacting strongly after touching the 3272 level — signaling that the abc corrective wave (green) may be finished.
Zooming into the M10 timeframe, the recent rally shows a 5-wave leading diagonal, indicating that wave 1 (red) is complete.
Currently, price is in the pullback phase of wave 2 (red).
📍 The ideal correction zone for wave 2 (red) is around 3281, which is our key area to look for Buy opportunities.
However, if price breaks below 3272, this wave count becomes invalid, and we’ll wait for a new setup aligned with deeper correction.
🔋 Momentum Outlook
• D1: Momentum is preparing to turn bullish ⇒ supports the start of wave 3 (black) and a bullish outlook for the week
• H4: Momentum is bottoming and about to reverse ⇒ supports wave 3 (red) forming in upcoming sessions
• H1: Currently declining ⇒ expect early-session pullback. Watch for bullish reversal signals as long as 3272 holds for potential entries
✅ Trade Setup
🎯 BUY ZONE: 3282 – 3279
🛑 Stop Loss: 3272
🎯 Take Profits:
• TP1: 3308
• TP2: 3324
• TP3: 3346
⏳ Note: Price action around the 3272–3281 zone will be key to confirming whether wave 2 (red) is complete.
If confirmed, wave 3 could begin with strong momentum — especially after breaking above 3296.
Xauusdidea

Elliott Wave Analysis – XAUUSD H1 30/05/2025
🔍 Wave Structure Update
As of now, price has broken above the X wave high and is undergoing a retracement. This is a positive signal, suggesting that Wave 1 (black) of the larger green impulsive wave may have completed. Currently, price is likely in Wave 2 (black) – offering a good opportunity to position for the upcoming Wave iii (green).
Within Wave 2, we expect classic corrective structures such as zigzag or flat to form. Based on current price action, a short-term bounce followed by another leg down is anticipated to complete the corrective phase.
🎯 Potential Wave 2 Target Zones
• Target 1: 3290
• Target 2: 3272
❗ If price drops further to 3245, the assumption that Wave 2 has ended may be invalid. In that case, the broader correction could continue toward 3215 (Wave Y target).
📈 Momentum Outlook
D1 Chart: Momentum shows signs of reversal to the upside – supporting a bullish bias for the coming week.
H4 Chart: Momentum is weakening, suggesting price may move sideways or pull back today as part of Wave 2 development.
H1 Chart: Currently oversold, indicating a likely short-term bounce or sideways movement to maintain this oversold condition until H4 also reaches oversold.
🧭 Trading Plan
🔹 Scalp Buy
• Entry: 3291 – 3289
• SL: 3286
• TP1: 3306
• TP2: 3324
• TP3: 3346
🔹 Main Buy Zone
• Entry: 3272 – 3269
• SL: 3262
• TP1: 3290
• TP2: 3324
• TP3: 3373

Elliott Wave Analysis – XAUUSD H1 Timeframe 29/05/2025🔍 Current Wave Structure
Price is currently correcting within a WXY structure, also known as a double zigzag. At the moment, the market is progressing through wave Y, with two potential targets:
🎯 Target 1: 3245 – already reached, and price has bounced sharply from this zone.
🎯 Target 2: 3215 – a deeper target, requiring further confirmation from price action and real-time momentum.
📈 If wave Y has already ended at 3245, the market may now be in wave 1 of a new bullish cycle. Once wave 1 completes, we’ll look for wave 2, which typically offers a prime entry point for wave 3.
👉 Wave 2 often forms as a zigzag or flat correction. Using Fibonacci confluence and liquidity zones, the potential wave 2 pullback area is 3265 – 3262.
⚡️ Momentum Outlook
🕯 D1: Momentum is entering oversold territory → high probability of bullish reversal today or tomorrow.
🕯 H4: Reversal setup is forming; current H4 candle closes in just over an hour → watch for confirmation.
🕯 H1: Momentum is rising. Wait for a pullback in H1, followed by renewed bullish momentum without breaking below 3245 — that’s likely the end of wave 2 and the entry point for wave 3.
📌 Important Note:
If H4 momentum reverses downward and price fails to break above 3324, it could signal a continuation of the broader downtrend, with 3215 remaining as the next wave Y target.
🛒 Trade Setu p
BUY ZONE: 3265 – 3262
Stop Loss: 3255
Take Profits:
• TP1: 3290
• TP2: 3324
• TP3: 3346
❗️ If price breaks below 3245, it would confirm that wave Y is still in progress. In that case, monitor the 3215 zone for a new buying opportunity.

XAUUSD/GOLD SELL PROJECTION 29.05.25R1 (Resistance): Just above entry, marking the recent high.
S1 & S2 (Support levels): Intermediate levels where price might pause or bounce.
Low Zone: Aligns with TP2, marking a significant potential support zone.

Elliott Wave Analysis – XAUUSD Trading Plan – 28th May 2025
🔍 Current Wave Structure
After a sharp drop yesterday, price has mildly recovered and is now consolidating around the 3314 zone. The correction has nearly reached the target of wave C (green). However, the current rebound is weak, marked by small, overlapping H1 candles — suggesting the bullish structure is not yet convincing.
At this point, we’re tracking two main scenarios:
✅ Scenario 1 – Correction Completed
Wave C seems complete, and price might be starting a new bullish trend.
That said, the overlapping candles on H1 could also indicate the formation of a leading diagonal for wave 1.
In this case, wave 2 is likely to be a strong retracement — typically forming as a zigzag or flat correction.
📌 Strategy:
Wait for wave 2 to complete before looking for a better buy opportunity.
🌀 Scenario 2 – Correction Still in Progress
If the price continues to move slowly or goes sideways, we could be in wave b of a double zigzag correction (wave Y).
🎯 Wave c within wave Y may target 3324.
However, if price breaks below 3284 before hitting 3324, it would likely mean wave c has started, with an expected end near 3280–3274.
📈 Momentum Outlook
D1: Momentum remains bearish ⇒ primary trend still points downward.
H4: Momentum is currently rising ⇒ we may see a temporary recovery today.
H1: Approaching oversold ⇒ if reversal signals appear, short-term buy setups may emerge.
🎯 Trade Plan for Today (28/05/2025)
🔹 Buy Scalp
Entry: 3292 – 3289
SL: 3282
TP1: 3313
TP2: 3324
🔹 Buy Swing
Entry: 3280 – 3277
SL: 3270
TP1: 3290
TP2: 3313
TP3: 3324
🕰️ Expected timing: From London session through New York close
🔸 Sell Zone
Entry: 3324 – 3327
SL: 3334
TP1: 3313
TP2: 3290
TP3: 3280
🕰️ Ideal entry: If price hits resistance during US session or late London
📌 All scenarios will be updated as soon as wave 2 completes or if price clearly breaks below 3284.
Be patient — let the market confirm before taking action.
XAUUSD/GOLD 30MIN SELL PROJECTION 28.05.25Bias: Bearish (Sell)
Pattern Identified: Evening Star (Bearish Reversal Pattern)
Entry Zone: Around 3,318.4 (just below the resistance marked S2)
Stop Loss: Just above the high of the Evening Star (~3,323.7)
Take Profits:
TP1: Around 3,311.0
TP2: Around 3,303.9 (near support S1)

Elliott Wave Analysis – XAUUSD Trading Plan – 27th May 2025
📊 Wave Structure – XAUUSD – H1 Timeframe
Price is likely in a corrective phase — wave iv (orange) — after completing five internal green waves within wave iii.
During this correction, we’ve seen an abc zigzag form, followed by an unclear upward bounce. This gives rise to two key scenarios:
🔸 Scenario 1: Wave iv is complete
The abc pattern is finished, and price appears to be forming an initial triangle structure. We could currently be in wave 2.
👉 A breakout and H1 candle close above 3343 would confirm the start of a new uptrend. In this case, prefer buying on dips.
🔸 Scenario 2: Zigzag correction is still ongoing
Wave X seems complete, and price may now be developing wave Y — either as another abc or triangle.
👉 This scenario gets confirmed if price breaks below the wave c (green) low at 3324.
🎯 Wave Y downside targets (based on Fibonacci + Volume Profile):
• Target 1: 3317
• Target 2: 3290
🔍 Momentum Analysis
D1 Momentum has already confirmed bearish → Downside pressure likely to persist through the week.
H4 Momentum is currently rising → Price could see a short-term rally or sideways action today.
H1 Momentum is nearing oversold → We wait for it to flip to overbought. If price fails to break 3349, there may be room for a scalp sell.
However, if 3349 is broken, wave X could extend further — or it might mark the start of a new bullish leg. We’ll reassess accordingly.
📌 Trade Plan
Buy Zone: 3317 – 3314
Stop Loss: 3307
Take Profit 1: 3334
Take Profit 2: 3373
✅ Only execute if H1 momentum shifts bullish.
❗ If this zone breaks, next buy opportunity lies around 3290.

Elliott Wave Analysis – XAUUSD – Plan for May 27, 2025📊 Price is likely in the middle of a wave iv (orange) correction, following the completion of a 5-wave structure (green) that formed wave iii.
During this correction, an ABC zigzag pattern has already formed. The recent upward move remains unclear, which opens up two possible scenarios:
🔸 Scenario 1 – Wave iv is completed
The ABC structure looks complete. Price appears to be forming a leading diagonal, currently in wave 2.
A confirmed breakout above 3343 with a candle close would validate a new bullish trend → favoring Buy entries in line with the larger trend.
🔸 Scenario 2 – Ongoing zigzag correction (double structure)
Wave X has completed, and price may now be developing wave Y (either an ABC or triangle pattern).
This scenario is confirmed if price breaks below wave c (green) at 3324.
🎯 Wave Y Target Zones (based on Fibonacci + Volume Profile):
• Target 1: 3317
• Target 2: 3290
🔍 Momentum Outlook:
• Daily (D1): Bearish momentum confirmed → downside likely to dominate into the end of the week
• H4: Momentum rising → short-term bounce or consolidation expected today
• H1: Near oversold → watch for bullish reversal.
If price fails to break above 3349, scalp shorts may be considered.
However, a break above 3349 could mean wave X continues as an extended ABC, or a new bullish trend has started — to be updated accordingly.
📌 Trading Plan:
Buy Zone: 3317 – 3314
Stop Loss: 3307
Take Profit 1: 3334
Take Profit 2: 3373
✅ Only enter on H1 bullish momentum reversal
❗ If this zone fails, watch for the next Buy opportunity near 3290

XAUUSD/GOLD 4H BUY PROJECTION 25.05.25🟢 Overall Bias: BUY Projection
The chart suggests a bullish outlook, predicting that gold will rise significantly after a breakout and retest pattern.
🔍 Key Technical Elements:
Trendlines:
4H Downtrendline: This was a significant resistance trendline that has now been broken.
4H Uptrendline: Indicates a recent shift to bullish momentum.
Support & Resistance Zones:
Support S1: A solid demand zone around 3,275–3,300 USD.
Immediate Support: Zone around 3,325 USD.
Resistance R1, R2, and R3: Key resistance levels.
R1: ~3,375 USD
R2: ~3,425 USD
R3 & ATH (All-Time High): ~3,500+ USD
Breakout Confirmation:
The price broke above the 4H Downtrendline and Resistance, and then retested that area successfully, confirming it as new support (highlighted by the box labeled "BREAKER RESISTANCE RETESTED AND BROKE TRENDLINE").
Change of Character:
Marked in the zone labeled "CHANGE OF CHARACTER APPEARED HERE", indicating a shift from bearish to bullish market structure.
📈 Price Projection:
The price is projected to move upwards through multiple resistance zones, eventually targeting the 3,500 USD+ region.
Arrows indicate a bullish path with minor pullbacks, moving towards:
Resistance R1 → Resistance R2 → Resistance R3 (ATH).
🟥🟩 Risk Management:
Stop-Loss Zone (Red Area): Below 3,300 USD – in case the breakout fails and the price re-enters the downtrend.
Target Zone (Green Area): Extends to 3,500+ USD – aligning with historical highs.

Elliott Wave Analysis – Plan XAUUSD 23/5/2025At the moment, we’re monitoring two possible wave scenarios:
🔸 Scenario 1 – ABC Correction Completed
The bullish move from the 3123 zone to the current price may have formed a completed ABC corrective structure (labeled on the top-left of the chart).
If this scenario is correct, the correction has ended and the market is now entering a new 5-wave bearish impulse.
Within this structure:
• Wave 1 is already completed
• Price is currently retracing as Wave 2
This view is supported by the strong reaction around the 3247 zone.
📍 Ideal target for Wave 2: around 3325
🔸 Scenario 2 – Bullish 5-Wave Structure in Progress
A potential impulsive structure with waves 1-2-3-4-5 is currently labeled on the chart.
In this count:
• Wave 3 (yellow) has completed
• The market is now in Wave 4 (yellow)
Wave 4 appears to be unfolding as an A-B-C corrective pattern:
• Wave A has completed
• Price is now forming Wave B (black)
✅ This scenario requires a daily close above 3247 for confirmation.
📍 Target for Wave B: also near 3325
🔎 Momentum Analysis
• Daily (D1): Overbought – the uptrend is weakening → likely a larger corrective move ahead
• H4: Momentum rising → favors a short-term bullish bounce
• H1: Momentum just flipped bullish → current rally may extend further
📌 Trade Plan (for both scenarios):
SELL ZONE: 3325 – 3328
Stop Loss: 3335
Take Profit 1: 3279
Take Profit 2: 3247
📈 Wait for price action around the 3325 zone to confirm which scenario plays out.

XAUUSD/GOLD 30 MIN SELL PROJECTION 20.05.25The price is expected to rise into the entry zone.
If the setup holds, it should reject from this resistance and fall toward TP1.
A deeper push would target TP2, with the golden ratio zone acting as a potential reaction area.

XAUUSD/GOLD 15 MIN BUY PROJECTION 19.05.25Entry Zone: Around 3,216.325
Breakout + Retest Zone: Around 3,212.500
Stoploss: Just below 3,210.000 (specifically marked at 3,209.969)
TP1 (Take Profit 1): Around 3,230.000

XAUUSD/GOLD BUY PROJECTION 19.05.25Entry Point: Around 3,216 (marked as "ENTRY + SUPPORT 2")
Stop Loss: Just below 3,191.916
Take Profit Levels:
TP1 (R1): ~3,260
TP2 (R2): ~3,285
TP3 (R3): ~3,340
TP4 (R4): ~3,383.921

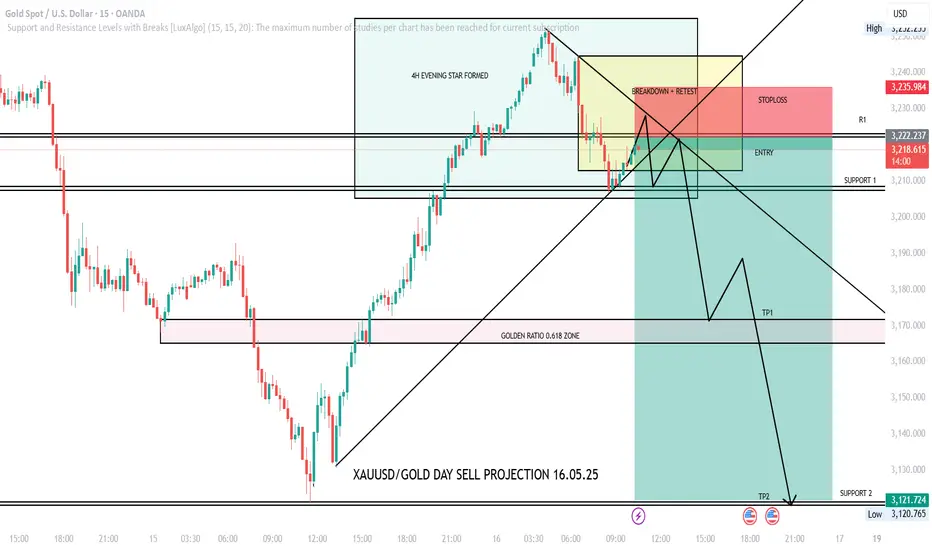
XAUUSD/GOLD DAY SELL PROJECTION 16.05.25📉 Sell Setup Overview:
Pattern Identified:
4H Evening Star — a bearish reversal pattern indicating potential downside.
Trade Setup:
Entry Zone: Around 3,219.970
Stop Loss: Above 3,235.984
Targets:
TP1 (Take Profit 1): Around 3,170.000 (Golden Ratio 0.618 zone)
TP2: Around 3,121.724 (near Support 2)
Technical Zones:
Breakdown + Retest zone highlighted in yellow (indicating confirmation of bearish reversal).
Golden Ratio (0.618) support/fib zone — used as a significant level for TP1.
Support 1 and Support 2 are drawn as potential price stalling or reversal zones.
XAUUSD SHOWING A GOOD DOWN MOVE WITH 1:10 RISK REWARD XAUUSD SHOWING A GOOD DOWN MOVE WITH 1:10 RISK REWARD
DUE TO THESE REASON
A. its following a rectangle pattern that stocked the market
which preventing the market to move any one direction now it trying to break the strong resistant lable
B. after the break of this rectangle it will boost the market potential for break
C. also its resisting from a strong neckline the neckline also got weeker ald the price is ready to break in the outer region
all of these reason are indicating the same thing its ready for breakout BREAKOUT trading are follws good risk reward
please dont use more than one percentage of your capitalfollow risk reward and tradeing rules
that will help you to to become a bettertrader
thank you

XAUUSD/GOLD WEEKLY SELL PROJECTION 10.05.25From easing tariffs to strong labor data, multiple factors are shaping gold's short-term corrections. Gold prices fall as US jobs data beats expectations and trade talks ease global tension. Spot gold slips from record highs amid China's holiday, but long-term support remains strong

XAUUSD
ALWAYS TAKE TRADE WITH CONFIRMATION
Note : Trading in any financial market is very risky. I post ideas for educational purpose only. It is not financial advice. Do not hold us responsible for any potential loss you may incur. Please consult your financial adviser before trading.

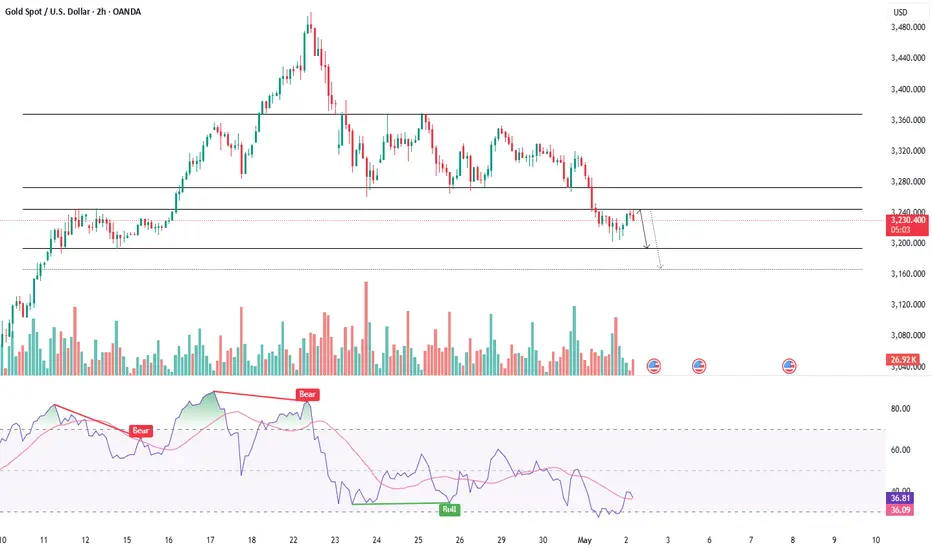
GOLD LOSES ITS SHINE - DISTRIBUTION PHASE BEGINSSymbol - XAUUSD
CMP - 3244
Gold breaks below 3270, entering a distribution phase amid a strengthening US dollar. The market appears to be in the early stages of a potential trend reversal.
On Thursday, gold remained under sustained pressure, trading at a two-week low, as market sentiment responded to statements by President Trump regarding potential trade agreements with multiple countries, including China. Growing optimism surrounding trade negotiations is enhancing risk appetite, thereby diminishing demand for gold as a traditional safe-haven asset. Notably, even weak US GDP and inflation figures failed to support gold prices, as investor focus remains firmly on trade developments and upcoming labor market data.
Gold's price trajectory is shifting due to the strengthening of the dollar and evolving macroeconomic fundamentals. A break below the recent local low could further reinforce the downward momentum. The initial downside target is set at 3190. A potential retest of the previously breached consolidation support at 3268 may occur before the downward movement resumes.
Resistance levels: 3245, 3270
Support levels: 3190, 3186, 3167
A break below the local low of 3221 could act as a catalyst for a deeper decline, with 3190 as the initial target. A retest of the 3245–3270 resistance range cannot be ruled out prior to the continuation of the downtrend.
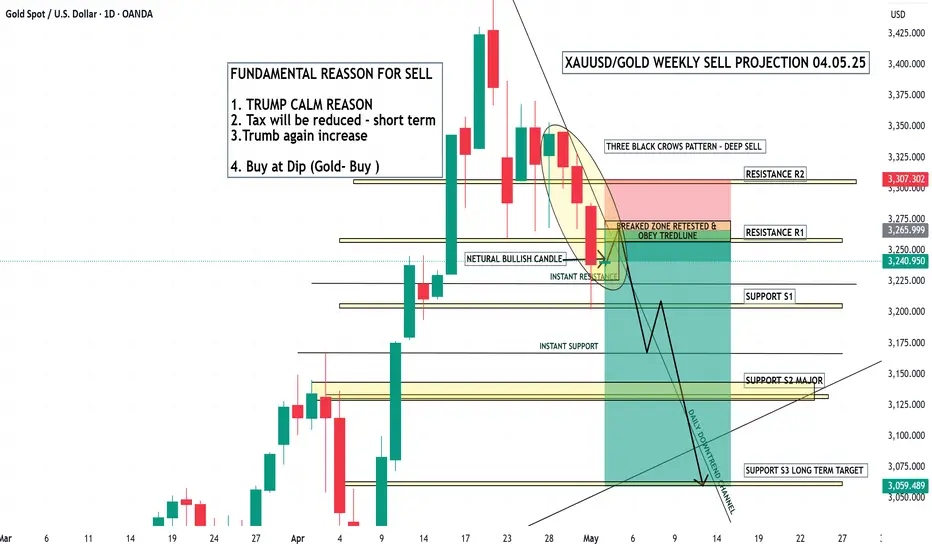
XAUUSD/GOLD WEEKLY SELL PROJECTION 04.05.25Leaving technical factors aside, in layman's view, gold is falling because investors have realized the high valuation of gold compared to other precious metals and are booking profits.1 day ago
WAITING GAME - GOLD STUCK IN A HOLDING PATTERNSymbol - XAUUSD
CMP - 3307
Gold continues to consolidate within a defined range, with immediate attention on the 3370–3269 zone. With key economic data scheduled for release, the metal is expected to remain within this consolidation band for the next several sessions.
Renewed optimism surrounding US trade negotiations has lifted risk sentiment and strengthened the US dollar. The US Treasury Secretary reported constructive progress in discussions with India, while President Trump’s more measured rhetoric regarding China further supported the dollar. Meanwhile, investors are adopting a cautious, wait-and-see approach ahead of the release of first-quarter US GDP data. Should the data underwhelm, gold may experience a sharp uptick as safe-haven demand intensifies.
Overall, the gold market remains highly reactive to trade headlines and macroeconomic indicators, particularly amid anticipated portfolio adjustments at month-end. In the context of current momentum and corrective movement, a short-term recovery is anticipated from the 0.5–0.7 Fib zone. A possible retest of the 3323–3325 resistance area could precede a continuation of the correction within the prevailing consolidation structure.
Key Resistance Levels: 3323, 3352, 3370
Key Support Levels: 3290, 3270
Traders remain attentive to both the resolution of ongoing tariff disputes and the forthcoming economic releases. While price action remains confined within a consolidation pattern, a rebound from support is the base case scenario. However, if price action continues to compress toward either boundary - particularly toward support, the probability of a breakout from the consolidation base may increase accordingly.

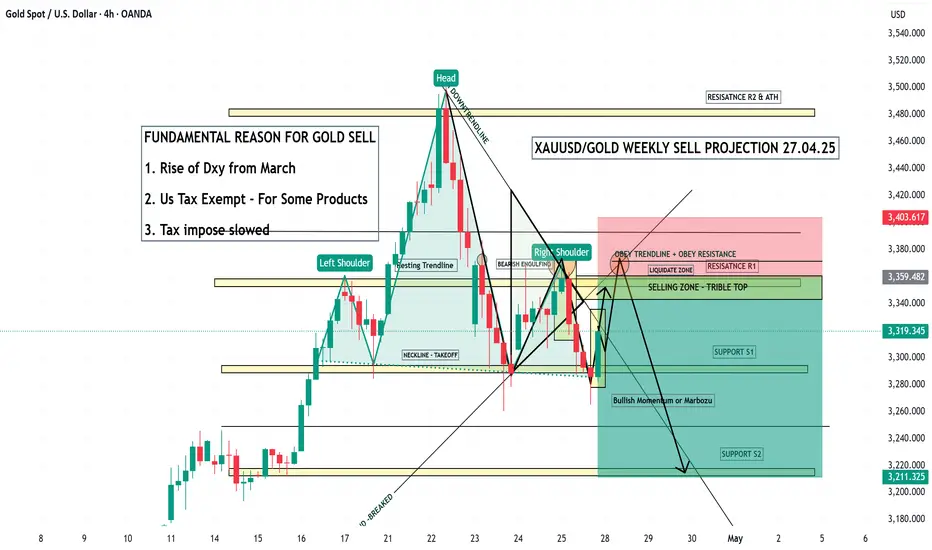
XAUUSD/GOLD WEEKLY PROJECTION 27.04.25Rise of the DXY (US Dollar Index) since March.
US Tax exemptions for some products.
Slower imposition of new taxes.
Technical Chart Summary:
Pattern: Head and Shoulders (classic bearish reversal setup).
Key Zones:
Selling Zone: Identified between Resistance R1 and Triple Top area.
Resistance Levels:
R1 near 3359–3400
Major resistance at around 3480–3500 (All-Time High zone).
XAUUSDOANDA:XAUUSD
As you can see that gold has created head and shoulder if the the drawn support was broken down side then we can go for sell side. plan your trade accordingly

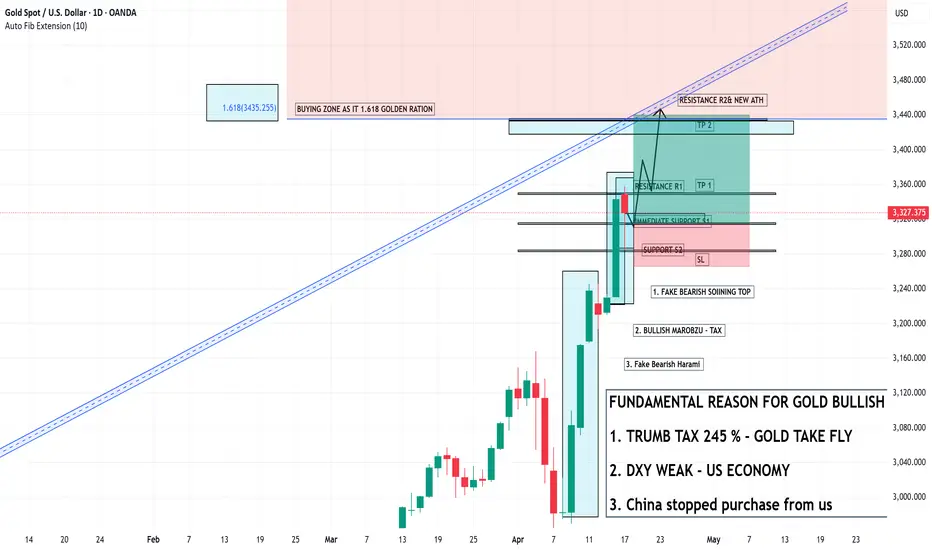
XAUUSD/GOLD WEEKLY PROJECTION 20.04.25Buying Zone around the 1.618 Golden Ratio (3435.255) – A classic Fibonacci extension target indicating a strong potential reversal or take-profit zone.
Price Movement Forecast:
Price is expected to test the Immediate Support (S1) and bounce back.
Resistance levels: R1, then R2 & New ATH (All-Time High).
Take Profits (TP1 & TP2): Clearly marked targets for bullish momentum continuation.
Candlestick Patterns:
Fake Bearish Spinning Top
Bullish Marubozu
Fake Bearish Harami
These patterns typically suggest false bearish signals and continuation of the uptrend.