The Unstoppable Rise of GoldTechnical Analysis (XAU/USD):
Gold is trading around $3,816, showing continued bullish strength along the upward trend line. Price has respected higher lows, confirming buyers remain in control. Key short-term support levels are visible at $3,797, $3,759, and $3,718. As long as price stays above the $3,718 zone (major support), the bullish structure remains intact.
The chart indicates two bullish scenarios:
A direct continuation higher from current levels.
A potential retest of the $3,797 – $3,759 zone before another push upward.
Upside targets in the coming sessions stand between $3,860 – $3,900, with further momentum potentially extending beyond $3,925.
Fundamental Analysis:
Safe-Haven Demand: Persistent geopolitical uncertainties and global economic slowdown fears are keeping gold attractive as a safe-haven asset.
Central Bank Policies: If the Fed maintains a dovish stance or signals rate cuts, real yields may decline, further boosting gold.
Inflation Hedge: Despite cooling in some regions, sticky inflation supports long-term gold demand.
Central Bank Purchases: Record gold buying by global central banks continues to provide a solid floor under prices.
Conclusion:
Gold remains in a strong bullish phase, with technicals showing steady upward momentum and fundamentals reinforcing demand. Any dips toward $3,759–$3,718 may offer buying opportunities as long as the trendline holds, while the broader outlook points toward further gains.
Xauusdidea

Elliott Wave Analysis XAUUSD – September 30, 2025📊
________________________________________
🔥 Momentum
• D1 timeframe:
Momentum is currently bullish. We have 3 consecutive bullish candles so far, meaning there may be only 1–2 more daily candles before momentum reaches the overbought zone → risk of reversal.
• H4 timeframe:
Momentum is stuck in the overbought zone with 4 consecutive bullish candles. This signals that the bullish force is weakening.
• H1 timeframe:
Momentum is reversing inside the overbought zone. This shows the bullish force is fading, and price may reverse downward within 1–2 hours.
________________________________________
🌊 Wave Structure
• D1 timeframe:
Price is moving inside the Elliott channel drawn from wave 2 – wave 4 and wave 3 (yellow).
There is not much room left before hitting the upper channel.
This matches D1 momentum and the second target zone of wave 5 (yellow).
• H4 timeframe:
As mentioned in the previous plan, price broke the old high at 3793, confirming wave 5 (purple).
However, H4 momentum has been overbought for 4 consecutive candles, signaling that wave 5 (purple) is nearing its end.
• H1 timeframe:
Currently forming a 5-wave structure (1–2–3–4–5) in black inside wave 5 (purple).
All timeframes are showing signals that price is approaching a major top.
Although the trend is still bullish, sharp pullbacks of over 100 pips happen frequently, making it very difficult to trade with tight stop-losses.
________________________________________
🎯 Key Price Levels
• Price is now testing the 2.618 Fibonacci extension of wave 1 (black) at 3865.
• Upper channels from D1, H4, and H1 converge around 3885.
👉 This is the critical area to look for reversal signals and consider a Sell entry.
________________________________________
📌 Trading Plan
• Swing trades: Be patient, wait for clear signals before entering.
• Scalp trades: Possible, but avoid holding positions too long.
• Risk management: Strictly apply safe trade management as price is at a potential top zone.

“Gold (XAU/USD) – Breakout Play from Resistance (1-Hour View)Chart Structure & Key Levels
You’ve drawn a resistance zone above current price. The label “this is the resistance area here if break we will hold” points to a horizontal resistance line or zone.
You also show a descending trendline acting as dynamic resistance.
On the lower side, you mark LL (Lower Low) and LH (Lower High) points, implying the prior structure was in a downtrend or consolidation.
Your trade setup (green = target area, red = stop area) suggests you are expecting a break above resistance and a move upward with three target levels:
• TP1 at ~ 3,759.74
• TP2 at ~ 3,779.03
• TP3 at ~ 3,799.67
What Your Setup Implies (and Risks)
Bullish Bias on Breakout
You are expecting that if price breaks above the resistance zone + trendline, that resistance may flip into support, allowing the price to rally further. This is a classic breakout reversal expectation.
If the breakout is confirmed (with strong candle close above, ideally with volume), then the path is “clearer” for your targets.
Stop / Risk Control
Your red zone (stop area) is placed below the resistance/trendline region. If price fails and falls back below this, your trade idea would be invalidated.
Target Levels Logic
TP1 is relatively conservative, just above resistance.
TP2 and TP3 stretch further to capture the upside momentum if the breakout has strength.
Additional Considerations & Technical Tips
Confirm the Breakout
Don’t just enter on a quick wick above resistance. Wait for a sustained close above the zone (on your timeframe) to reduce the chance of a false breakout.
Check volume: higher-than-average volume on the breakout gives it more credibility.
Watch for Retest
Often after a breakout, price returns to retest the broken resistance (which now may act as support). This retest can offer a better entry with lower risk.
Manage Risk Aggressively
The more distant your TP3, the more room for price to reverse. Consider scaling out of the trade (taking partial profits as price hits TP1, TP2) to lock in gains.
Keep an Eye on Macro / Fundamental Factors
Gold (XAU/USD) is sensitive to U.S. monetary policy, the strength of the U.S. dollar, inflation expectations, and geopolitical risk.
For example, stronger U.S. data or hawkish Fed statements could work against a bullish breakout in gold.
Divergences & Momentum Indicators
Use RSI / MACD / ADX to check whether momentum supports your breakout idea. If momentum is weak or showing divergence, be cautious.
Timeframe Alignment
Make sure that higher timeframes (4H, daily) are not giving strong bearish signals conflicting with your breakout bias on the 1-hour chart.

Elliott Wave Analysis XAUUSD – 28/09/2025
________________________________________
🔹 Momentum
• D1: Momentum is still declining → next week we may continue to see sideways movement or further downside following D1 momentum.
• H4: Momentum is also decreasing → on Monday, we expect a continuation of the downtrend.
• H1: Momentum is oversold and preparing to rise → during the Asian session on Monday, a short-term upward move is likely.
________________________________________
🔹 Wave Structure
• D1 timeframe:
o Price is still within wave 5 (yellow).
o If D1 momentum enters the oversold zone and then turns upward, but price remains sideways without reaching 3632, then wave 5 (yellow) may still extend toward the second target at 3887.
• H4 timeframe:
o A corrective WXY structure is forming.
o With H4 momentum turning down, it is likely that wave Y is unfolding.
• H1 timeframe:
o A declining ABC (blue) structure appeared, followed by a rising ABC (blue) structure toward 3784.
o Within this, wave B formed a triangle abcde (red).
o This shows two ABC (blue) corrective structures developing within the adjustment, suggesting multiple possibilities for wave Y:
1️⃣ Flat 3-3-5: Wave Y may unfold as a 5-wave sharp decline, with an ideal target around 3713 → this is the expected Buy zone.
2️⃣ Triangle: Price may consolidate sideways above 3718 → patience is required to wait for the pattern to complete.
3️⃣ Large-scale Triangle: If the entire correction is a triangle, price will also sideway above 3718 → wait for completion before acting.
• Note: If price breaks above 3792, it may confirm that the corrective structure is complete → next upside target would be 3810.
________________________________________
🔹 Trade Plan
• Buy Zone: 3714 – 3711
• SL: 3703
• TP: 3733
________________________________________
👉 Conclusion:
The optimal approach is to wait for confirmation:
• Either the triangle structure completes,
• Or price declines into the 3713 – 3711 zone to set up a Buy entry.

XAUUSD SHOWING A GOOD UP MOVE WITH 1:10 RISK REWARD GOLD SHOWING A GOOD UP MOVE WITH 1:10 RISK REWARD
DUE TO THESE REASON
A. its following a rectangle pattern that stocked the market
which preventing the market to move any one direction now it trying to break the strong resistant lable
B. after the break of this rectangle it will boost the market potential for break
C. also its resisting from a strong neckline the neckline also got weeker ald the price is ready to break in the outer region
all of these reason are indicating the same thing its ready for breakout BREAKOUT trading are follws good risk reward
please dont use more than one percentage of your capitalfollow risk reward and tradeing rules
that will help you to to become a bettertrader
thank you

Jobs vs. Inflation: Gold Steady Before PCE ShowdownHello, investors!
Gold saw only a marginal 0.1% gain, closing at $3,739.42/oz on September 25. This struggle was due to better-than-expected US jobs data (jobless claims dropped sharply), which slightly pared back the market's expectation for a Fed rate cut in October (down to 85%).
However, Gold maintains support from dovish Fed comments and potential political instability (like Trump's proposed 100% drug tariff). The entire market focus now shifts to today's (Sept 26) PCE Inflation Report.
Expert Alert: If the PCE data is hotter than anticipated, Gold could face sharp, temporary downward pressure.
Technical Analysis & Strategy
Gold is currently consolidating within a triangle pattern and has yet to break the $375x resistance. While more selling pressure is possible before the PCE release, the long-term trend remains bullish.
Outlook: Prioritize Buy if the price maintains above the Key Level $373x. If the news causes the price to break $373x, be ready to flip the strategy to Sell.
Key Resistance: $3755, $3768, $3778
Key Support: $3738, $3727, $3712
Suggested Trading Strategy (Strict Risk Management):
BUY SCALP
Zone: $3739 - $3737
SL: $3733
TP: $3742 - $3747 - $3752 - $3757 - $3767
BUY ZONE
Zone: $3704 - $3702
SL: $3694
TP: $3712 - $3722 - $3732 - $3742 - $3762
SELL ZONE
Zone: $3776 - $3778
SL: $3786
TP: $3768 - $3758 - $3748 - $3728 - $3708
The market is at a critical juncture. What is your game plan for today? 👇
#Gold #XAUUSD #PCE #Fed #Inflation #TradingView #ATH

Elliott Wave Analysis XAUUSD – September 26, 2025
________________________________________
🔹 Momentum
• D1: Currently decreasing → the corrective trend is likely to continue. It may take about 2 more D1 candles for momentum to enter the oversold zone, after which a reversal could occur.
• H4: Momentum is rising → today we may see a bullish move or sideways range.
• H1: About to enter the oversold zone → a short-term bullish reversal is likely.
________________________________________
🔹 Wave Structure
• D1:
o As analyzed previously, wave 5 (yellow) has already reached its first target at 3789.
o It may take around 2 more D1 candles for momentum to enter oversold → showing that the bearish leg is weakening.
o Considering depth and time, the market is likely within wave 4 of wave 5. Once the correction completes, the uptrend should resume toward the second target.
• H4:
o A WXY corrective structure is developing.
o The ABC (blue) has completed wave W → the market may now be in wave X, followed by a Y-wave decline to finish the correction.
• H1:
o Wave X appears to be forming a triangle, currently in the final wave e.
o However:
If price rises sharply above 3762, it would suggest the corrective phase is already completed.
The target area for wave e is around 3752 → potential Sell zone.
If price breaks below 3729, it confirms wave Y is in play, targeting 3713 and 3698 → potential Buy zones.
⚠️ Note: If the Buy target is reached first, the Sell setup will be canceled.
________________________________________
🔹 Trading Plan
🔻 Sell Zone
• Entry: 3751 – 3753
• SL: 3761
• TP: 3729
________________________________________
🔺 Buy Zone 1
• Entry: 3714 – 3712
• SL: 3704
• TP: 3751
________________________________________
🔺 Buy Zone 2
• Entry: 3699 – 3696
• SL: 3686
• TP: 3751

Gold "Cools Down": A Sign of a Coming Downturn? Hello, investors!
Gold saw a notable correction on September 24, closing at $3,762.73/oz after reaching a historic high of $3,790.82/oz just one day earlier. Gold futures also dropped 0.5% to $3,795.80/oz. Is this a sign of a deeper correction or just a short-term profit-taking before key news?
Fundamental Analysis: Market "Holds Its Breath" Before the PCE Inflation Report
Yesterday's drop in gold seems to have little to do with the released U.S. economic data, as the USD index only had a slight rebound and housing data wasn't strong enough to cause such a major move. Instead, the most likely reasons are:
Cautious Profit-Taking: Investors are taking profits after a rapid run-up, aiming to mitigate risk before the upcoming PCE inflation report on September 26.
Fed Expectations: Despite short-term volatility, the market holds firm on its expectation that the Fed will cut rates in October and December with a high probability (94% and 77%). A low-rate environment and geopolitical concerns remain the core drivers supporting gold's price in the long term.
Technical Analysis: "Sell" or "Wait to Buy"?
Gold had a significant correction from the $3,770 area, indicating that a large number of profit-taking sell orders were triggered. However, the downtrend has paused and is now looking for a new balance point.
Outlook: With the current cautious sentiment, there's a chance gold may see further selling pressure in the short term. However, any deeper drop would be an excellent opportunity to buy back at a better price, as the long-term bullish momentum is still intact.
Suggested Trading Strategy (Strict Risk Management):
Sell Zone: Zone $3766 - $3768, SL $3776
Buy Zone: Zone $3702 - $3700, SL $3692
The market is highly sensitive. Do you think this correction is a buying opportunity or a time to step back? Share your thoughts! 👇
#Gold #XAUUSD #Fed #GoldAnalysis #TradingView #InterestRates #Inflation #PCE #USD

Elliott Wave Analysis XAUUSD – September 25, 2025
________________________________________
🔹 Momentum
• D1: Momentum on the daily chart has turned bearish, indicating that the main downtrend may continue.
• H4: Momentum on H4 is about to turn bullish, suggesting a possible upward move today. However, if this bullish reversal fails to break the previous high, the downtrend will remain intact.
• H1: Momentum on H1 is declining and about to enter the oversold zone. This downward move may need around 2 more H1 candles before entering oversold territory and reversing.
________________________________________
🔹 Wave Structure
• D1:
o The first target of wave 5 (yellow) was reached at 3789.
o Price is currently reacting at this level. With D1 momentum turning bearish, there is a strong possibility that wave 5 (yellow) has already completed, meaning price could move towards 3632 and potentially break below it.
• H4: An ABC corrective structure (blue) has formed, opening three scenarios:
1. The correction is complete → price rallies strongly, breaking the previous high to continue the uptrend.
2. Price rallies but with overlap, forming a Flat 3-3-5 pattern → price may rise toward the previous high at 3793.
3. Price remains in a zigzag structure → another decline may occur to complete wave C.
👉 Given the bearish momentum on D1, I lean more towards scenario 2 and 3.
👉 Note: In scenarios (1) and (2), price must hold above 3729, then break 3752, which could lead to a minimum rally towards 3777.
• H1: Under scenario 3 (further decline to complete wave C):
o Price may break below 3718.
o Wave 5 (black) targets:
3713 (first target).
3698 (second target).
________________________________________
🔹 Trade Plan
• Buy Zone 1: 3729 – 3726
o SL: 3717
o TP: 3751
• Buy Zone 2: 3714 – 3711
o SL: 3703
o TP: 3751
________________________________________
⚠️ Important Note
The market is likely in a corrective wave at a higher structure.
• Characteristic: Price often shows overlapping moves.
• Therefore: Manage trades carefully, avoid over-risking, as reversals can happen at any time – this is typical of corrective waves.

XAUUSD SHOWING A GOOD DOWN MOVE WITH 1:10 RISK REWARDXAUUSD SHOWING A GOOD DOWN MOVE WITH 1:10 RISK REWARD DUE TO THESE REASON
A. its following a rectangle pattern that stocked the marketwhich preventing the market to move any one direction now it trying to break the strong resistant lable
B. after the break of this rectangle it will boost the market potential for breakC. also its resisting from a strong neckline the neckline also got weeker ald the price is ready to break in the outer region
all of these reason are indicating the same thing its ready for breakout BREAKOUT trading are follws good risk reward
please dont use more than one percentage of your capitalfollow risk reward and tradeing rules that will help you to to become a bettertrader
thank you

Elliott Wave Analysis XAUUSD – September 24, 2025📊
________________________________________
🔹 Momentum
D1
• Daily momentum is currently rising.
• So far, we have counted 4 bullish candles, which is the minimum requirement to complete a momentum cycle.
• There may be 1–2 more daily candles before momentum enters the overbought zone and reverses.
H4
• H4 momentum is in the oversold zone and about to reverse.
• The upcoming H4 bullish swing is critical:
o If it breaks the previous high → the uptrend continues, and we can expect another 1–2 daily bullish candles before reversal.
o If it fails to break the high → we must prepare for a reversal scenario.
H1
• H1 momentum is also heading into the oversold zone.
• This creates a confluence between H4 and H1, signaling a possible bullish move ahead.
________________________________________
🔹 Wave Structure
D1
• The yellow wave ⑤ has reached its first target at 3789.
• This is a strong resistance zone because:
o It aligns with the 0.382 Fibo retracement of waves ①–③ yellow.
o Wave ⑤ equals the length of wave ① yellow.
• If D1 momentum enters the overbought zone and price fails to break 3789, this may mark the top of wave ⑤ yellow, potentially triggering a sharp and prolonged decline.
H4
• Price has already seen a 5-candle decline on H4, with momentum in the oversold zone → this correction is near completion.
• Two possibilities:
1. It is wave ④ of wave ⑤ yellow.
2. It is the start of wave ① of a new bearish structure.
• If the next bullish move fails to break the previous high, the bearish wave ① scenario is confirmed, leading to a wave ③ decline with strong and steep characteristics.
H1
• A deeper and longer correction than previous ones has appeared, which is unusual, especially since price already reached the first target of wave ⑤ yellow.
• However, we should not rush to catch the top, as this unusual behavior is only visible on H1, while H4 and D1 still look normal.
• If this is wave ④, or wave ① of a bearish structure, or even just wave A → the next move should still bring a bullish swing confluence, providing an opportunity to look for Buy entries.
________________________________________
🔹 Key Support Zones
• 3747 – 3737
• 3729
________________________________________
🔹 Trading Plan
Scenario 1:
• Buy Zone: 3747 – 3744
• SL: 3735
• TP: 3774
Scenario 2:
• Buy Zone: 3730 – 3727
• SL: 3720
• TP: 3767

Gold Sets New Record: Rate Hopes Driving Price HigherHello, traders!
Gold surged to a record high of $3,726.19/oz on September 22, fuelled by growing investor expectations for a clearer Fed rate-cutting path. Traders are now betting on two more rate cuts this year with a very high probability.
The growth drivers have shifted from being primarily central bank and Asian demand to now include strong buying from Western investors, as shown by increased holdings in gold ETFs. Upcoming speeches from Fed officials and the core PCE inflation data this week will be key in determining the market's next direction.
Technical Analysis & Strategy
Gold is in a strong uptrend and is continuously setting new highs. While there was a minor correction, the bullish momentum remains intact. Shorting near resistance levels is highly risky.
Outlook: Continue to prioritize Buy positions if gold holds above $370x.
Resistance: $3785, $3794, $3804
Support: $3774, $3764, $3754
Suggested Trading Strategy:
Buy Scalp: Zone $3765 - $3763, SL $3759
Buy Zone: Zone $3754 - $3752, SL $3744
Sell Zone: Zone $3800 - $3802, SL $3810
The market is highly volatile. Do you think gold can hit the $3,800 mark this week? Share your thoughts! 👇
#Gold #XAUUSD #Fed #GoldAnalysis #TradingView #InterestRates #Inflation #ATH

XAUUSD/GOLD 30 MIN BUY PROJECTION 23.09.25XAUUSD/Gold 30-min buy projection chart you shared for 23.09.25. Here’s the breakdown of what the chart indicates:
🔎 Chart Analysis
Trend: Price is moving within a bullish (upward) channel, shown by the blue trend lines.
Entry Zone: Around 3749.687 (marked as ENTRY, just above Support 1).
Stop Loss (SL): Around 3743.131, below the 30-min FVG (Fair Value Gap).
Supports:
Support 1: ~3749 zone
Support 2: ~3755–3757 zone
Take Profits:
TP1: Around 3765–3767 level (mid-channel target).
TP2 (ATH – All-Time High for this projection): Around 3783–3785.
Projection Path:
Price expected to bounce near entry zone → rise towards TP1 → possible pullback → continue bullish momentum towards TP2 ATH following the 30-min uptrend line.
⚡ Trading Idea (based on chart)
Buy Entry: ~3749
Stoploss: ~3743
TP1: ~3765
TP2: ~3783
This setup offers a risk-reward ratio > 1:3, which is strong for an intraday buy trade.
👉 Do you want me to calculate the exact risk-to-reward ratio (RRR) for this setup so you can evaluate position sizing?

Elliott Wave Analysis XAUUSD – September 23, 2025
Momentum
• D1: Momentum is in an uptrend, currently on the 3rd bullish candle of the cycle. This suggests we may see at least 2 more bullish daily candles from now.
• H4: Momentum has turned bearish, indicating the possibility of a corrective decline within today’s H4 structure.
• H1: Momentum has already turned bearish and is approaching oversold territory. This shows the current decline is weakening, and a short-term rebound is likely. However, if momentum turns back up and enters the overbought zone but fails to break the previous high, another bearish leg may follow.
________________________________________
Wave Structure
• D1: After completing wave 4 (yellow), price broke the previous high, confirming the continuation of the uptrend. Wave 5 (yellow) targets are projected at 3789.019 and 3887.117.
• H4: Wave 3 (yellow) has completed, followed by a corrective structure in a flat WXY pattern. Currently, price is rising steeply, suggesting wave 5 (yellow) is underway. With H4 momentum turning bearish, this pullback could correspond to wave 4 within the ongoing wave 5 (yellow).
• H1: Wave 3 (black) has formed with a complete 5-wave sequence (blue). Price is now in wave 4 (black), which could develop as a Zigzag, Flat, or Triangle correction.
Wave 4 (black) target zones:
1. 3729.447
2. 3709.732
3. 3696.422
Once H4 momentum turns bullish from the oversold region, the nearest level among these zones is the most likely end of wave 4.
________________________________________
Trading Plan
Buy limit strategy at support zones:
• Buy Zone 1: 3730 – 3727
o SL: 3719
o TP: 3760
• Buy Zone 2: 3710 – 3707
o SL: 3696
o TP: 3729
If price extends lower, additional buy opportunities can be considered around 3696 or deeper levels marked on the chart.
________________________________________
👉 The primary trend remains bullish, with wave 5 (yellow) in progress. The plan is to wait for wave 4 (black) to complete and then enter Buy positions in alignment with the larger uptrend.

Gold's Rally Continues: Why a Fed Cut Isn't Slowing It DownHello, traders!
Gold started the new week on an impressive note, trading at $3,685 in early Monday's session. The main drivers are the market's continued reaction to the Fed's recent rate cut and escalating geopolitical events. So, the big question is, how far will this rally go?
Fundamental Analysis: Why Is Gold Still Soaring?
Although the Fed cut interest rates by 0.25%—the first time in 2025—Chair Jerome Powell maintained a cautious stance, calling it a "risk management cut." While this initially caused some market jitters, in the long run, lower interest rates are a strong supporting factor for gold.
Lower Rates: They reduce the opportunity cost of holding gold, which is a non-yielding asset.
Geopolitical Tensions: Conflicts in Ukraine and the Middle East are escalating, boosting safe-haven demand. Ukrainian President Zelenskyy reported that Russia carried out a major drone and missile attack, reaffirming gold's role as a protective asset against global risks.
Technical Analysis: Breaking Resistance, The Uptrend Continues
Gold had a powerful rally at the start of the week, successfully breaking the key resistance zone at $370x. The price is currently hovering around $3720 with a slight correction, but the uptrend remains firmly intact.
Outlook: Given the strong upward momentum, short-selling (going short) with a tight stop-loss is extremely risky. We will continue to prioritize long positions (going long) as long as gold holds above the $370x level.
Suggested Trading Strategy (Strict Risk Management):
BUY SCALP
Zone: $3413 - $3711
SL: $3407
TP: $3716 - $3721 - $3726 - $3731 - $3741
BUY ZONE
Zone: $3700 - $3798
SL: $3790
TP: $3708 - $3718 - $3728 - $3738 - $3758
SELL ZONE
Zone: $3734 - $3736
SL: $3744
TP: $3726 - $3716 - $3706 - $3796 - $3779
The market is showing unpredictable volatility. Can gold overcome all barriers and set new records? Share your opinion in the comments below! 👇
#Gold #XAUUSD #Fed #GoldAnalysis #TradingView #FinancialMarkets #TechnicalAnalysis #GoldTrading #USD #Geopolitics
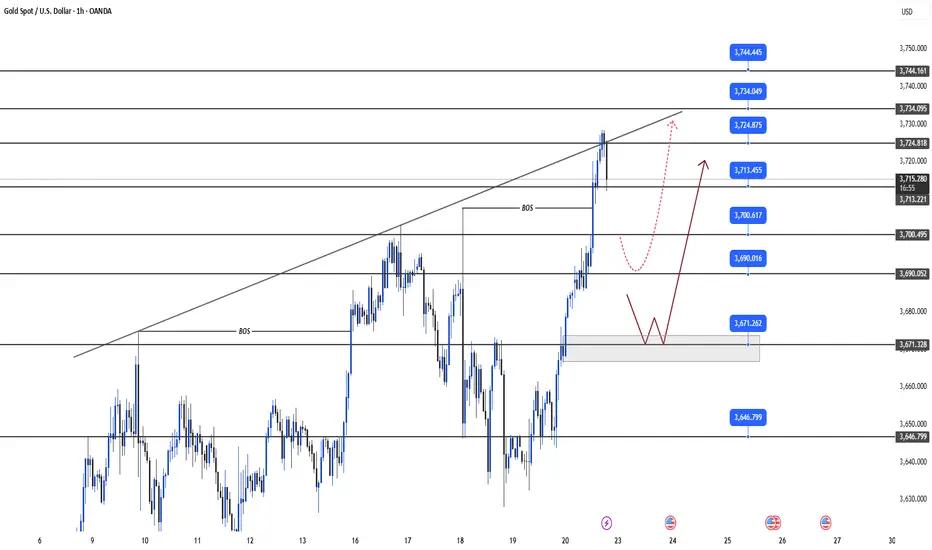
"Bullish Breakout Potential for Gold (XAU/USD) Above Key ?Key Observations:
The price is currently rising and is reaching a key resistance level.
A potential breakout is shown above the resistance at approximately 3,723.
A blue support zone between 3,686 and 3,690 suggests that the price has recently bounced off this level, implying bullish momentum.
The target price shown in the chart (with the green box) is positioned around 3,730, indicating that the trader is expecting further upward movement.
The stop-loss is placed just below the support zone, around 3,672, which suggests that the trader is managing risk.

Fed Dovish Signals & Geopolitical Tensions Boost Gold📊 Market Context
Gold continues to receive solid support from the Fed’s dovish tone and rising geopolitical tensions. However, the USD has extended its rebound from multi-year lows, which may temporarily limit gold’s upside. Broader risk-on sentiment in financial markets could act as a short-term headwind for XAU/USD before the next round of Fed speeches. Still, the long-term bullish trend has re-emerged, and gold is positioned to challenge new all-time highs in the near term—an important signal for Indian traders watching for fresh momentum in precious metals.
🔎 Technical Analysis (H1/H4)
Price has broken above the descending trendline, confirming that bullish momentum has returned.
Short-term support: 3686–3684, maintaining this level preserves the bullish structure.
Additional support: 3670–3668, overlapping with CP and liquidity zones on the chart.
Key resistance: 3720–3722, a crucial reaction level for profit-taking or liquidity sweeps.
🔑 Key Levels
Resistance: 3707 ➡️ 3720
Support: 3685 ➡️ 3669 ➡️ 3658
📈 Scenarios & Trading Plan
✅ BUY ZONE 1: 3686–3684
SL: 3680
TP: 3690 ➡️ 3695 ➡️ 3700 ➡️ 3705 ➡️ 3710 ➡️ 3720 ➡️ …
✅ BUY ZONE 2: 3670–3668
SL: 3664
TP: 3675 ➡️ 3680 ➡️ 3690 ➡️ 3700 ➡️ …
✅ SELL ZONE (Liquidity Trap Watch): 3720–3722
SL: 3726
TP: 3715 ➡️ 3710 ➡️ 3705 ➡️ 3700 ➡️ …
⚠️ Risk Management Notes
Watch for false breakouts at 3720–3722 — price could sweep stops before reversing lower.
Only enter longs with price action confirmation at the buy zones; avoid chasing price mid-range.
Manage trade size carefully given potential volatility from Fed comments and geopolitical news.
✅ Summary
Gold’s long-term bullish trend is firmly back, supported by Fed dovishness and geopolitical factors—key drivers for India’s gold market sentiment. The plan focuses on buying dips at 3686–3684 and 3670–3668 targeting 3705–3720, while short-term selling at 3720–3722 is valid if rejection appears.
📢 Stay updated with MMFLOW TRADING on TradingView for fresh market insights and actionable setups tailored for gold traders

Elliott Wave Analysis XAUUSD – September 21, 2025
Momentum
• D1: Momentum is still declining → suggesting that early next week price may either experience a downward move or continue to range sideways.
• H4: Momentum is in the overbought zone → likely to see a corrective move on Monday.
• H1: Momentum is also in the overbought zone → during the Asian session on Monday, a short-term corrective decline is highly probable.
Wave Structure
• D1:
o Scenario 1: Wave v (black) has already completed (refer to H4). This means the market is now in a larger corrective phase, and price is unlikely to break above 3709, the high set last week.
o Scenario 2: Wave 4 (black) of wave v has completed, and Friday’s rally was wave 5 (black) of wave v. In this case, early next week we could see a breakout above 3709 with a daily close higher.
• H4: Since D1 and H4 momentum still support a corrective move on Monday, I will keep the current wave labeling unchanged. Only if price breaks strongly above 3709 will I update the labeling to Scenario 2.
• H1: On D1, the two scenarios are contradictory:
o One scenario suggests a decline.
o The other suggests a new high.
Therefore, the best approach for now is to wait for more confirmation. On H1, the labeling from last Friday (the bearish scenario) has not yet been invalidated and is still supported by both D1 and H4 momentum, so I will continue to monitor this count.
Trading Plan
During complex corrective phases, when wave structures are not yet clear, I do not recommend trading solely based on Elliott Wave. For now, the prudent approach is to continue observing until more data becomes available.
If trading is necessary, it’s better to focus on short-term scalps rather than larger swing positions.

Gold Dips After Fed Meeting: What's Next for the Market?Hey traders!
After a super volatile session, gold prices took a hit yesterday (September 18). The precious metal dropped 0.4% to $3,643.40/oz, while futures contracts lost 1.1% to $3,678.30/oz. This comes right after gold hit a new record of $3,707.40/oz in the previous session. Is this a signal for a major correction or just a bit of profit-taking? Let's break it down!
Fundamental Analysis: The Market 'Digests' the Fed's Message
While the Fed did cut rates by 0.25% as expected, the message from the meeting wasn't entirely 'dovish'. Fed Chair Jerome Powell raised doubts about the pace of future policy easing. He stressed that the rate cut was just a "risk management" move to address a weakening labor market, not a firm promise for aggressive easing.
USD Recovers: The Fed's cautious stance helped the USD index gain 0.5%, making gold more expensive for holders of other currencies.
Long-Term Drivers Still Strong: Despite the short-term dip, experts remain bullish on gold. The core drivers for its rally are still in place:
BRIC Central Bank Buying: Central banks, especially from China, continue to diversify their reserves, moving away from the USD.
Safe-Haven Demand: Ongoing geopolitical and trade tensions are still a key reason for investors to flock to gold.
Swiss Data Confirms: Data shows that gold exports from Switzerland to China jumped 254% in August 2025 compared to July, which proves that real demand is super strong.
Technical Analysis: Unpredictable Volatility
After the FOMC meeting, gold was all over the place, breaking through resistance and support levels in a flash. The market is reacting more to macro news than to technical patterns right now.
Resistance: $3671, $3686, $3694
Support: $3647, $3632, $3612, $3598
Outlook: Today, we should still prefer long positions if gold stays above the $365x level. However, if gold closes a candle below $364x during the US session, be cautious and consider a switch to sell positions.
Suggested Trading Strategy (Use Strict Risk Management):
SELL ZONE
Zone: $3686 - $3688
SL: $3696
TP: $3678 - $3668 - $3658 - $3648 - $3638
BUY ZONE
Zone: $3616 - $3614
SL: $3606
TP: $3624 - $3634 - $3644 - $3654 - $3664
The market is super sensitive to news right now. Always be careful and don't overtrade. Do you think this is a buying opportunity or a time to step back? Share your thoughts in the comments below! 👇
#Gold #XAUUSD #Fed #GoldAnalysis #TradingView #FinancialMarkets #TechnicalAnalysis #GoldTrading #USD #BRIC

Elliott Wave Analysis XAUUSD – September 19, 2025
Momentum
• D1 timeframe: Momentum is currently declining, suggesting that the downtrend may continue until momentum enters the oversold zone. This process could take at least 2 daily candles, including the current one.
• H4 timeframe: Momentum is turning upward, but repeated reversals at the oversold zone, along with overlapping price action, indicate that the market is in a complex corrective phase.
• H1 timeframe: Momentum has already turned upward, with 3 H1 bullish candles formed. It is expected that within 1–2 more candles, momentum will likely reach the overbought zone.
Wave Structure
• D1 timeframe: The 5-wave black structure has been completed. The current correction is expected to last longer compared to the previous WXY triangle correction.
• H4 timeframe: Wave counting is complicated due to overlapping price movements. With momentum now recovering, wave B is likely unfolding, which will then be followed by the completion of wave C.
• H1 timeframe: A temporary channel can be drawn to observe price behavior. The market is likely in wave B (black), forming a Flat structure (ABC in blue). Wave C (blue) is projected to equal wave A (blue) at the 3667 level. This price zone also coincides with the boundary between high and low liquidity areas on the Volume Profile, making it a strong resistance zone for potential short entries.
Trading Plan
• Sell Zone: 3667 – 3670
• SL: 3680
• TP: 3644

Gold’s Next Bullish Move: Key Buy Zones & Targets to Watch Today🔥 Gold (XAUUSD) Bullish Momentum Alert! 🔥
After a strong rally, Gold bounced back impressively from today’s low at 3633 and is pushing up towards 3673. For intraday traders, the setup is clear: look for dips to jump in on the long side around 3654 - 3646 with exciting upside targets ahead!
📈 Trade Setup – Long on Pullback
Entry: Buy Gold at 3654
Add-on Dip: Add more at 3646
Targets: First target 3670-3675, then aiming for 3685
Invalidation: Cut losses if price falls below 3630
📊 Risk/Reward Snapshot
This is a tight-risk, high-reward setup — perfect for traders who want to keep their stops close while chasing solid gains. As always, manage your risk wisely and size your positions according to your plan.
Do you see the same bullish opportunity?
👍 Drop a like if you’re in!
💬 Share your thoughts or questions below — let’s build a sharp, winning community together!
Your feedback fuels us and keeps everyone trading smarter. Let’s make those pips! 🚀
Happy Trading,
– The InvestPro Team

XAUUSD/GOLD Unemployment Claims 18.09.25XAUUSD/Gold – Unemployment Claims (18.09.25):
Current Price Zone: Gold is trading around $3,668.81.
Trading Idea: The chart suggests a buying opportunity if the U.S. unemployment claims data comes out negative (worse than expected).
Key Levels:
Major Resistance R1 → Around $3,685 – $3,690
Breakout and retest of this level signals a buy entry.
Resistance 2 – Yesterday’s High & News High → Around $3,710
Acts as the next upside target after breakout.
Resistance 3 – Expected New ATH → Around $3,736 – $3,740
This is the final bullish target if momentum sustains.
Strategy:
Plan A (Main Setup):
Wait for breakout above R1 (3,690) → Enter buy trade on retest.
Ride the move towards R2 (3,710) and possibly R3 (3,736–3,740).
Confirmation Zone:
If news is negative for USD, gold is expected to rally strongly (bullish bias).
Risk Management:
Stop Loss (SL): Below 3,680 zone, as marked in the red area.
Take Profit (TP): Stepwise at 3,710 → 3,736 → 3,740.
👉 In summary: The chart indicates a news-driven bullish breakout plan — gold buys are favored if the data weakens the USD, with targets up to 3,740.

XAUUSD/GOLD 1H BUY PROJECTION – 18.09.25The 1-hour chart of Gold shows a recent V pattern formation, signaling a strong bullish reversal after a sharp drop.
A downtrend breakout is confirmed, supported by a Three White Soldiers pattern, strengthening the bullish momentum.
Entry Zone: Around 3,668 (current price).
Support (S1): 3,655 – strong demand zone where buyers are likely to defend.
Resistance (R1): 3,685 – key target level for this bullish move.
Risk-to-Reward Setup: Stop-loss below support (S1) at 3,655, with take-profit at resistance (R1) near 3,685.
🔑 Conclusion: Gold (XAUUSD) is showing bullish signs with breakout confirmation. As long as price holds above support at 3,655, the projection favors upside movement towards 3,685.
