Elliott Wave Analysis XAUUSD – September 18, 2025
Momentum
• D1: Currently, D1 momentum is declining, therefore a downward move is likely to extend over the next 4–5 days.
• H4: Momentum is falling, so today we may see further downside to push momentum into the oversold zone before a potential reversal.
• H1: Momentum is still heading down, suggesting the bearish move is likely to continue.
________________________________________
Wave Structure
• D1: With momentum turning lower, it is highly probable that wave v black has completed and price has entered a corrective ABC phase. If this is the case, the correction will likely last for at least more than one week.
• H4: A 5-wave structure (1–2–3–4–5) within wave v black has been completed. The current decline could be wave A of the correction. We need to observe closely to confirm whether wave A is done. Note: during corrective phases, trading becomes more difficult; targets beyond 500 pips are rarely achieved as price tends to overlap. Toward the end of corrections, price often compresses and whipsaws both sides, so trade with smaller positions and manage risk carefully.
• H1:
o Scenario 1: Wave 1 of wave (5) black has formed, and the market is now in wave 2. This scenario is invalidated if price breaks below 3626.
o Scenario 2: Wave v black has already completed with a 5-wave structure. Price is now in a larger corrective phase (i–ii–iii–iv–v black on the D1). In this case, the correction will likely last longer than previous waves ii and iv – an important guide to prepare for an extended bearish or sideways phase.
On H1, the current drop is steep and impulsive, likely part of a 5-wave structure. The recovery was capped at the 38.2% Fibonacci retracement, which indicates:
• If this is wave 4 of the decline, price will break below 3649, with wave 5 of A projected toward 3632 → Buy zone.
• If price breaks above the minor high at the 38.2% Fibonacci level, it is more likely wave B of an ABC correction. In that case, the upside targets would be 3677 or 3694 → Sell zones.
⚠️ Note: Once price hits one target, the opposite entry setup will be canceled.
________________________________________
Trading Plan
Buy Zone:
• Entry: 3633 – 3630
• SL: 3620
• TP: 3649
Sell Zone 1:
• Entry: 3676 – 3679
• SL: 3686
• TP: 3657
Sell Zone 2:
• Entry: 3693 – 3696
• SL: 3703
• TP: 3677
Xauusdidea

Elliott Wave Analysis XAUUSD – September 17, 2025
Momentum
• D1 timeframe: Momentum is currently rising. As of today, the upward move has lasted for 3–4 daily candles. Therefore, in the next 1–2 days, momentum is likely to enter the overbought zone.
• H4 timeframe: Momentum is in the oversold area and starting to reverse. Once confirmed, we can expect at least 4–5 bullish H4 candles.
• H1 timeframe: Momentum is already in the oversold zone and has turned upward, suggesting an immediate short-term rally.
Wave Structure
• D1 timeframe: Price is moving within black wave v. Since black wave iii was extended, black wave v is likely to be approximately equal in length to black wave i.
• H4 timeframe: Inside black wave v, we expect a 5-wave green structure to form. Currently, green wave 1 seems to have completed, and price is correcting within green wave 2.
• H1 timeframe: Within green wave 1, a 5-wave black structure has been completed. Price is now developing a corrective black ABC pattern.
Target zones for black wave C:
• Target 1: 3675
• Target 2: 3657
Note: Wave 2 usually retraces to the 0.618 Fibonacci level of wave 1, which coincides with the 3657 zone. This is the key level to consider for a buy setup.
Trading Plan
• Buy Zone: 3658 – 3655
• Stop Loss: 3645
• Take Profit (TP1): 3677

“Gold Shines Bright | Bullish Momentum Targeting $3,700🔎 Technical Analysis – XAU/USD (1H Chart)
Trend: Strong bullish trend confirmed, with price making higher highs and higher lows.
Buy Zone: Around 3,590 – 3,600 USD, where buyers stepped in aggressively.
Short-Term Target 🎯: 3,650 – 3,700 USD (already highlighted on chart).
Key Support Levels:
3,561 USD (near-term support)
3,490 USD (major support, bullish structure invalidation if broken)
📌 Outlook: As long as price holds above the buy zone, momentum favors bulls with potential continuation toward 3,700+ USD.
🌍 Fundamental Drivers for Gold Bullishness ✨
Federal Reserve Rate Cuts Expectations 🏦⬇️ – If the Fed signals easing or holds a dovish stance, real yields fall → Gold strengthens.
Weakening US Dollar (DXY) 💵📉 – A softer dollar makes gold more attractive to global investors.
Geopolitical Risks 🌍⚠️ – Rising global tensions increase demand for safe-haven assets like gold.
Central Bank Demand 🏦🔒 – Many central banks are adding gold reserves to hedge against currency risks.
Inflation Hedge 📊🔥 – Gold remains attractive when inflationary pressures stay elevated.

XAUUSD – Wave (4) Pullback Could Launch Wave (5)Namaste Traders
Gold on the M30 chart remains bullish, but the push into the upper channel line signals short-term profit booking. For those trading Gold/USD or tracking Gold in INR terms on MCX, here’s my plan for the upcoming sessions:
🔍 Technical Overview
Price completed Wave (3) around 3697.40, tagging the upper trend channel – a natural zone for sellers to take profits.
The 3666–3670 region has acted as a pivot/support multiple times. I expect a Wave (4) correction into this zone before a fresh rally.
3657 is deeper support and also serves as the invalidation level for the bullish scenario.
If Wave (4) holds, Wave (5) could push towards 3720–3725.
📈 Key Levels
Type Price Level Notes
Resistance 3695–3700 Wave (3) top + upper channel edge – watch for rejection
Support (1) 3666–3670 Primary buy zone for Wave (4)
Support (2) 3657 Strong support & invalidation
Target (5) 3720–3725 Expected Wave (5) extension target
⚙️ Trading Plan
✅ Primary Setup – Buy the Dip (Trend Continuation)
Entry Zone: 3666–3670 (or a small sweep to ~3657).
Confirmation: Look for a bullish engulfing candle, pin bar, or MACD crossover on the M30 chart.
Take Profit:
TP1: 3695–3700 (previous high/resistance)
TP2: 3720–3725 (Wave (5) projection)
Stop Loss: Below ~3652.
Risk/Reward: Aim for 1:2 to 1:3.
⚠️ Secondary Setup – Countertrend Short
If price retests 3695–3700 and forms a strong rejection, a quick countertrend short is possible.
Targets: 3670 → 3657.
Stop Loss: Above ~3703–3707.
Use small position sizing, as this is against the primary trend.
🛡 Risk & Invalidation
A close below 3656 plus a break of the lower trend channel invalidates the bullish Wave (5) scenario.
For Indian traders watching MCX Gold (in INR), keep in mind USD/INR fluctuations – a weaker rupee can amplify gold gains even if spot prices pause.
Always keep risk ≤1–1.5% per trade and avoid chasing late entries.
🧭 Final Thoughts
Gold’s trend is still bullish on the short-term chart. A healthy correction into 3666–3670 could offer a prime entry for Wave (5). Be patient, wait for confirmation, and let the price come to your zone.
Countertrend shorts are valid only on a clear rejection at 3695–3700 – otherwise, stick with the trend.
Good luck and happy trading,

Gold on Fire: Fed Rate Cuts & Global Tensions Fueling the Rally!Hello, fellow traders! Gold (XAU/USD) is on an absolute tear, closing strong at $3,680.80/oz on September 15, 2025, after hitting a new all-time high (ATH) of $3,685.39/oz. The past week has been solid, with gold up 1.6% as the US dollar weakened (down 0.3% to a one-week low) and US bond yields dropped. The market is buzzing with talk of a sure-shot 0.25% Fed rate cut on September 17, with some even betting on a bigger 0.5% move as per the CME FedWatch Tool. Plus, geopolitical tensions and reports of China easing gold import norms are adding more fuel to this fire. Let's do a deep dive and check out some solid trading setups! 💰
Fundamental Analysis: All That Glitters Is Gold! 🌟
Fed Rate Cuts: The latest US data is a mixed bag—the August CPI was hot, but the jobs market is cooling down. This is giving the Fed a clear signal to cut rates for the first time since December 2024. Lower interest rates are a big negative for the US Dollar, making non-yielding assets like gold super attractive. This is a classic "buy the rumor, sell the news" situation, but right now, the rumor is all about buying gold!
Geopolitical Jitters: The upcoming Fed meeting is quite tense, with political drama and a lot of pressure from the White House. This kind of uncertainty is gold's best friend, as it’s the ultimate safe-haven asset.
Chinese Demand: Recent reports suggest China is making it easier to import gold, which means more demand is coming from the world's biggest consumer. Strong buying from both official and private players in China is a major tailwind for gold's upward move.
Technical Analysis: Breaking All Barriers! 📉
Gold has smashed through the Fibo 2.618 level and is in uncharted territory. What's impressive is that the pullbacks are very shallow, just a $10 blip before it resumes its rally. This shows the bulls are in complete control, and selling pressure is minimal. The strategy is simple: look to buy on dips and be very selective about any shorting opportunities.
Resistance Levels: $3704, $3714, $3724
Support Levels: $3694, $3686, $3674, $3666
Trading Setups (Strict Risk Management Is Key):
Buy Scalp:
Zone: $3688 - $3686
SL: $3682
TP: $3691 - $3696 - $3701 - $3706
Buy Zone:
Zone: $3667 - $3665
SL: $3657
TP: $3675 - $3685 - $3695 - $3705 - $3715
Sell Scalp:
Zone: $3704 - $3706
SL: $3710
TP: $3701 - $3696 - $3691 - $3686
Sell Zone:
Zone: $3724 - $3726
SL: $3734
TP: $3716 - $3706 - $3696 - $3686 - $3676
Gold is at an ATH—so be careful of liquidity traps around the Fed announcement! Above $3694, the target is the sky; below, we could see a test of $3666. Manage your risk tightly before September 17! What's your plan: buy the dip or sell the top? Let me know your strategy in the comments! 👇
#Gold #XAUUSD #Fed #RateCuts #CPI #TradingView #MarketUpdate #Forex #Investing #TechnicalAnalysis #GoldTrading #Finance #Geopolitics #CentralBank

Gold Facing Strong Resistance – Bearish Move Towards Support ?Analysis:
Resistance Zone: Price is struggling to break above the $3,645–$3,650 area, which has acted as a strong resistance multiple times.
Support Levels: Immediate support lies around $3,620 and $3,614, with the major support zone at $3,580.
Price Action: Repeated rejections from resistance indicate weakening bullish momentum. Sellers are gaining control near the resistance zone.
Bearish Outlook: A potential downward move is projected, with price likely to test $3,580 support if resistance continues to hold.
Risk Management: A break and close above $3,650 would invalidate the bearish scenario and could trigger a bullish continuation.
✅ Bias: Bearish below $3,650
🎯 Targets: $3,620 → $3,614 → $3,580
🛑 Invalidation: Above $3,650

XAUUSD/GOLD 1H BUY PROJECTION 16.09.25XAUUSD/Gold 1H Buy Projection (16.09.25). Here’s a breakdown of the key points from your analysis:
🔹 Chart Analysis
Support & Resistance
Support S1: Around 3678 zone.
Minor Resistance Breaked: Price broke above the 3680 resistance area.
Resistance R1 (ATH): Around 3692 – 3696 area.
Entry & Stoploss
Current price: 3683.63
Stoploss: Below 3676 level.
Risk Zone (Red Area): Price should not break below this zone for the buy setup to remain valid.
Target Levels
Target Price 1: ~3688
Target Price 2: ~3692–3696
Indicators
Stochastic Oscillator (top indicator):
Showing a bullish crossover (green line crossing above red), suggesting upward momentum.
RSI (bottom indicator):
Turning upward from 64.47, showing renewed buying pressure.
🔹 Projection
The setup is bullish with expected upward movement from 3683 → 3692 → 3696+.
The chart suggests a possible pullback and continuation before reaching higher targets.
As long as 3680 support holds, momentum favors the upside.

Elliott Wave Analysis XAUUSD – September 16, 2025
Momentum
• D1: Momentum is currently in an uptrend, suggesting that price may continue to rise for the next 5–6 days.
• H4: Momentum is turning downward, indicating the possibility of a correction today.
• H1: Recently showed a bullish reversal signal, but now there are signs of weakening again. This suggests that the downward move on H1 may not yet be complete.
Wave Structure
• D1: Yesterday’s daily candle created a new high, which indicates that wave iv (black) has likely been completed. The market is now developing in wave v (black).
• H4: Wave iv (black) is likely finished. With H4 momentum turning lower, wave 1 of wave v (black) may already be completed, and the market is now entering a corrective phase.
• H1: Wave v (black) is unfolding into a 5-wave structure (green). Combined with weakening H4 momentum, there are two possible scenarios:
1. This is wave 4 (green), with a maximum correction level around 3662.
2. This is wave 2 of wave v (black – D1), with a potential correction target around 3657.
Since both scenarios point to a similar price zone, we select 3662–3660 as the buy entry zone.
Trading Plan
• Buy Zone: 3662 – 3660
• SL: 3650
• TP: 3698

Elliott Wave Analysis XAUUSD – 15/09/2025
1. Momentum
• D1 timeframe: Momentum is about to enter the oversold zone. At the beginning of next week (Monday), D1 may officially enter the oversold area and start reversing upward.
• H4 timeframe: Momentum is also approaching the oversold zone and preparing to reverse. This opens the expectation of a bullish move within the next 1–2 sessions.
• H1 timeframe: Momentum is currently declining, so there may be one more short-term drop to push H1 into oversold conditions before a potential reversal.
________________________________________
2. Wave Structure
• D1 timeframe:
Price is still within wave iv (black). In terms of time, wave ii (black) took 7 daily candles to complete. According to the principle of alternation, waves 2 and 4 often differ in nature. With D1 momentum about to reach oversold, there is a high probability that wave iv (black) is near completion.
• H4 timeframe:
Price is moving sideways, which is consistent with the characteristics of wave iv. If in the next session H4 momentum reverses upward and reaches overbought while price still fails to break above 3657, then the corrective structure may evolve into a triangle or a double three (WXY).
• H1 timeframe:
An ABC corrective structure seems completed, but instead of rallying, price continues to consolidate within the liquidity block at 3657 – 3631. This suggests a more complex structure is unfolding, either a triangle or a WXY combination.
With D1 momentum heading into oversold, the expected downside range is 3631 – 3595, which also aligns with the nearest high-liquidity zones on the chart.
________________________________________
3. Price Zones & Targets
• Breakout level:
o 3657 → A strong candle close above this level would confirm a buy signal.
• Support / Buy zones:
o 3631 – 3632 → Possible bottom of the current correction.
o 3593 – 3596 → Scenario if wave iv develops into a WXY structure.
• Wave v (black) target:
o Projection: 3709 (main target).
________________________________________
4. Trading Plan
1. Buy Breakout 3657
o SL: below breakout candle
o TP: 3709
2. Buy Zone 3632 – 3630
o SL: 3622
o TP: 3709
3. Buy Zone 3596 – 3593
o SL: 3585
o TP: 3709
________________________________________
👉 Summary: Both D1 and H4 momentum are approaching oversold, signaling that wave iv (black) may soon complete. The preferred strategy is to wait for confirmation at liquidity zones (3631 – 3595), or for a strong breakout above 3657, to join the next bullish wave v (black) targeting 3709.

Gold Nears Peak: Fed Cuts & Tensions Fuel Indian Trades!Namaste, traders! Gold (XAU/USD) bounced from an early Asian dip at $3,626-$3,627 on Monday (15/09/2025), staying strong near record highs as weak US labor data locks in a 100% chance of a 0.25% Fed rate cut on 17/09, with two more expected in October and December (CME FedWatch). Geopolitical sparks—Ukraine hitting Russian energy and Iran pushing Qatar to counter Israel—make gold a top pick for Indian traders on MCX. With big central bank moves this week, let’s dive into the market and spot trading setups! 💰
Fundamental Analysis: Gold Shines for Indian Investors 🌟
Fed Rate Cut Fever: Weak US jobs (surging claims, 911,000 jobs revised down) keep USD near its 24/07 low and Treasury yields soft, driving gold’s 39% YTD rally—perfect for INR portfolios. The Fed’s set for three rate cuts in 2025, starting 17/09.
Geopolitical Boost: Ukraine’s energy strikes on Russia, US pushing NATO sanctions, and Iran’s missile talk in Qatar ahead of the Arab-Islamic summit fuel gold’s safe-haven demand. China’s relaxed gold import rules add more bullish vibes for MCX traders!
Key Events: Watch Fed Chair Jerome Powell’s comments (17/09), Bank of Canada, Bank of England (18/09), and Bank of Japan (19/09) decisions. Soft CPI and labor data mean dips are buying opportunities—don’t miss out!
Technical Analysis: Sideways Near Highs – Buy Dips 📉
Gold’s consolidating in a wide sideways range on M30, H1, H2 around 3650. If Fed news triggers a sharp drop, FVG zones (3608-3598) are prime for buying. Watch volume to confirm entries and dodge liquidity traps near round levels.
Resistance: 3646 - 3655 - 3666
Support: 3623 - 3615 - 3608 - 3598
Trade Setups (Tight RR):
Buy Scalp:
Range: 3623 - 3621
SL: 3617
TP: 3626 - 3631 - 3636 - 3641
Buy Zone:
Range: 3608 - 3606
SL: 3598
TP: 3616 - 3626 - 3636 - 3646
Sell Scalp:
Range: 3654 - 3656
SL: 3660
TP: 3651 - 3646 - 3641 - 3636
Sell Zone:
Range: 3665 - 3667
SL: 3675
TP: 3657 - 3647 - 3637 - 3627
Gold’s holding near highs—beware liquidity traps around Fed news! Above 3623, bulls aim for new highs; below, test 3608/3598. Indian traders, keep risk tight with central bank volatility ahead! Buy dips or sell highs? Share your MCX strategies below! 👇
#Gold #XAUUSD #Fed #RateCuts #CPI #TradingView #MarketUpdate #Forex #GoldTrading #IndiaTrading #MCX #Geopolitics #CentralBanks

XAUUSD/GOLD 1H SELL PROJECTION 15.09.25XAUUSD/Gold 1H Sell Projection (15.09.25). Here’s a structured breakdown of what the chart indicates:
🔎 Chart Analysis
Entry Zone: Around 3646 – 3647 (confluence of trendline + 0.618 Fibonacci retracement = "Golden Ratio").
Stop Loss: Around 3653.16 (above trendline & key resistance).
Take Profit Targets:
TP1 (Support S1): Around 3639 – 3640
TP2 (Support S2): Around 3630 – 3631
🧭 Trade Idea (Sell Bias)
Reasoning:
Price has rejected the descending trendline resistance.
Confluence with Fibonacci 0.618 retracement level (3647).
Bearish projection towards support zones.
📌 Summary
Setup: Short/Sell
Entry Zone: 3646 – 3647
Stop Loss: 3653
Target 1: 3640
Target 2: 3630

Gold Nears Peak: Fed Cut Hype Fuels Indian Trades!Namaste, traders! Gold (XAU/USD) climbed 0.4% on Friday (12/09/2025), closing at $3,648.55/oz, just shy of its all-time high of $3,673.95/oz (09/09). With a 1.7% weekly gain—its fourth straight week up—gold is riding high on weak US labor data, cementing bets for a Fed rate cut on 17/09. CPI showed inflation up sharply, but labor weakness dominates, making gold a top pick for Indian traders on MCX. Let’s dive into the market and grab trading opportunities! 💰
Fundamental Analysis: Gold’s Shine Bright for India 🌟
Rate Cut Buzz: Weak US jobs (surging claims, 911,000 jobs revised down) and a soft PPI push 100% odds for a 0.25% Fed rate cut, with 0.5% less likely (CME FedWatch). Low rates ease USD and Treasury pressure, boosting gold’s appeal for INR portfolios.
Global Tailwinds: Gold’s 39% YTD rally (after 27% in 2024) is fueled by a weak USD, China’s 10-month gold buying spree, and global unrest. China’s move to simplify gold import rules signals stronger demand—great for Indian investors!
Market Focus: CPI (11/09) showed hotter inflation, but labor weakness keeps Fed easing on track. No major shocks (like Trump tariffs) mean dips are buying opportunities—perfect for MCX futures!
Technical Analysis: Consolidation Near Highs – Buy Dips 📉
Gold’s weekly chart shows consolidation at Fibonacci 2.618 (3650), with wide sideways action, closing below 3650 as anticipated. A deeper pullback isn’t confirmed, but liquidity zones at 359x and 354x are ideal for buying, while 370x is a sell zone if the rally continues. Watch volume for reversal or rejection signals to avoid traps.
Resistance: 3655 - 3684 - 3694 - 3704
Support: 3621 - 3595 - 3582 - 3559 - 3545
Trade Setups (Tight RR):
Buy Zone: 3582 - 3580 (SL: 3572; TP: 3590 - 3600 - 3610 - 3640) – Long-term buy on deeper dips.
Buy Zone: 3546 - 3544 (SL: 3536; TP: 3554 - 3564 - 3574 - 3594) – Buy at strong support.
Sell Zone: 3703 - 3705 (SL: 3713; TP: 3695 - 3685 - 3675 - 3665) – Sell if rally hits round levels.
Gold’s consolidating near highs—beware liquidity traps! Above 3621, bulls eye new highs; below, test 359x/354x. Indian traders, manage risk tightly for Fed volatility! Buy dips or sell highs? Share your MCX strategies below! 👇
#Gold #XAUUSD #Fed #CPI #TradingView #MarketUpdate #Forex #GoldTrading #IndiaTrading #MCX #USInflation #RateCuts #CentralBanks

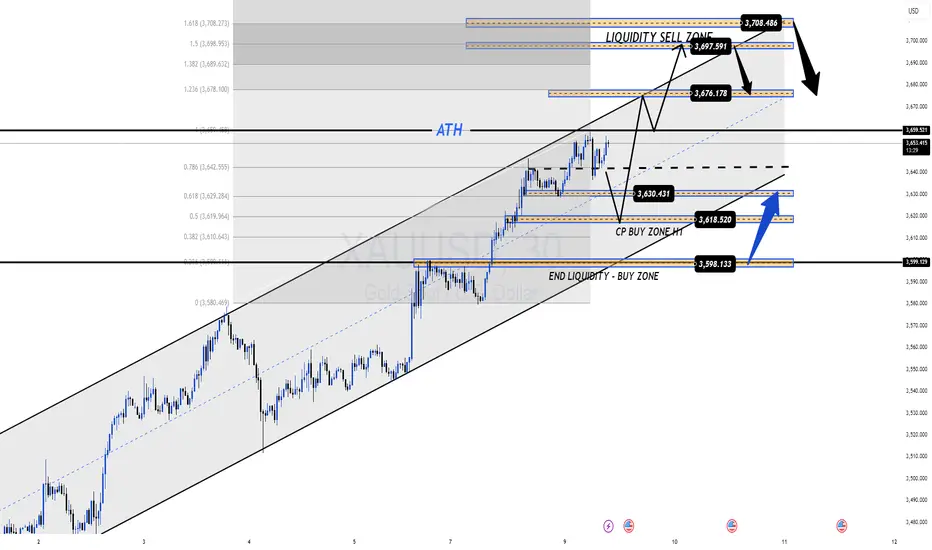
XAUUSD – Breakout Confirmed & Macro Outlook📊 Market Context & Macro View
Gold (XAUUSD) has broken out above its short-term descending trendline, signalling renewed bullish momentum after several sessions of consolidation. This breakout aligns with traders pricing in slower US inflation and growing confidence that the Federal Reserve may pause or ease monetary policy in the coming months.
🔹 Macro Drivers Supporting Gold:
Soft US CPI & PPI → Cooling inflation strengthens expectations for stable or lower rates.
Steady Treasury yields and a weaker USD continue to fuel gold’s upside.
Geopolitical tensions and central bank accumulation remain long-term bullish factors.
⚠ Risk: Liquidity sweeps remain possible before the Fed meeting—watch for fakeouts or sharp reversals.
🔑 Key Technical Levels (H1)
Immediate Resistance: 3,654.17 (React Zone FIB)
OBS Sell Zone: 3,664.52
Upper Liquidity Target: 3,679.31
Major Sell Liquidity: 3,709.85
Supports / Buy Liquidity Zones:
• 3,637.91 – Breakout Retest
• 3,631.63 – CP Support
• 3,622.41 – Deeper Liquidity Layer
• 3,584.78 – END Liquidity BUY ZONE
📈 Scenario & Outlook
London Session: Possible retest at 3,638–3,632 for liquidity collection before the next leg higher.
A clean break through 3,654 → 3,664 could spark strong buying toward 3,679–3,709.
Losing 3,622 would expose 3,584 as the next major support.
📌 Trading Plan
🔵 BUY ZONE 1: 3,635 – 3,633
SL: 3,629
TP: 3,640 → 3,645 → 3,650 → 3,660 → 3,670 → ???
🔵 BUY ZONE 2: 3,621 – 3,619
SL: 3,615
TP: 3,625 → 3,630 → 3,635 → 3,640 → 3,650 → 3,660 → ???
🔴 SELL ZONE: 3,708 – 3,710
SL: 3,715
TP: 3,704 → 3,700 → 3,695 → 3,690 → 3,680 → ???
🔴 SELL SCALP: 3,679 – 3,681
SL: 3,685
TP: 3,675 → 3,670 → 3,665 → 3,660 → ???
✅ Summary
Gold is maintaining its breakout, supported by softer US inflation and a weaker USD. While liquidity sweeps may occur, the overall trend remains bullish above 3,622.
👉 Follow MMFLOW TRADING for real-time updates, liquidity plays, and BIGWIN setups as gold reacts to key macro drivers and price zones.

Elliott Wave Analysis XAUUSD – 12/09/2025
1. Momentum
• D1: Momentum is approaching the oversold zone. We should wait for a bullish reversal signal here to confirm a new upward move.
• H4: Momentum is currently in the overbought zone and preparing to reverse. This suggests price may continue sideways or move into a corrective decline.
• H1: Momentum is also in the overbought zone and about to reverse → the current upward move is weakening, and a short-term corrective pullback is likely.
2. Wave Structure
• D1:
The market is forming a 5-wave black structure. The current D1 momentum decline is nearly complete and may reach the oversold zone within 1–2 days, signaling that wave iv (black) is close to completion.
• H4:
Price is moving sideways. Since H4 momentum is preparing to turn down from overbought, wave iv (black) may still be in progress. We need to wait until H4 momentum moves into the oversold zone and reverses up to better evaluate the completion of wave iv.
• H1:
Price has been consolidating within a high liquidity zone (Volume Profile). The sideways and time-consuming behavior fits the nature of wave iv.
o A reliable confirmation of wave iv completion would be a breakout and daily close above 3657.
o If price fails to break this level and declines further, wave iv may develop into a triangle or complex corrective pattern.
o With both H1 and H4 momentum preparing to turn down, the scenario of wave iv continuing is more likely for now.
3. Trading Plan
• Scenario 1: If price breaks and closes above 3657, wait for a retest of this level to look for a Buy Breakout targeting wave v.
• Buy Zone 1:
o Entry: 3596 – 3594
o SL: 3585
o TP: 3669
• Buy Zone 2:
o Entry: 3557 – 3555
o SL: 3547
o TP: 3597

XAUUSD – CPI Today: Liquidity Sweep & Trading Plan📊 Market View
Gold (XAUUSD) is moving under short-term resistance (descending trendline), indicating sellers still dominate in the short term. On the M30 chart, buy-side liquidity zones are clearly stacked at 3,624 → 3,612 → 3,599 → 3,586.
👉 During the European session, expect a breakdown liquidity sweep toward these support zones before any bullish reaction.
📈 CPI View – US Session
Soft CPI (below expectations) → Weaker USD, lower yields → Gold could bounce sharply from 3,612 / 3,599 / 3,586 and retest trendline/resistance.
Hot CPI (above expectations) → Stronger USD, higher yields → Gold may break 3,612, sweep deeper to 3,599 or 3,586, then recover.
⚠️ High risk of news traps: the first reaction can reverse quickly—wait for retests + confirmation candles before entering.
🔑 Key Levels
Dynamic Resistance (trendline): 3,643 – 3,646
React Zone FIB: 3,650 – 3,654
OBS Sell Zone: 3,665
Support / Liquidity Zones:
3,624.36 (Key Zone Support BUY)
3,612.60 (CP/React FIB)
3,599.31 (BUY ZONE)
3,586.49 (END LIQUIDITY – BUY ZONE)
📌 Trading Plan
🔴 SELL ZONE: 3,646 – 3,648
SL: 3,652
TP: 3,640 → 3,635 → 3,630 → 3,620 → 3,610 → ???
🔵 BUY SCALP: 3,612 – 3,610
SL: 3,605
TP: 3,616 → 3,620 → 3,625 → 3,630 → ???
🔵 BUY ZONE (Primary): 3,600 – 3,598
SL: 3,592
TP: 3,605 → 3,610 → 3,615 → 3,620 → 3,630 → 3,640 → ???
🛡️ Backup BUY: (If liquidity sweep deepens) 3,58x
Hard SL: 3,578
❗ If 3,578 breaks, don’t re-enter immediately—CPI volatility can extend the move further.
⚠️ Notes & Risk
Reduce position size near the CPI release.
Wait for confirmation (pin bar / engulfing / retest) before entering trades.
Use staggered TPs to lock in profits early.
An M30 close above 3,654 invalidates near-term shorts and opens 3,665.
✅ Summary
Gold may sweep liquidity into the buy zones before bouncing. Trade the reaction: SELL at 3,646–48 on rejection, BUY at 3,612/3,600 on a clean bounce, and hold a backup BUY at 3,58x with tight risk.
👉 Follow MMFLOW TRADING for real-time updates and BIGWIN setups during CPI volatility.

Elliott Wave Analysis XAUUSD – September 10, 2025🌀
🔹 Momentum
• D1 timeframe: Momentum is showing signs of a bearish reversal → the market may enter a corrective decline, possibly lasting through the end of this week.
• H4 timeframe: Momentum is turning upward → a short-term recovery could appear today, pushing the indicator into the overbought zone.
• H1 timeframe: Momentum is already in the overbought area and turning down → a short-term decline is likely.
________________________________________
🔹 Wave Structure
• D1: Price has reached the projected target of wave iii (black). With D1 momentum reversing downward, wave iv (black) may be forming. Since wave ii (black) was relatively long, there is a possibility that wave iv (black) could unfold more quickly.
• H4: Yesterday’s decline may suggest that wave v (purple) has temporarily completed. If this scenario plays out, price could move into a corrective phase toward the wave iv target area. The correction may develop as a Zigzag, Flat, or Triangle.
• H1: Price is consolidating within the liquidity zone 3657 – 3631. With H4 momentum hinting at correction, one possible scenario is sideways movement here to complete wave B, followed by a decline into wave C.
o If price breaks and closes below 3631 → the liquidity zone at 3595 may act as the next support.
o Potential targets for wave C:
3595 (aligned with 23.8% Fibonacci retracement).
Or 3556 – 3528 (aligned with 38.2% Fibonacci retracement).
________________________________________
🔹 Trade Scenarios (for reference only)
• Sell Zone: 3657 – 3659
o SL: 3667
o TP1: 3631
o TP2: 3563
• Buy Zone 1: 3596 – 3594
o SL: 3585
o TP1: 3669
o TP2: 3749
• Buy Zone 2: 3557 – 3555
o SL: 3547
o TP1: 3597
o TP2: 3705
📌 Note: The Sell setup at 3657 should be considered with small position size as it goes against the main trend. If price reaches 3595, this Sell scenario could lose validity.

XAUUSD – PPI Ahead: Key Liquidity Levels & Trading PlanMarket View:
After yesterday’s sharp drop where sellers dominated the liquidity zone, gold (XAUUSD) is now recovering from 362x → 364x during the Asian session. In the short term, price may range between 362x–365x in Asia/Europe before going sideways to await the PPI release in the US session.
Today’s PPI is expected at 0.3% vs 0.9% previous, signalling cooling inflation. However, actual data could come in higher – often creating a “news trap”. From a technical view, gold may need to retest 360x liquidity before resuming its uptrend ahead of CPI & the upcoming FED meeting.
👉 In short: Structure stays bullish, but short-term liquidity sweeps are likely before continuation.
Key Levels:
Resistance: 3647 – 3654 – 3665 – 3674 – 3704
Support: 3635 – 3613 – 3600 – 3586
Trading Plan:
🔵 BUY Zone: 3600 – 3598
SL: 3592 (or tighter at 3580)
TP: 3605 → 3610 → 3615 → 3620 → 3630 → 3640 → 3650+
🔴 SELL Zone: 3703 – 3705
SL: 3710
TP: 3698 → 3694 → 3690 → 3680 → 3670 → 3660+
Summary:
✅ Gold remains in an uptrend, but may retest 360x liquidity before heading higher.
✅ PPI today & CPI tomorrow could trigger traps – caution is advised.
👉 Watch the key levels and follow MMFLOW TRADING for daily updates & BIGWIN setups!

Gold Breaks $3,600/oz: Fed Rate Cut Hype & Trading Setups!Namaste, traders! Gold (XAU/USD) has blasted through $3,600/oz for the first time on Monday (08/09/2025), smashing a new all-time high as weak US jobs data ramps up bets for a Fed rate cut next week. With a massive 38% YTD gain after 27% in 2024, gold's on fire—driven by a weakening USD, central bank hoarding, easing policies, and global uncertainty. For Indian investors, this is prime time amid rising demand and INR volatility. Let’s analyze today’s (09/09/2025) market and spot trading opportunities! 💰
Fundamental Analysis: Why Gold’s Rally Is Unstoppable 🌟
Historic Break: Weak US jobs (August growth slowed, unemployment at 4.3%) has markets pricing in an 88% chance of 0.25% rate cut and 12% for 0.5% in September, per CME FedWatch. Low rates slash the opportunity cost for non-yielding gold—perfect for India’s festive season buys! 📈
Expert View: Peter Grant from Zaner Metals sees gold hitting $3,700–$3,730/oz short-term, with dips as buy chances. Ongoing labor weakness and Fed easing into 2026 will keep supporting it.
Global Boosters: China’s PBOC extended gold buys to 10 months in August. Falling USD and 10-year Treasury yields near 5-month lows make gold even more attractive for Indian rupee holders.
Data Watch: Eye US PPI (10/09) and CPI (11/09) for Fed clues. Tariff wars and geopolitics add safe-haven fuel—great for India’s gold ETFs and physical demand.
Gold’s your ultimate hedge in this setup—will the Fed’s cut keep the party going for Indian portfolios?
Technical Analysis: Breakout Frenzy with Traps—Buy the Dips! 📉
Gold’s power surge blew past 3600 with no brakes, but eye the Fibo 2.618 at 3685 for a possible breather. Bullish momentum screams BUY, but watch FVG traps from the fast climb. Key focus: 3641—break below pulls back to 3600; hold above and bulls target 3685. Ideal for Indian traders riding the rupee-gold link!
Key Resistance: 3663 - 3673 - 3685 - 3690
Key Support: 3641 - 3629 - 3596 - 3581
Trading Opportunities:
Sell Scalp: 3673 - 3675
SL: 3679
TP: 3670 - 3665 - 3660 - 3655
Sell Zone: 3684 - 3686
SL: 3694
TP: 3676 - 3666 - 3656 - 3646 - Open
Buy Scalp: 3641 - 3639
SL: 3635
TP: 3644 - 3649 - 3654 - 3659
Buy Zone: 3605 - 3603
SL: 3595
TP: 3613 - 3623 - 3633 - 3643 - Open
Gold’s breaking out big, but traps await—confirm at key levels! Holds support? Bulls aim for 3685. 📊💡
#Gold #XAUUSD #Fed #USJobs #TradingView #MarketUpdate #Forex #Investing #TechnicalAnalysis #GoldTrading #Finance #Crypto #IndiaTrading #INR #MCX

XAUUSD – Intraday Plan: Bullish Trend + Key Liquidity ZonesMarket Pulse:
The US jobs data (05/09) showed a slowdown in hiring. According to CME FedWatch, there is an 88% chance of a 0.25% Fed rate cut in September, and 12% for a 0.5% cut. Lower rates support gold as a non-yielding asset.
Gold has already gained 38% YTD, after rising 27% in 2024. A weaker USD, central bank buying (China added gold for the 10th month in a row in August), loose monetary policy, and global risks keep gold in a strong bullish trend.
👉 Market bias: Macro + liquidity flows favour BUY.
Technical View (M30):
Price stays in an up channel, making higher lows.
3616–3596 is the key support zone.
Liquidity SELL zones at 3653–3655 and 3675–3677 may give short intraday pullbacks before trend continues.
Execution Plan (Today):
🔵 BUY ZONE #1: 3618 – 3616
SL: 3610
TP: 3624 → 3630 → 3635 → 3640 → 3650 → 3660 → 3670+
🔵 BUY ZONE #2: 3598 – 3596
SL: 3590
TP: 3602 → 3606 → 3610 → 3615 → 3620 → 3630 → 3640 → 3650+
🔴 SELL ZONE #1: 3653 – 3655
SL: 3660
TP: 3648 → 3644 → 3640 → 3635 → 3630 → 3620
🔴 SELL ZONE #2: 3675 – 3677
SL: 3681
TP: 3670 → 3665 → 3660 → 3650 → 3640
Summary:
✅ Gold trend stays bullish – best setups are buying dips into liquidity zones.
⚡ Intraday scalps possible at SELL liquidity zones.
👉 Follow MMFLOW TRADING for daily precision setups.
Elliott Wave Analysis XAUUSD – 09/09/2025🌀
————————————-
🔹 Momentum
• D1 timeframe: Momentum is still rising but occurs in the overbought zone → the upside potential is limited.
• H4 timeframe: Momentum is also in the overbought zone and starting to reverse. Although H4 candles are still pushing up, a divergence is forming → signaling weakening bullish strength.
• H1 timeframe: Momentum remains in the overbought zone → no expectation for an extended bullish leg.
————————————-
🔹 Wave Structure
• D1 timeframe:
o Price is in the final stage of wave iii (black) and preparing for wave iv (black).
o By principle, it is better to stay patient and wait for wave iv to complete before looking for Buy entries into wave v (black), rather than trying to catch the top of wave iii.
o Current price is approaching the 2.618 Fibonacci extension of wave i (black).
• H4 timeframe:
o Price is currently within wave v (purple).
o Since it has already broken above wave iii (purple), a reversal could happen anytime.
o Completion of wave v (purple) will also complete wave iii (black).
• H1 timeframe:
o Inside wave v (purple), a full 5-wave structure (green) can be counted.
o The potential confluence zone for the end of wave 5 (green), wave v (purple), and wave iii (black) is 3669 – 3678.
o After this zone, price is expected to correct into wave iv (black), which often develops sideways and shallow.
➡️ Once wave iv (black) is complete, the market is expected to continue higher into wave v (black).
➡️ High liquidity zones highlighted by the Volume Profile will act as support, preventing a deep decline and providing momentum for wave v (black).
• Wave iv usually retraces back to the wave 4 of a smaller degree. Currently, we have two key areas:
o Wave 4 (green) around 3597
o Wave iv (purple) around 3552 – 3530
————————————-
🔹 Trading Plan
1. Buy Zone 1: 3598 – 3596
o SL: 3588 (or 3579 for wider risk tolerance)
o TP1: 3669
2. Buy Zone 2: 3553 – 3550
o SL: 3540
o TP1: 3597

Gold Surges 37% YTD: Fed Cuts, Jobs Slump & Trade Setups!Namaste, traders! Gold (XAU/USD) has skyrocketed 37% in 2025, building on a 27% rally in 2024, fueled by a weakening USD, central bank buying, loose monetary policies, and global economic/geopolitical unrest. With US jobs growth tanking in August 2025 and unemployment climbing to 4.3%, markets are betting big on Fed rate cuts: 90% chance of 0.25% and 10% for 0.5% in September. Let’s dive into today’s (08/09/2025) action and uncover trading opportunities tailored for Indian investors! 💰
Fundamental Analysis: Why Gold Keeps Shining Bright 🌟
Massive Rally: Gold thrives in low-rate, high-uncertainty environments—perfect for India’s gold-loving market! Weak USD and central bank purchases are key drivers. 📈
US Jobs Slump: August data shows a sharp slowdown in hiring and a 4.3% unemployment rate, boosting Fed rate cut expectations and safe-haven demand.
Fed Drama Fuels Gold: Trump’s attempt to sack Fed Governor Lisa Cook and pressure for rate cuts has sparked legal battles, shaking USD confidence. Tariff tensions (Trump’s appealing to the Supreme Court after lower court losses) further drive gold as a hedge. Standard Chartered sees more upside amid these uncertainties.
Demand Dip in India: Record-high prices have slowed physical gold demand in India and China this week, but the bullish outlook remains strong for Indian investors chasing safety.
Gold’s your ultimate bet in this volatile market—will the Fed’s next move keep the rally alive?
Technical Analysis: Breakouts & Liquidity Grabs—Stay Sharp! 📉
In today’s early Asian session, gold dipped to 358x before a swift rebound, smashing last week’s ATH resistance at 3600 and hitting 361x. No major news triggered this spike, but continuous ATHs mean fast liquidity sweeps—beware of traps! Avoid FOMO: Focus on broken round levels for BUY setups or structure breaks at round numbers for SELL, but watch out for false breakouts.
Key Resistance: 3614 - 3624 - 3634 - 3644
Key Support: 3597 - 3581 - 3574 - 3566 - 3560 - 3550
Trading Opportunities:
Sell Scalp: 3624 - 3626
SL: 3630
TP: 3621 - 3616 - 3611 - 3606
Sell Zone: 3634 - 3636
SL: 3644
TP: 3626 - 3616 - 3606 - 3596
Buy Scalp: 3596 - 3594
SL: 3591
TP: 3599 - 3604 - 3609 - 3614
Buy Zone: 3581 - 3579
SL: 3571
TP: 3589 - 3599 - 3609 - 3619
Gold’s breaking out, but fakeouts are everywhere—wait for confirmations at key levels! If supports hold, bulls could push for new highs. 📊💡

XAUUSD/Gold 1H Buy Projection – 08.09.25🔎 Chart Analysis
Price Action
Current price: 3588.15
Support Zone (S1): Around 3575 – 3578
Resistance Zones:
R1 ≈ 3590
R2 ≈ 3600+
Projection shows a possible bounce from support → break R1 → move toward R2.
Indicators
Stochastic (5,3,3):
Current: %K 21.78, %D 31.90
Oversold region → “Tends to Buy” signal.
RSI (14):
Value: 58.55 (above 50)
Suggests short-term uptrend momentum.
Overall Projection
Market bias: Bullish (Buy Setup)
If price respects support at S1, probability is high for upside movement towards R1 → R2.
Risk: If support S1 breaks, downtrend continuation is possible.
✅ Summary (08.09.25):
Buy Bias on 1H timeframe.
Support: 3575 zone
Target 1: 3590 (R1)
Target 2: 3600 (R2)
Indicators confirm bullish momentum (RSI > 50, Stoch oversold).

Elliott Wave Analysis XAUUSD – September 7, 2025
Momentum
• D1: Momentum is still declining → a corrective move may occur before turning bullish again.
• H4: Currently in the overbought zone → a main downward move is expected tomorrow.
• H1: About to enter the oversold zone → a short-term upward bounce may appear tomorrow morning.
Wave Structure
• D1 timeframe:
o Price is forming a 5-wave structure (i, ii, iii, iv, v) in black.
o Currently, wave iii (black) is in its final stage.
o Waves i, ii, iii were formed after a momentum cycle → the next corrective cycle will likely indicate where wave iv (black) will end.
• H4 timeframe:
o Price may be completing wave v (purple).
o Once wave v (purple) finishes → the market is expected to enter corrective wave iv (black).
• H1 timeframe:
o As in the previous plan, the ABC correction in blue looks like a 3-wave structure, but there is also the possibility of a Flat pattern forming.
o In a Flat scenario, price may break above the previous high and then reverse downward.
o Currently, price showed overlapping moves followed by a strong breakout → suggesting two possible scenarios:
Scenario 1:
o Wave v (purple) is unfolding, with price heading toward the wave v target.
o Two target zones: 3614 and 3678.
o In this case → avoid counter-trend trades, wait for corrective wave iv (black) to complete and then enter Buy positions in line with wave iii (black).
Scenario 2:
o A Flat structure is forming.
o Wait for wave C to complete wave iv (purple).
o H4 momentum supports this scenario (decline to oversold then reversal).
o Wave C targets: 3553 and 3530 → ideal Buy entry zone.
Trading Plan
1. Buy Zone 1: 3353 – 3350
o SL: 3340
o TP1: 3596
2. Buy Zone 2: 3532 – 3530
o SL: 3522
o TP1: 3552
