XAUUSD – PPI Ahead: Key Liquidity Levels & Trading PlanMarket View:
After yesterday’s sharp drop where sellers dominated the liquidity zone, gold (XAUUSD) is now recovering from 362x → 364x during the Asian session. In the short term, price may range between 362x–365x in Asia/Europe before going sideways to await the PPI release in the US session.
Today’s PPI is expected at 0.3% vs 0.9% previous, signalling cooling inflation. However, actual data could come in higher – often creating a “news trap”. From a technical view, gold may need to retest 360x liquidity before resuming its uptrend ahead of CPI & the upcoming FED meeting.
👉 In short: Structure stays bullish, but short-term liquidity sweeps are likely before continuation.
Key Levels:
Resistance: 3647 – 3654 – 3665 – 3674 – 3704
Support: 3635 – 3613 – 3600 – 3586
Trading Plan:
🔵 BUY Zone: 3600 – 3598
SL: 3592 (or tighter at 3580)
TP: 3605 → 3610 → 3615 → 3620 → 3630 → 3640 → 3650+
🔴 SELL Zone: 3703 – 3705
SL: 3710
TP: 3698 → 3694 → 3690 → 3680 → 3670 → 3660+
Summary:
✅ Gold remains in an uptrend, but may retest 360x liquidity before heading higher.
✅ PPI today & CPI tomorrow could trigger traps – caution is advised.
👉 Watch the key levels and follow MMFLOW TRADING for daily updates & BIGWIN setups!
Xauusdidea

Gold Breaks $3,600/oz: Fed Rate Cut Hype & Trading Setups!Namaste, traders! Gold (XAU/USD) has blasted through $3,600/oz for the first time on Monday (08/09/2025), smashing a new all-time high as weak US jobs data ramps up bets for a Fed rate cut next week. With a massive 38% YTD gain after 27% in 2024, gold's on fire—driven by a weakening USD, central bank hoarding, easing policies, and global uncertainty. For Indian investors, this is prime time amid rising demand and INR volatility. Let’s analyze today’s (09/09/2025) market and spot trading opportunities! 💰
Fundamental Analysis: Why Gold’s Rally Is Unstoppable 🌟
Historic Break: Weak US jobs (August growth slowed, unemployment at 4.3%) has markets pricing in an 88% chance of 0.25% rate cut and 12% for 0.5% in September, per CME FedWatch. Low rates slash the opportunity cost for non-yielding gold—perfect for India’s festive season buys! 📈
Expert View: Peter Grant from Zaner Metals sees gold hitting $3,700–$3,730/oz short-term, with dips as buy chances. Ongoing labor weakness and Fed easing into 2026 will keep supporting it.
Global Boosters: China’s PBOC extended gold buys to 10 months in August. Falling USD and 10-year Treasury yields near 5-month lows make gold even more attractive for Indian rupee holders.
Data Watch: Eye US PPI (10/09) and CPI (11/09) for Fed clues. Tariff wars and geopolitics add safe-haven fuel—great for India’s gold ETFs and physical demand.
Gold’s your ultimate hedge in this setup—will the Fed’s cut keep the party going for Indian portfolios?
Technical Analysis: Breakout Frenzy with Traps—Buy the Dips! 📉
Gold’s power surge blew past 3600 with no brakes, but eye the Fibo 2.618 at 3685 for a possible breather. Bullish momentum screams BUY, but watch FVG traps from the fast climb. Key focus: 3641—break below pulls back to 3600; hold above and bulls target 3685. Ideal for Indian traders riding the rupee-gold link!
Key Resistance: 3663 - 3673 - 3685 - 3690
Key Support: 3641 - 3629 - 3596 - 3581
Trading Opportunities:
Sell Scalp: 3673 - 3675
SL: 3679
TP: 3670 - 3665 - 3660 - 3655
Sell Zone: 3684 - 3686
SL: 3694
TP: 3676 - 3666 - 3656 - 3646 - Open
Buy Scalp: 3641 - 3639
SL: 3635
TP: 3644 - 3649 - 3654 - 3659
Buy Zone: 3605 - 3603
SL: 3595
TP: 3613 - 3623 - 3633 - 3643 - Open
Gold’s breaking out big, but traps await—confirm at key levels! Holds support? Bulls aim for 3685. 📊💡
#Gold #XAUUSD #Fed #USJobs #TradingView #MarketUpdate #Forex #Investing #TechnicalAnalysis #GoldTrading #Finance #Crypto #IndiaTrading #INR #MCX

XAUUSD – Intraday Plan: Bullish Trend + Key Liquidity ZonesMarket Pulse:
The US jobs data (05/09) showed a slowdown in hiring. According to CME FedWatch, there is an 88% chance of a 0.25% Fed rate cut in September, and 12% for a 0.5% cut. Lower rates support gold as a non-yielding asset.
Gold has already gained 38% YTD, after rising 27% in 2024. A weaker USD, central bank buying (China added gold for the 10th month in a row in August), loose monetary policy, and global risks keep gold in a strong bullish trend.
👉 Market bias: Macro + liquidity flows favour BUY.
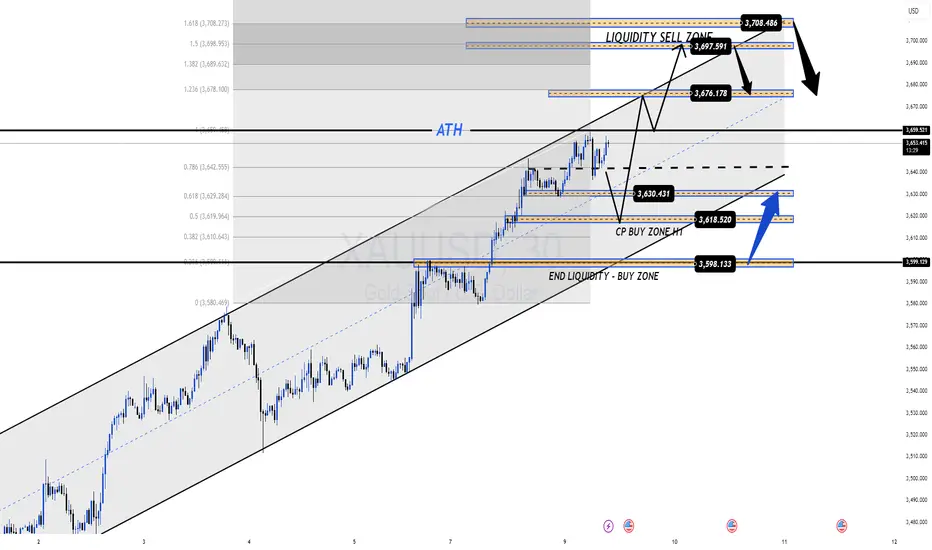
Technical View (M30):
Price stays in an up channel, making higher lows.
3616–3596 is the key support zone.
Liquidity SELL zones at 3653–3655 and 3675–3677 may give short intraday pullbacks before trend continues.
Execution Plan (Today):
🔵 BUY ZONE #1: 3618 – 3616
SL: 3610
TP: 3624 → 3630 → 3635 → 3640 → 3650 → 3660 → 3670+
🔵 BUY ZONE #2: 3598 – 3596
SL: 3590
TP: 3602 → 3606 → 3610 → 3615 → 3620 → 3630 → 3640 → 3650+
🔴 SELL ZONE #1: 3653 – 3655
SL: 3660
TP: 3648 → 3644 → 3640 → 3635 → 3630 → 3620
🔴 SELL ZONE #2: 3675 – 3677
SL: 3681
TP: 3670 → 3665 → 3660 → 3650 → 3640
Summary:
✅ Gold trend stays bullish – best setups are buying dips into liquidity zones.
⚡ Intraday scalps possible at SELL liquidity zones.
👉 Follow MMFLOW TRADING for daily precision setups.
Elliott Wave Analysis XAUUSD – 09/09/2025🌀
————————————-
🔹 Momentum
• D1 timeframe: Momentum is still rising but occurs in the overbought zone → the upside potential is limited.
• H4 timeframe: Momentum is also in the overbought zone and starting to reverse. Although H4 candles are still pushing up, a divergence is forming → signaling weakening bullish strength.
• H1 timeframe: Momentum remains in the overbought zone → no expectation for an extended bullish leg.
————————————-
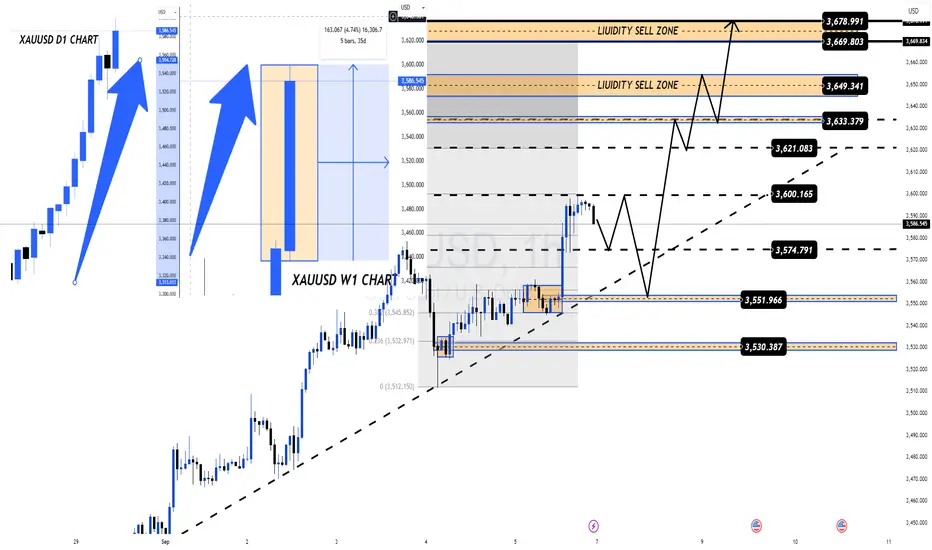
🔹 Wave Structure
• D1 timeframe:
o Price is in the final stage of wave iii (black) and preparing for wave iv (black).
o By principle, it is better to stay patient and wait for wave iv to complete before looking for Buy entries into wave v (black), rather than trying to catch the top of wave iii.
o Current price is approaching the 2.618 Fibonacci extension of wave i (black).
• H4 timeframe:
o Price is currently within wave v (purple).
o Since it has already broken above wave iii (purple), a reversal could happen anytime.
o Completion of wave v (purple) will also complete wave iii (black).
• H1 timeframe:
o Inside wave v (purple), a full 5-wave structure (green) can be counted.
o The potential confluence zone for the end of wave 5 (green), wave v (purple), and wave iii (black) is 3669 – 3678.
o After this zone, price is expected to correct into wave iv (black), which often develops sideways and shallow.
➡️ Once wave iv (black) is complete, the market is expected to continue higher into wave v (black).
➡️ High liquidity zones highlighted by the Volume Profile will act as support, preventing a deep decline and providing momentum for wave v (black).
• Wave iv usually retraces back to the wave 4 of a smaller degree. Currently, we have two key areas:
o Wave 4 (green) around 3597
o Wave iv (purple) around 3552 – 3530
————————————-
🔹 Trading Plan
1. Buy Zone 1: 3598 – 3596
o SL: 3588 (or 3579 for wider risk tolerance)
o TP1: 3669
2. Buy Zone 2: 3553 – 3550
o SL: 3540
o TP1: 3597

Gold Surges 37% YTD: Fed Cuts, Jobs Slump & Trade Setups!Namaste, traders! Gold (XAU/USD) has skyrocketed 37% in 2025, building on a 27% rally in 2024, fueled by a weakening USD, central bank buying, loose monetary policies, and global economic/geopolitical unrest. With US jobs growth tanking in August 2025 and unemployment climbing to 4.3%, markets are betting big on Fed rate cuts: 90% chance of 0.25% and 10% for 0.5% in September. Let’s dive into today’s (08/09/2025) action and uncover trading opportunities tailored for Indian investors! 💰
Fundamental Analysis: Why Gold Keeps Shining Bright 🌟
Massive Rally: Gold thrives in low-rate, high-uncertainty environments—perfect for India’s gold-loving market! Weak USD and central bank purchases are key drivers. 📈
US Jobs Slump: August data shows a sharp slowdown in hiring and a 4.3% unemployment rate, boosting Fed rate cut expectations and safe-haven demand.
Fed Drama Fuels Gold: Trump’s attempt to sack Fed Governor Lisa Cook and pressure for rate cuts has sparked legal battles, shaking USD confidence. Tariff tensions (Trump’s appealing to the Supreme Court after lower court losses) further drive gold as a hedge. Standard Chartered sees more upside amid these uncertainties.
Demand Dip in India: Record-high prices have slowed physical gold demand in India and China this week, but the bullish outlook remains strong for Indian investors chasing safety.
Gold’s your ultimate bet in this volatile market—will the Fed’s next move keep the rally alive?
Technical Analysis: Breakouts & Liquidity Grabs—Stay Sharp! 📉
In today’s early Asian session, gold dipped to 358x before a swift rebound, smashing last week’s ATH resistance at 3600 and hitting 361x. No major news triggered this spike, but continuous ATHs mean fast liquidity sweeps—beware of traps! Avoid FOMO: Focus on broken round levels for BUY setups or structure breaks at round numbers for SELL, but watch out for false breakouts.
Key Resistance: 3614 - 3624 - 3634 - 3644
Key Support: 3597 - 3581 - 3574 - 3566 - 3560 - 3550
Trading Opportunities:
Sell Scalp: 3624 - 3626
SL: 3630
TP: 3621 - 3616 - 3611 - 3606
Sell Zone: 3634 - 3636
SL: 3644
TP: 3626 - 3616 - 3606 - 3596
Buy Scalp: 3596 - 3594
SL: 3591
TP: 3599 - 3604 - 3609 - 3614
Buy Zone: 3581 - 3579
SL: 3571
TP: 3589 - 3599 - 3609 - 3619
Gold’s breaking out, but fakeouts are everywhere—wait for confirmations at key levels! If supports hold, bulls could push for new highs. 📊💡

XAUUSD/Gold 1H Buy Projection – 08.09.25🔎 Chart Analysis
Price Action
Current price: 3588.15
Support Zone (S1): Around 3575 – 3578
Resistance Zones:
R1 ≈ 3590
R2 ≈ 3600+
Projection shows a possible bounce from support → break R1 → move toward R2.
Indicators
Stochastic (5,3,3):
Current: %K 21.78, %D 31.90
Oversold region → “Tends to Buy” signal.
RSI (14):
Value: 58.55 (above 50)
Suggests short-term uptrend momentum.
Overall Projection
Market bias: Bullish (Buy Setup)
If price respects support at S1, probability is high for upside movement towards R1 → R2.
Risk: If support S1 breaks, downtrend continuation is possible.
✅ Summary (08.09.25):
Buy Bias on 1H timeframe.
Support: 3575 zone
Target 1: 3590 (R1)
Target 2: 3600 (R2)
Indicators confirm bullish momentum (RSI > 50, Stoch oversold).

Elliott Wave Analysis XAUUSD – September 7, 2025
Momentum
• D1: Momentum is still declining → a corrective move may occur before turning bullish again.
• H4: Currently in the overbought zone → a main downward move is expected tomorrow.
• H1: About to enter the oversold zone → a short-term upward bounce may appear tomorrow morning.
Wave Structure
• D1 timeframe:
o Price is forming a 5-wave structure (i, ii, iii, iv, v) in black.
o Currently, wave iii (black) is in its final stage.
o Waves i, ii, iii were formed after a momentum cycle → the next corrective cycle will likely indicate where wave iv (black) will end.
• H4 timeframe:
o Price may be completing wave v (purple).
o Once wave v (purple) finishes → the market is expected to enter corrective wave iv (black).
• H1 timeframe:
o As in the previous plan, the ABC correction in blue looks like a 3-wave structure, but there is also the possibility of a Flat pattern forming.
o In a Flat scenario, price may break above the previous high and then reverse downward.
o Currently, price showed overlapping moves followed by a strong breakout → suggesting two possible scenarios:
Scenario 1:
o Wave v (purple) is unfolding, with price heading toward the wave v target.
o Two target zones: 3614 and 3678.
o In this case → avoid counter-trend trades, wait for corrective wave iv (black) to complete and then enter Buy positions in line with wave iii (black).
Scenario 2:
o A Flat structure is forming.
o Wait for wave C to complete wave iv (purple).
o H4 momentum supports this scenario (decline to oversold then reversal).
o Wave C targets: 3553 and 3530 → ideal Buy entry zone.
Trading Plan
1. Buy Zone 1: 3353 – 3350
o SL: 3340
o TP1: 3596
2. Buy Zone 2: 3532 – 3530
o SL: 3522
o TP1: 3552

Weekly Outlook: Big Bullish Move + Key US DataMarket View:
Gold (XAUUSD) finished the week with strong momentum after Nonfarm pushed price close to $3600/oz ATH. On the daily chart, the candle closed almost full body (only ~30% wick), showing no profit-taking yet. The weekly chart is also strongly bullish – confirming that buyers are in control. This signals more upside likely in the coming week and month.
Key US Events This Week:
Wed, Sep 10: Core PPI & PPI m/m → If higher than expected, USD may strengthen short-term, creating pressure on gold.
Thu, Sep 11: CPI (Core, m/m, y/y) + Jobless Claims → the most important release. Lower CPI + higher claims = bullish for gold. Higher CPI = hawkish Fed = pressure.
Fri, Sep 12: UoM Consumer Sentiment & Inflation Expectations → could shift Fed outlook further.
👉 Fundamentals may bring volatility, but overall medium-term trend remains bullish.
Technical Outlook (H1 Chart):
After the Nonfarm breakout, gold is consolidating sideways. Levels to watch:
Support: 3574 – 3551 – 3530 – 3516
Resistance: 3600 – 3621 – 3633 – 3649 – 3669 – 3678
Trading Plan:
BUY bias (preferred):
Long on dips near 3574–3550
SL: below 3530
TP: 3600 → 3621 → 3633 → 3649 → 3669 → 3678
SELL scalp (alternative):
Only if 3530 breaks with strong CPI surprise → target 3516/3527
Summary:
✅ Gold stays in a strong uptrend on Daily & Weekly charts. Macro factors support more upside if inflation keeps easing.
👉 Watch 3592 (bullish trigger) and 3575 (bearish trigger) as the key decision levels.
Follow MMFLOW TRADING for daily plans and quick updates.
Gold Price Analysis – Testing Resistance near Sell ZoneAnalysis:
Gold (XAU/USD) is currently trading around 3,551.40, showing minor intraday losses (-0.03%). The chart indicates a strong resistance zone between 3,556–3,563, identified as the “sell zone,” with an All-Time High (ATH) slightly above at 3,578.12. Price is consolidating beneath this resistance, struggling to break higher.
The Fair Value Gap (FVG) below suggests a potential retracement toward 3,511–3,520 if sellers gain momentum. The Ichimoku cloud shows mixed signals, with price hovering around the equilibrium, indicating indecision in the short term.
A break above 3,563 could trigger bullish continuation toward ATH, while rejection at this level may lead to a pullback into the highlighted FVG region.

Gold Slips After Peak: Trade Fed Uncertainty & Jobs Report!Hello traders! Gold (XAU/USD) pulled back on Thursday (04/09/2025) as investors took profits after its record-breaking rally, with focus now shifting to the upcoming US jobs report for fresh signals on the Fed’s policy path. Spot gold closed down 0.3% at $3,547.68/oz—is this a buying dip or a reversal? Let’s dive in and uncover trading setups! 💰
Fundamental Analysis: What’s Behind Gold’s Dip & Potential Rebound? 🌟
Profit-Taking Post-Record: Gold eased after hitting an all-time high of $3,578.50/oz on 03/09, driven by weak job openings data that bolstered rate cut bets and ongoing uncertainty fueling safe-haven demand. 📉
US Jobs Report Looms: Set for release tomorrow (05/09), this key report follows early-session data showing US jobless claims rising more than expected last week, signaling a softening labor market.
Fed Signals & Rate Cut Buzz: Several Fed officials on 03/09 highlighted labor market concerns, reinforcing confidence in rate cuts. Markets now see a 98% chance of a 0.25% rate cut this month, per CME FedWatch. As a non-yielding asset, gold thrives in low-rate and uncertain environments! 🏦
Fed Drama Heats Up: Trump’s attempt to fire Fed Governor Lisa Cook has sparked a serious legal challenge, raising fresh concerns about Fed independence. Coupled with tariff tensions (Trump’s appealing to the Supreme Court after two lower court losses), this is eroding USD asset confidence and boosting gold demand.
Bullish Outlook: Standard Chartered predicts further gains, citing persistent tariff uncertainty and Fed independence fears as key safe-haven drivers.
Technical Analysis: Consolidation Before Big Data—Buy Dips or Wait? 📉
Gold has been trading in an uptrend channel, with early-session accumulation. After a strong Asian session push, it hit the 356x OB zone and dropped quickly. The European session may see sideways action, awaiting tonight’s critical data. If gold holds the channel, bulls could take charge—watch for breakouts!
Key Resistance: 3560 - 3576 - 3586
Key Support: 3540 - 3526 - 3500 - 3490 - 3476
Trading Opportunities:
Sell Scalp: 3558 - 3560
SL: 3564
TP: 3555 - 3545 - 3535
Sell Zone: 3576 - 3578
SL: 3587
TP: 3568 - 3558 - 3548 - 3538
Buy Scalp: 3526 - 3524
SL: 3520
TP: 3529 - 3539 - 3549
Buy Zone: 3500 - 3498
SL: 3490
TP: 3508 - 3518 - 3518 - 3538
Gold’s in consolidation mode, but the jobs report could trigger a breakout—manage risk tightly! If it holds above supports, bulls may push for new highs post-data. 📊💡
#Gold #XAUUSD #Fed #USJobs #TradingView #MarketUpdate #Forex #Investing #TechnicalAnalysis #GoldTrading #Finance #Crypto

Trade the Fed Drama & Jobs Data Wave!Fundamental Analysis: Why Gold’s Rally Is Unstoppable 🌟
Historic Surge: Gold soared to an all-time high before US jobs data showed a sharper-than-expected drop in July 2025 openings and steady hiring, pointing to a softening labor market. This fueled gold’s rise, with $3,600/oz as the next target. 📈
Fed Rate Cut Fever: Post-data, the odds of a 0.25% rate cut at the Fed’s Sept 16-17 meeting jumped from 92% to 98%, per CME FedWatch. Fed Governor Christopher Waller stressed the need for a cut this month, with future moves tied to economic trends. 🏦
Key Data Ahead: All eyes are on today’s (04/09) ADP employment and US jobless claims, plus the big monthly payrolls report on 05/09. These could steer the Fed’s path and gold’s trajectory.
Fed Drama Boosts Gold: On Sept 3, Fed Governor Lisa Cook pushed back against Trump’s attempt to oust her, while Trump keeps slamming Chair Jerome Powell for not cutting rates. Worries about Fed independence are shaking confidence in USD assets, making gold the go-to safe haven. Trump’s also gearing up to appeal tariffs to the Supreme Court after two lower court losses. ⚖️🇺🇸
Gold’s Sweet Spot: As a non-yielding asset, gold shines in uncertain times and low-rate environments—perfect for India’s gold-loving market!
Technical Analysis: Bullish Run Continues, Buy Dips but Watch Reversals! 📉
After the Asian session opened, gold plunged to the 351x zone before bouncing back above 352x. This could be big players flushing out retail liquidity—a classic move during relentless all-time highs (ATHs) that create large FVGs. Stick to BUY if gold holds above 352x, but if it fails to break 365x today, brace for a SELL reversal, especially with ADP Nonfarm data incoming. Stay sharp for volatility!
Key Resistance: 3545 - 3561 - 3578 - 3586 - 3596
Key Support: 3521 - 3508 - 3493 - 3475
Trading Opportunities:
Sell Scalp: 3560-3562
SL: 3566
TP: 3557 - 3552 - 3547
Sell Zone: 3594 - 3596
SL: 3604
TP: 3586 - 3576 - 3566 - 3566 - 3546
Buy Scalp: 3508 - 3506
SL: 3502
TP: 3511 - 3516 - 3521
Buy Zone: 3493 - 3491
SL: 3483
TP: 3501 - 3511 - 3521 - 3531 - Open
Gold is blazing, but today’s data could shake things up—keep your risk tight! If it stays above 352x, bulls might charge to new highs. 📊💡

Elliott Wave Analysis XAUUSD – September 5, 2025
————————————
Momentum
• D1: Momentum has already turned bearish, suggesting that in the coming days we could see a corrective decline. Since today is Friday, be cautious of potential liquidity sweeps before the weekly close.
• H4: Momentum is still rising, but with about 1 hour left before the current H4 candle closes, it is likely to enter the overbought zone, which would increase the risk of reversal.
• H1: Momentum is weakening and preparing to reverse, showing that the current upward move is losing strength.
————————————
Wave Structure
• D1: No major changes. A corrective decline is likely in the coming days. The depth of this correction will help us identify the exact wave structure. For now, patience is needed until D1 momentum reaches the oversold area and new patterns form.
• H4: Price still seems to be in the corrective phase of wave iv (purple). With H4 momentum about to enter the overbought zone, I still expect a downward move to complete wave iv before the market continues upward into wave v (purple).
• H1: We can see an ABC (green) structure forming, as mentioned yesterday. However, because it developed quite quickly, it could also evolve into a Flat, Triangle, or Combination pattern.
o Price is moving in a choppy, overlapping manner.
o Combined with H4 momentum nearing overbought → it’s likely that wave B is forming, followed by a downward move to complete wave iv (purple).
o If a Flat plays out, price could rise toward 3578 (or higher) before dropping back below that level.
————————————
Targets
• Wave C: We need to wait for wave B to complete before setting more reliable targets. For now, keep yesterday’s target zones: 3498 – 3469.
• Wave v (purple): No significant change compared to yesterday’s plan.
————————————
Trading Plan
Buy Zone 1: 3500 – 3498
• SL: 3490
• TP1: 3524
Buy Zone 2: 3471 – 3469
• SL: 3459
• TP1: 3500

GOLD Daily Plan – Sideway before ADP & NFP | MMFLOW TRADINGAfter yesterday’s strong rally, Gold (XAUUSD) corrected by over 60 Prices, moving back to the VPOC 3537 zone. This pullback indicates a potential short-term ATH near 357x, where SELL positions were shaken out and BUY positions booked profits.
Currently, Gold is consolidating ahead of ADP today and NFP tomorrow. With ADP expected at 73K vs. 104K previously, weaker job data could pressure USD and provide upside momentum for Gold.
The 60+ point drop highlights profit-taking by institutions and created liquidity gaps on both sides, bringing price into the 353x–354x sideway zone. A clear breakout of this zone will decide today’s trend direction.
🔑 Key Resistance Levels
3540 – 3548 – 3560 – 3576
🔑 Key Support Levels
3526 – 3515 – 3502 – 3490 – 3476
📌 Trade Setups (MMFLOW Trading View)
🔵 BUY Scalp: 3502 – 3500
🔴 SL: 3494
✔️ TP: 3506 – 3510 – 3520 – 3530 – 3540 – ???
🔵 BUY Zone: 3477 – 3475
🔴 SL: 3470
✔️ TP: 3485 – 3495 – 3500 – 3510 – 3520 – 3530 – 3540 – 3550 – ???
🔵 SELL Scalp: 3559 – 3561
🔴 SL: 3566
✔️ TP: 3554 – 3550 – 3540 – 3530 – 3520 – 3510 – 3500 – ???
🔵 SELL Zone: 3574 – 3576
🔴 SL: 3580
✔️ TP: 3570 – 3560 – 3550 – 3540 – 3530 – ???
📊 MMFLOW TRADING View:
Today’s outlook suggests continued correction before ADP/NFP releases. Sideway accumulation dominates between 353x–354x, but whichever side breaks first will set the day’s direction.

Elliott Wave Analysis XAUUSD – 4/9/2025
Momentum
• D1: Currently showing bearish reversal signals. We need to wait for today’s daily candle close to confirm. If confirmed, it is likely that the recent rally has ended and the market will enter a corrective phase lasting several days.
• H4: Momentum is moving into the oversold zone, suggesting that the current downward correction may be close to completion. Afterward, a rebound is expected within the next 1–2 H4 candles.
• H1: Momentum is in the oversold zone and showing signs of turning upward, indicating a short-term bullish bounce is likely.
Wave Structure
• D1: The first bearish candle has appeared after a steep rally, suggesting a 5-wave structure. The ongoing correction will help determine whether this was the completion of a larger Wave 5 or just Wave 1 within Wave 5.
• H4: After reaching 3578, price turned lower. This likely marked the completion of black Wave 5, as well as the green wave and purple Wave iii. The market is now in the corrective phase of purple Wave iv.
• H1: Purple Wave iii has completed, including both black Wave 5 and green Wave v. An ABC corrective structure is currently forming, but its formation time is relatively short, which means extra caution is needed as the correction may not be fully completed or could extend further.
📍 Target zones for the completion of purple Wave iv:
• Zone 1: 3498
• Zone 2: 3469
Once purple Wave iv is completed, the uptrend is expected to continue into purple Wave v with projected targets:
• Target 1: 3602
• Target 2: 3667
Trading Plan
• Buy Zone 1: 3500 – 3498
o SL: 3490
o TP1: 3524
• Buy Zone 2: 3471 – 3469
o SL: 3459
o TP1: 3500

Gold Smashes Records: Trade the Fed Drama & Rate Cut Hype!Fundamental Analysis: Why Gold Keeps Breaking Records! 🌟
New Peaks: Spot gold hit a record $3,527.5/oz on September 2, with analysts predicting a climb to $3,600-$3,900 this year, potentially surpassing $4,000 by 2026 if economic and geopolitical uncertainty persists. Reuters polls show 2025 average price forecasts rising from $2,756/oz (January) to $3,220/oz (July). 📈
Fed Rate Cut Buzz: Fed Chair Jerome Powell acknowledged rising job market risks, boosting bets for a September rate cut. “A weakening USD, fueled by rate cut expectations, investor aversion to US assets, and tariff-related economic uncertainty, supports gold,” says Ricardo Evangelista from ActivTrades. Gold thrives in low-rate environments! 🏦
USD Weakness: The USD has lost nearly 11% since Trump’s return to the White House in January 2025, making gold more attractive to foreign currency holders. 📉
Fed Drama: Trump’s criticism of Powell and attempts to oust Fed Governor Lisa Cook have raised fears about Fed independence, driving safe-haven gold demand. “Speculative bullishness stems from potential Fed interference and concerns over the USD’s safe status,” notes Carsten Menke from Julius Baer. ⚖️🇺🇸
Other Drivers: Middle East tensions, Russia-Ukraine conflict, and central bank buying (e.g., China’s PBOC added gold for the 9th consecutive month in July 2025). The World Gold Council (WGC) reports central banks plan to increase gold reserves while reducing USD holdings. “Rising gold prices and central bank accumulation are boosting gold’s share in reserves,” says Michael Hsueh from Deutsche Bank. Gold ETFs like SPDR Gold Trust saw holdings rise 12% YTD to 977.68 tons, the highest since August 2022.
Technical Analysis: Bullish Surge Continues, Prioritize BUY but Watch for Pullbacks! 📉
Gold keeps setting new highs, breaking through the round 3,500 level, dipping briefly to 3,469, then surging to 3,54x—near the Fibonacci extension 0.618. No clear reversal signals yet, so prioritize BUY if gold retraces to 3,52x or 3,51x. Bulls remain in control!
Key Resistance: 3,554 - 3,564 - 3,574
Key Support: 3,521 - 3,508 - 3,450 - 3,475
Trading Opportunities:
Sell Scalp : 3,543 - 3,545
SL: 3,549
TP: 3,540 - 3,535 - 3,530
Sell Zone : 3,571 - 3,573
SL: 3,581
TP: 3,563 - 3,553 - 3,543 - 3,523
Buy Scalp: 3,510 - 3,508
SL: 3,504
TP: 3,513 - 3,518 - 3,528
Buy Zone: 3,475 - 3,473
SL: 3,465
TP: 3,483 - 3,493 - 3,503 - 3,513 - Open
#Gold #XAUUSD #Fed #Trump #TradingView #MarketUpdate #Forex #Investing #TechnicalAnalysis #GoldTrading #Finance #Crypto

GOLD crosses $3500! What’s next for Indian traders?Gold (XAUUSD) has shown massive momentum, moving nearly 50–60 points daily. Price is now reacting at an important FIBO extension level. Sellers are stepping in, but so far there is no strong confirmation on higher timeframes (H1–H2).
📊 MMFLOW VIEW
Sideways consolidation → Breakout → New ATHs every day.
Liquidity & FVG zones are still favoring the BUY side.
SELL is only safe when higher timeframe volume confirms.
For now: Focus on BUY entries from liquidity zones.
🔑 KEY LEVELS
Resistance: 3440–3446 (ATH) | 3564 | 3576 | 3586 | 3595
Support: 3528 | 3508 | 3494 | 3480 | 3468
🎯 MMFLOW PLAN
✅ BUY ZONE: 3481 – 3479
SL: 3474
TP: 3486 – 3490 – 3495 – 3500 – 3510 – 3520 – 3530 – ???
✅ BUY SCALP: 3496 – 3494
SL: 3490
TP: 3500 – 3510 – 3520 – 3530 – 3540 – ???
❌ SELL ZONE: 3576 – 3578
SL: 3584
TP: 3570 – 3565 – 3560 – 3555 – 3550 – 3540 – 3530 – 3520 – 3510 – 3500
⚠️ Important for Indian traders: GOLD is extremely volatile right now. Don’t rush into trades.
👉 Wait for confirmation at Key Levels, use proper Risk Management, and target smart entries for maximum profit.
🔥 This is the MMFLOW TRADING PLAN – Follow us on TradingView for daily GOLD strategies and never miss the next big move!

Gold Approaches All-Time High with Strong Bullish MomentumAnalysis:
Gold (XAU/USD) is showing strong bullish momentum after breaking through the buy zone around the $3,450 level. Price action has respected the ascending channel and successfully pushed above key resistance levels.
Currently, gold is trading at $3,473, with the next major target set at the all-time high (ATH) of $3,550, as highlighted on the chart. The breakout above the consolidation zone suggests continued buyer strength, supported by high trading volume.
If the bullish momentum sustains, we can expect a new ATH around $3,550+, while a failure to hold above $3,450 may bring a short-term pullback toward $3,400 – $3,346 support levels.
Overall, sentiment remains bullish, and gold looks ready to test higher highs if momentum continues.
Would you like me to also create a trade plan (entry, stop loss, take profit levels) for this setup?

Elliott Wave Analysis XAUUSD – 03/09/2025
Momentum
• D1: Momentum is still overlapping. As mentioned in the previous plan, with 6 consecutive daily candles in this condition, a reversal may occur today or tomorrow.
• H4: Momentum is preparing to turn bearish. If a confirming candle closes, we may see a downward move on H4.
• H1: Momentum is also turning bearish but right above the oversold zone. This suggests the correction on H1 may be near completion, followed by another upward move.
________________________________________
Wave Structure
• D1: Price is still in an uptrend, possibly wave 1 of wave 5 or the final larger wave 5. Current wave targets are 3602 or 3667. This aligns with momentum on D1, which has been overlapping for 6 candles, signaling that in 1–2 more candles a reversal is likely.
• H4: A 5-wave purple structure is forming – the dominant structure of the current rally. Price is currently running in wave iii (purple).
o Inside wave iii purple, a 5-wave green structure has already formed and is nearing its final stage.
o Wave iii and iv green appear completed, and price is now in wave v green, which has broken the previous high of wave iii green, confirming its development.
• H1:
o The first target of wave v green was hit at 3542. The second target remains at 3585.
o Within wave v green, a 5-wave black sub-structure is visible.
o The Asian session opened with a breakout above the previous high, implying 2 scenarios:
1. Wave 5 black has completed after reaching the first target (3542).
2. Or it is forming a wave 4 black flat, holding above 3525 before heading to 3570–3585.
If price drops below 3525, it means wave 5 black has completed. Then, wave iv purple will target the zones 3498 and 3469 – areas to look for the next buy opportunity.
________________________________________
Trading Plan
• Buy Zone 1: 3500 – 3498
o SL: 3400
o TP1: 3524
• Buy Zone 2: 3471 – 3469
o SL: 3459
o TP1: 3500

Elliott Wave Analysis – XAUUSD 2/9/2025
Momentum
• D1: Momentum is still overbought and has been “sticking together” for about 5 consecutive daily candles. Usually, this amount of candles is enough for a potential reversal. This suggests that price may rise for only 1–2 more D1 candles before a daily reversal occurs.
• H4: Momentum is currently turning upward, which indicates that today the market is likely to continue higher for at least 2 more H4 candles.
• H1: Momentum is turning down. This implies that before H4 can continue its upward move, H1 may first produce a short corrective pullback and then resume the uptrend in line with H4.
——————————————-
Wave Structure
• D1: Price is still within wave 5 after completing a correction. Since D1 momentum has already stayed overbought for 5 candles, a multi-day correction may soon develop. This correction will clarify whether the current move is wave 1 of a larger wave 5, or if the larger wave 5 has already finished.
• H4: Price is completing the 5-wave structure (1-2-3-4-5 in red). Breaking above the wave 3 high confirmed that wave 5 in red is unfolding. With momentum on H4 turning up, the upward progress of wave 5 in red is expected to continue.
• H1: Within the 5-wave red structure, we can currently count 9 waves, where the upward waves are nearly equal in length. This reflects an extended wave iii (green). Counting 9 waves also hints that wave iii green is near its end, which implies wave 5 red may also be approaching completion.
Drawing an Elliott channel from wave 2 to wave 4 (red) and extending it over the top of wave 3 shows that wave 5 red is nearing the upper boundary of the channel. This supports the expectation that wave 5 red is close to finishing.
On a smaller scale, the current short-term decline in H1 looks like wave 4 of wave 5 red. The target zones for wave 4 have already been marked on the chart.
—————————————
Principle & Plan
• We do not enter against wave iii, especially in the case of an extended wave iii.
• Wait for wave iv to complete in order to look for buying opportunities into wave v (green).
—————————————
Wave iv targets:
• 23.6% retracement of wave iii: 3479.3
• 38.2% retracement of wave iii: 3459.7
Wave 5 target:
• Projected at 3577.6 (the farthest TP).
—————————————
Trading Plan
• Buy Zone 1: 3481 – 3478
o SL: 3470
o TP1: 3521
• Buy Zone 2: 3461 – 3459
o SL: 3450
o TP1: 3521

Gold Surges $70+ – Is XAUUSD Ready for the Next Big Move?🔥 Market Update
Gold (XAUUSD) just made a massive rally of more than $70, shaking the entire trading community.
The rise in geopolitical tensions is pushing safe-haven demand to extreme levels, and gold has once again become the most-watched asset worldwide.
For Indian traders, where gold holds not just market value but also cultural importance, this move is a wake-up call – volatility is at its peak, and discipline is key.
🔎 Macro Outlook
🌍 Global geopolitical risks → Strong inflows into gold as a safe haven.
💵 USD and bond yields are not enough to stop buyers rushing to gold.
📊 Upcoming US PCE data & Fed decisions could bring even bigger swings.
📊 Technical View (H4)
After the sharp rally, gold built a base around CP Zone H4 before breaking out again.
Key Support Levels
3,462 – 3,443 → Must hold to keep the bullish structure intact.
Key Resistance Levels
3,487 – 3,518 → Likely area for pullback or reaction.
A clean break could target 3,536+ next.
📌 Possible Market Scenarios
✅ Scenario 1 (Preferred)
Price holds above 3,462 → Tests 3,511 – 3,518 and can push towards 3,536.
⚠️ Scenario 2 (Deeper Pullback)
Break below 3,462 → Retest of 3,443 before buyers step back in.
🎯 Trade Plan (Reference Only)
✅ BUY ZONE 1
Entry: 3453 – 3451
SL: 3446
TP: 3460 – 3465 – 3470 – 3475 – 3480 – ???
✅ BUY ZONE 2
Entry: 3444 – 3442
SL: 3438
TP: 3450 – 3460 – 3470 – 3480 – ???
❌ SELL ZONE
Entry: 3512 – 3514
SL: 3518
TP: 3505 – 3500 – 3495 – 3490 – 3480 – 3470
💡 Key Takeaways for Indian Traders
Gold is in a powerful uptrend, driven by global uncertainty.
But after such a sharp move, a technical pullback is very possible.
Best approach now:
✔️ Wait for dip-buying opportunities near strong supports.
✔️ Respect stop loss – capital protection comes first.
✔️ Keep an eye on global news that can spark instant volatility.
This is the kind of market where patience + discipline = survival and profit. 🚀

XAU/USD Ready For Big Dhamaaka - Neal BhaiXAU/USD Ready For Big Dhamaaka, don't miss it. jackpot neal bhai ka.... rok sako to rok lo.

XAU/USD Magical Level for Trading: $400 Up or Down?XAU/USD (Gold) Magic Level for Trading: Can It Move $400 Up or Down till September 2025? - By Neal Bhai, India
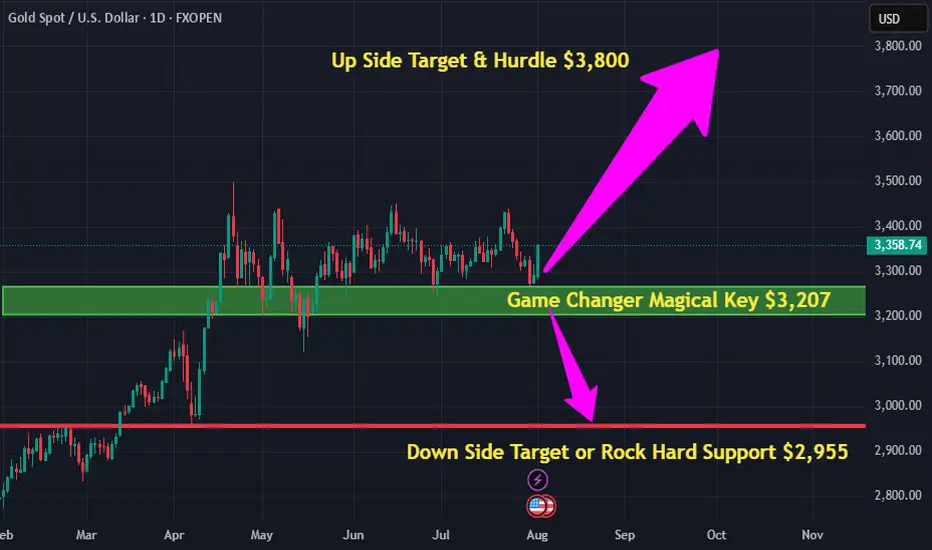
Gold (XAU/USD) Targets $3,397 – $3,406 Amid Bullish MomentumAnalysis:
The 4H chart of Gold (XAU/USD) shows strong bullish momentum after a corrective phase. Price has broken above consolidation and is currently trading around $3,382, with upside targets at $3,397 and $3,406 (highlighted resistance zone).
The supply zone on the higher timeframe remains intact below $3,280, acting as a long-term support.
Immediate support levels lie at $3,371, $3,356, and $3,348. A break below these could shift momentum bearish.
Current bullish structure suggests that as long as price holds above $3,371, buyers may drive the price higher toward the resistance levels.
A rejection from $3,406 may lead to a pullback toward the mid-support zone before another attempt higher.
