Elliott Wave Analysis – XAUUSD 20/8/2025
1. Momentum
• D1 timeframe: Momentum lines are still “sticking” together, signaling that the bearish pressure is weakening. However, without a strong bullish D1 candle to confirm reversal, there is still a risk of sudden downward spikes. Patience is required until a clear bullish confirmation appears.
• H4 timeframe: Momentum is currently turning bullish, suggesting a potential upward move today. But caution is needed: if the bullish candles are short, overlapping each other, and when momentum reaches the overbought zone without breaking the previous high → this move is likely just a corrective rebound.
• H1 timeframe: Momentum is in the overbought area, indicating the possibility of a minor pullback or sideways movement in the short term.
2. Wave Structure
• D1 timeframe: The corrective triangle structure remains valid (only invalidated if price breaks below 3270). The main scenario continues to favor wave 1 and 2 in blue, with price currently in wave 2.
• H4 timeframe: The decline in wave C shows overlapping sub-waves, each formed by 3-wave structures, hinting at the possibility of an ending diagonal for wave C. The pattern is not yet complete, so we need further observation for confirmation.
• H1 timeframe: Within the 5-wave structure of an ending diagonal, wave 3 is typically the strongest and a divergence usually occurs between wave 3 and wave 5 on RSI. Yesterday’s decline pushed RSI into the oversold zone, but no divergence has formed yet. Combined with H4 momentum turning bullish, this suggests the current move is likely wave 3 (yellow). A corrective wave 4 upward is expected, followed by a final decline to complete wave 5 with RSI divergence. Once wave 5 ends, the entire wave C diagonal will be complete, paving the way for a strong bullish rally — a typical characteristic of ending diagonals.
3. Trading Plan
The strategy is based on the ending diagonal pattern:
• Conservative approach: Wait for a breakout above the upper boundary of the diagonal before entering.
• Aggressive approach: Wait for wave 5 to complete and enter at the projected bottom of wave 5.
Trade setup:
• Buy Zone: 3301 – 3299
• Stop Loss (SL): 3219
• Take Profit (TP1): 3314
• Take Profit (TP2): 3362
• Take Profit (TP3): 3381
Xauusdidea

Elliott Wave Analysis – XAUUSD 19/8/2025
1. Momentum
• D1 timeframe: Price is still waiting for confirmation of a bullish reversal in the oversold zone. The current decline has lasted for 7 daily candles, which is usually sufficient for a corrective wave → suggesting the down move is in its final stage.
• H4 timeframe: Momentum is preparing for a bullish reversal in the oversold zone. We can expect 4–5 bullish H4 candles ahead, indicating a possible upward move today.
• H1 timeframe: Momentum is tightening in the overbought zone.
o If price makes a strong rally above 3343, the bullish move will be confirmed.
o If price continues to consolidate sideways, a downward liquidity sweep may occur before pushing higher.
2. Wave Structure
• D1 timeframe: Expectation remains that the abcde red triangle correction has been completed. The market is likely forming waves 1 and 2 (blue) of a new 5-wave bullish sequence.
• H4 timeframe: The red ABC correction has already reached its first target at 3322. Combined with reversal signals on D1 and H4, this level could mark the bottom of wave C red or wave 2 blue.
• H1 timeframe: After a strong rally yesterday, price is now in a deep pullback. This is likely wave 2 red, following the completion of wave 1 red.
o Wave 2 has retraced to the 0.782 Fibonacci level of wave 1, making it a potential ending point.
o However, since H1 momentum is still in the overbought zone, another drop is still possible.
o If price breaks below 3324, then wave C might still be in progress, with key support zones at 3322 – 3315 – 3300.
3. Trading Plan
• Current Buy position 3329–3332 is running with about 100 pips profit → this trade can be held for longer.
o TP1: 3343
o TP2: 3362
o TP3: 3381
• If not in position yet, consider a Buy Limit:
o Entry: 3333 – 3330
o SL: 3323
o TP1: 3343
o TP2: 3362
o TP3: 3381
👉 Note: If price breaks below 3324, I will update with new entry levels at lower support zones.

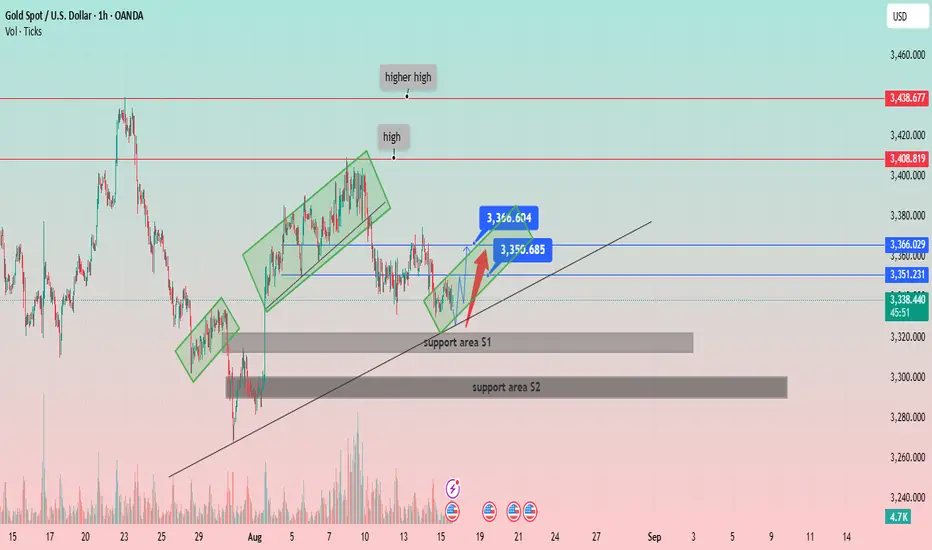
XAU/USD: Navigating the Uptrend and Key Support LevelsPrice Structure: Gold has been forming a series of higher highs and higher lows, indicative of a general uptrend. The chart labels a "high" and a "higher high," confirming this bullish structure.
Support and Resistance:
Two key support areas are identified:
Support area S1: A narrow zone around 3,320 USD. The price recently bounced off this area.
Support area S2: A broader, more significant zone around 3,290 USD, which appears to have been a strong support level in the past.
Several horizontal resistance levels are marked:
Immediate resistance: Around 3,351.231 USD and 3,366.029 USD.
Higher resistance: At 3,408.819 USD and 3,438.677 USD.
Channels and Trendlines:
The price has been moving within a series of ascending channels (highlighted in green rectangles), suggesting a stair-step upward movement.
A primary ascending trendline (black line) serves as a long-term support, with the price currently hovering just above it.
Recent Price Action and Projections:
The price recently broke out of a small downtrend and is showing signs of recovery from the "support area S1."
A potential price path is drawn with a red arrow, indicating a possible move towards the immediate resistance levels around 3,351 USD and 3,366 USD.
The chart highlights two specific price points, 3,360.604 USD and 3,350.685 USD, which likely represent a short-term trading range or target.
Volume: The volume spikes visible at key price points (e.g., at the low on July 30 and during the recent drop) indicate strong market activity.
Elliott Wave Analysis – XAUUSD – August 15, 2025
1. Momentum
• D1 Timeframe: Momentum is preparing to reverse and the two lines are converging. We need to wait for the daily candle close for confirmation. At this stage, buying pressure is weak, but sudden downward spikes to sweep liquidity are still possible.
• H4 Timeframe: Momentum is rising, suggesting a potential rebound today. If this rebound fails to break above Wave B’s high, another downward move is likely.
• H1 Timeframe: Momentum is turning down, so a short-term drop is possible. If price breaks below 3331 and approaches the lower targets, it will align with H4’s upward momentum, creating the basis for a more stable rally.
2. Wave Structure
• D1 Timeframe: The abcde triangle pattern may have completed. We now have a black 5-wave structure, with Wave 1 formed and price possibly in Wave 2. A break below 3270 would invalidate this 5-wave count.
• H4 Timeframe: The black 12345 5-wave structure appears complete. Price may now be forming a purple ABC correction, with Waves A and B done, and price currently in Wave C. Based on Fibonacci from W12345, Wave C has two potential targets:
o Target 1: 3322 (Fibo 0.618)
o Target 2: 3298 (Fibo 0.782)
• H1 Timeframe: Within Wave C, a black 5-wave structure seems to be developing, and price may now be in Wave 4. Wave 4 has two possible targets: 3343 and 3350, after which price could drop to complete Wave 5.
3. Key resistance zones where Wave 5 may end:
• Target 1: 3322
• Target 2: 3315
• Target 3: 3299
4. Trade Plan
• Scenario 1:
o Buy Zone: 3322 – 3320
o SL: 3312
o TP1: 3332
o TP2: 3357
o TP3: 3381
• Scenario 2:
o Buy Zone: 3300 – 3298
o SL: 3290
o TP1: 3314
o TP2: 3343
o TP3: 3381

3330 Liquidity Zone – A Fresh Bullish Structure is Emerging!The 3330 liquidity zone continues to prove its strength as gold rebounds sharply from this level, forming a clean new bullish structure on the M30 timeframe. Buyers are now pushing price to trade around 334x, and if this momentum holds, the next upside targets lie at the FIB – CP Zones above 335x and 336x.
On the higher timeframe, the corrective wave is still in play, but short-term price action is opening opportunities for both BUY & SELL setups, provided we time our entries with precision.
Market Context & Key News
Today, the market will be watching the Trump–Putin meeting, which could trigger sharp geopolitical-driven moves.
This Friday also brings the usual liquidity sweep, adding to potential volatility.
That’s why MMFLOW recommends observing the trend closely to pick safe entry points and avoid getting caught in false breaks.
Trading Plan
1. SELL Zones
3355 – Prime OBS SELL ZONE, expecting strong reaction.
3362 – Higher resistance, aligned with the descending trendline. Note: Best to take entries here if reached during Asia or early London; late London/NY session tests are prone to false break traps.
2. BUY Zones
Watch 3334 – 3336 for early BUY entries on lower timeframes.
Safe stop-loss: below 3330.
If 3330 breaks → wait patiently for BUY opportunities around 331x.
Action Strategy
Prioritise early BUYs at 3334–3336 with confirmation signals.
SELL at 3355 or 3362 if clear rejection occurs.
Manage risk strictly – SL below 3330 for BUYs and above 3365 for SELLs.
💡 MMFLOW NOTE: This is gold – volatility can erupt at any moment. Control your emotions, wait for precise setups, and you’ll gain the edge.

Elliott Wave Analysis – XAUUSD August 14, 2025Elliott Wave Analysis – XAUUSD August 14, 2025
1. Momentum Analysis
• D1 timeframe: Momentum is showing signs of reversal. Although price may not reverse immediately when the two momentum lines converge, this is a clear signal that the current selling pressure is weakening.
• H4 timeframe: Momentum is declining and has only formed 2 H4 candles since the reversal began. It will likely take another 2–3 H4 candles to enter the oversold zone and potentially reverse upward.
• H1 timeframe: Momentum is also falling, suggesting a likely downward move during the Asian session.
________________________________________
2. Wave Structure
• On H1, price is moving in a choppy manner, indicating a corrective phase that has nearly reached its target.
• However, the D1 momentum preparing to reverse upward creates two possible scenarios:
Scenario 1: D1 momentum reverses upward and confirms → The uptrend could last for 4–5 days, conflicting with the current scenario of a corrective wave B. In this case, we would have an alternative scenario of an initial diagonal wave 1 as shown in the right-hand chart.
Scenario 2: D1 momentum enters the oversold zone and stays there → A strong drop would be needed to confirm that the current price action is wave B.
________________________________________
3. Two Potential Price Scenarios
1. WXY corrective pattern → Target for wave Y is around 3381.
2. Initial diagonal wave 1 → Wave 2 could decline toward 3345 before wave 3 rises again. This scenario currently aligns better with the D1 momentum signal.
________________________________________
Conclusion: At present, there is a conflict between momentum signals and wave structure. Further observation is required to determine a clearer trading plan, so no trade recommendation for today.

Elliott Wave Analysis – XAUUSD (August 13, 2025)
1. Momentum
• D1 Timeframe: Momentum is about to enter the oversold zone. By the end of today, it is likely to be fully in oversold territory. This stage often leads to strong price movement – either a sharp decline or a bullish reversal.
• H4 Timeframe: Momentum is preparing to turn upward. We need to wait for the current H4 candle to close for confirmation. If confirmed, a recovery move is likely to occur today.
• H1 Timeframe: Momentum is currently tightening and approaching the overbought zone – a typical sign of sideways price action. This explains why, despite the high probability of a recovery, H1 does not yet provide a good entry signal.
________________________________________
2. Wave Structure
• RSI shows a bullish divergence between price and the indicator – a pattern often seen in wave 3 or wave 5. This supports the view that wave 5 (black) has completed around the 3333 level.
• With a complete 5-wave structure, wave A (red) of the ABC (red) correction may already be in place.
• A recovery in wave B (red) is expected, which aligns with H4 momentum preparing to turn upward. Wave B typically forms a 3-wave corrective structure, where price moves in a choppy, overlapping manner rather than trending strongly.
• Wave B target zones:
1. 3371
2. 3381
These two levels are close to each other, so they can be treated as one combined zone. The plan is to take the first target as the base level while extending the SL to cover the second target. If price approaches these levels, it’s best to watch real-time price action before entering a trade.
• Alternative scenario: If wave 5 (black) is not yet complete, the 3323 zone remains a good Buy opportunity (as per the previous analysis).
________________________________________
3. Trading Plan
Sell Setup:
• Entry Zone: 3371 – 3373
• SL: 3385
• TP1: 3358
• TP2: 3331
• TP3: 3323
Buy Setup:
• Entry Zone: 3323 – 3321
• SL: 3313
• TP1: 3331
• TP2: 3357
• TP3: 3371
2. Wave Structure
• RSI shows a bullish divergence, often seen in wave 3 or 5, suggesting wave 5 (black) may have completed around 3333.
• Wave A (red) of the ABC cycle may be complete; wave B (red) is expected to recover in a 3-wave, choppy pattern.
• Wave B target zone: 3371–3381 (treated as one zone; monitor price action before entry).
• Alternative scenario: If wave 5 (black) is not yet complete, 3323 remains a potential Buy zone.

Elliott Wave Analysis – XAUUSD August 12, 2025
1. Momentum Analysis
• D1 Timeframe: Momentum is declining → the downtrend remains intact. It may take another 2–3 daily candles for price to reach the oversold zone and potentially reverse.
• H4 Timeframe: Momentum is rising → from now until the U.S. session, price may either retrace upwards or move sideways.
• H1 Timeframe: Momentum is preparing to turn down → a minor pullback could occur in the short term, so this move should be monitored.
________________________________________
2. Elliott Wave Structure
• The green wave structure in the form of an ending diagonal may have been completed. This could mean that Wave 5 or Wave C (black) has formed.
• Personally, I do not want to see the Green 5-Wave Structure end with an ending diagonal at this stage because:
o If this is an impulsive uptrend structure, we are only at Wave 1 of the larger degree.
o An ending diagonal in Wave 5 (black) indicates weak buying pressure, which is not ideal when price hasn’t broken the previous high to confirm a new trend → increasing the probability that this is a corrective wave.
• Looking at the current downward wave structure, I tentatively label it as five black waves 1-2-3-4-5. The current slight rebound is expected to be Wave 4, which could take the form of either a Flat or Triangle.
• Wave 4 targets:
1. 3358
2. 3364
• If price breaks 3381, the current 1-2-3-4-5 bearish count will be invalidated (Wave 4 would overlap Wave 1). In that case, the structure could turn into a corrective ABC or a new 5-wave advance.
• With a Wave 4 target at 3364, the projected Wave 5 target would be 3323.
________________________________________
3. Combining Momentum & Wave Structure
• D1 downtrend → supports the scenario of another drop, forming Wave 5.
• H4 rising + H1 declining → could indicate Wave 4 forming as a triangle, with the key signal being that the current drop does not break 3342.
o If 3342 breaks, Wave 5 may already be in play, targeting 3323.
• Since H4 momentum is still rising, there remains a chance that price breaks above 3381, which would require a full recount—possibly turning into an ABC correction or a 5-wave rally.
________________________________________
4. Trading Plan
• If Wave 4 forms as a triangle → the 3358 area is a good sell zone, or wait for a breakout below 3342.
• Limit Sell Order:
o Entry: 3364 – 3366
o SL: 3374
o TP1: 3342
o TP2: 3333
o TP3: 3323

Elliott Wave Analysis – XAUUSD August 10, 2025
1. Momentum Analysis
• D1 Timeframe: Daily momentum lines are still overlapping without a confirmed reversal signal. This suggests that a potential reversal could occur within the next 1–2 days.
• H4 Timeframe: Momentum is currently rising, indicating that prices may continue to climb during the Asian session tomorrow.
• H1 Timeframe: Momentum is also rising, further supporting the expectation of continued upside movement in the Asian session.
________________________________________
2. Wave Structure Analysis
• Current price action is overlapping, reinforcing the hypothesis that an ending diagonal is forming.
• This structure could either be part of Wave 5 (black) or Wave C (black). In both cases, it represents an ending diagonal 12345, with the market currently in Wave 4 (blue).
• Confirmation signal: A sharp and steep decline will confirm the ending diagonal — as mentioned in previous plans, this has not yet occurred.
• The projected completion targets are at 3412 or 3419. If the price breaks 3439, it will likely confirm the completion of Wave 5 (black).
________________________________________
3. Possible Scenarios
• Scenario 1: If the current move is part of a 5-wave 12345 black structure, once Wave 5 completes, a corrective ABC 3-wave decline could follow, targeting 3333.
• Scenario 2: If the current move is part of a 3-wave ABC black structure, once Wave C completes, a 5-wave bearish sequence could unfold, breaking below 3315.
________________________________________
4. Combining Momentum & Wave Structure
Given that:
• D1 is in the overbought zone and could reverse within 1–2 days,
• H4 momentum is rising, and
• Price is likely in Wave 4 (blue),
→ On Monday, we may see one more upward push to complete Wave 5 (blue). This presents a potential SELL opportunity in the 3412–3419 target area.
Since this is a wide zone, it’s best to wait for clear reversal signals before entering.
________________________________________
5. Trade Plan
SELL ZONE 1: 3411 – 3413
• SL: 3416
• TP1: 3400
• TP2: 3381
• TP3: 3342
SELL ZONE 2: 3419 – 3421
• SL: 3429
• TP1: 3400
• TP2: 3381
• TP3: 3342

Elliott Wave Analysis – XAUUSD August 8, 2025📊
🔍 Momentum
• D1 Timeframe: Daily momentum is currently turning down, limiting the potential for a long-term rally in the current bullish wave. This also suggests that the top may already have formed around the 3,409 level.
• H4 Timeframe: Momentum is still declining and needs about one more H4 candle to reverse upward. For now, the downward move is likely to continue, so caution is advised.
• H1 Timeframe: Showing early signs of a short-term bearish reversal. This decline is important and will be analyzed further after the wave structure review.
🌀 Wave Structure
The current price action suggests a potential Ending Diagonal formation. Once completed, this pattern is typically followed by a sharp and sudden drop.
So far, no sharp decline has occurred, meaning the ending diagonal may not be finished yet. The ideal completion zones for Wave 5 are around 3412 or 3419.
Ending diagonals tend to develop in a complex manner, so a safer approach is to enter trades after price breaks below the lower boundary of the diagonal.
👉 Additional Scenario: If H1 momentum reverses downward and price breaks below 3381, it is likely to drop toward 3371. This area could be considered for a Buy setup.
Conversely, if price does not break below 3381 and instead rises toward 3412, it may indicate that Wave 5 is completing at that level.
📈 Trading Plan
• SELL Zone 1: 3412 – 3414
o SL: 3417
o TP1: 3393
o TP2: 3372
• SELL Zone 2: 3419 – 3421
o SL: 3429
o TP1: 3395
o TP2: 3372

Elliott Wave Analysis – XAUUSD | August 7, 2025📊
________________________________________
🔍 Momentum Analysis:
• D1 Timeframe: Daily momentum is turning bearish, signaling that a medium-term downtrend may have already started and could last until mid-next week.
• H4 Timeframe: Momentum is rising, but the slope of the two momentum lines is relatively flat → indicating weak bullish strength. We should closely watch the overhead resistance zones.
• H1 Timeframe: Momentum has entered the overbought zone → a short-term reversal is likely, especially near the 3386 level.
________________________________________
🌀 Elliott Wave Structure:
• Based on the bearish momentum shift on the D1 chart, we expect the market is entering an ABC corrective pattern (in green).
• Currently:
o Wave A is completed.
o Wave B is in progress.
• Since Wave A appears to be a 3-wave structure, Wave B may unfold as a flat correction. In that case, potential target zones for Wave B are:
o 3385
o or 3395 → these are the key resistance levels to monitor.
• Within Wave B (green), we observe an internal 3-wave ABC structure (in red), where:
o Wave C (red) may reach:
3386
or extend toward 3395
→ In alignment with the D1 momentum signal, 3386 is considered a potential entry point for a short position.
________________________________________
📈 Trade Plan:
• SELL Zone: 3386 – 3389
• Stop Loss: 3397
• Take Profits:
o TP1: 3370
o TP2: 3353
o TP3: 3333

Elliott Wave Analysis – XAUUSD August 6, 2025📊
________________________________________
🔍 Momentum Analysis
• D1 Timeframe:
Daily momentum is showing signs of a potential bearish reversal. However, we need to wait for today’s candle to close to confirm the signal. While waiting for confirmation, price may still experience a minor upward move on lower timeframes, but the current bullish momentum is weak and unlikely to extend far.
• H4 Timeframe:
Momentum is also preparing to reverse. We need to observe the current H4 candle for confirmation. Notably, the reversal signal is forming just below the overbought zone, suggesting there may be one more upward push before a potential decline.
• H1 Timeframe:
Momentum is approaching the oversold zone. It may take 1–2 more bearish candles before a short-term bullish rebound occurs.
________________________________________
🌀 Elliott Wave Structure Update
Yesterday’s bullish move was disappointing — instead of pushing directly to the 3402 or 3419 target zones to complete Wave 5, price only broke slightly above 3385 before reversing. This behavior complicates wave analysis by introducing conflicting possibilities.
We currently consider two main scenarios:
Scenario 1: Wave 5 is not yet complete
• Given that D1 momentum is preparing to reverse downward, it’s unlikely that the current move is Wave 1 of Wave 5. A more likely scenario is that Wave 3 of Wave 5 has completed and price is currently in Wave 4.
• The current corrective structure has stopped at the 0.382 Fibonacci level. As long as price remains above 3370 (the 0.5 Fib level), this strengthens the case for a Wave 4 retracement before another leg up in Wave 5.
• Since bullish strength appears limited, we now focus on two main target zones for Wave 5: 3395 and 3402, instead of the previous high at 3419.
Scenario 2: Full 5-wave structure is complete – now in correction
• If the 5-wave pattern has already finished, the current decline marks the beginning of a corrective phase.
• With current momentum conditions, this is still a viable scenario. However, due to the remaining upside possibility, we recommend waiting for today’s D1 candle to confirm momentum before taking any trade.
________________________________________
📌 Trade Plan
For experienced traders:
• Wait for price to reach the 3395–3402 zones.
• Look for reversal signals in those areas to enter short positions.
Suggested trade plan for newer traders:
• Sell Zone: 3395 – 3398
• Stop Loss: 3408
• Take Profits:
o TP1: 3385
o TP2: 3370
o TP3: 3349
________________________________________
✅ Note:
This trade plan should be reassessed after today’s D1 candle closes for confirmation of the momentum shift.

Elliott Wave Analysis – XAUUSD, August 5, 2025📊
________________________________________
🔍 Momentum Analysis:
• D1 Timeframe:
Momentum has entered the overbought zone. As anticipated in previous plans, we've seen four consecutive bullish days, and the current overbought condition signals that bullish momentum is weakening.
• H4 Timeframe:
Momentum is reversing downward → We expect a potential pullback today, at least until the US session.
• H1 Timeframe:
Momentum is also turning down → This supports the possibility of a short-term pullback on the H1 chart.
________________________________________
🌀 Wave Structure Analysis:
Currently, there are two key scenarios to consider:
✅ Scenario 1 – ABC Correction Structure (black labels):
• If this is a C wave completing an ABC correction, the current bullish move is likely over.
• In this case, price may break below the 3315 support zone, resuming the medium-term bearish trend.
✅ Scenario 2 – Impulse Wave 12345 (black labels):
• If this is wave 5 of a 5-wave impulse, the uptrend may not be complete yet.
• Currently, wave 5 has reached its first target at 3385, however, we must still watch for an extended target around 3402.
• Notably, wave 4 took the form of a triangle. According to Elliott Wave theory, when wave 4 is a triangle, wave 5 typically travels a distance equal to the triangle’s maximum height → This makes 3385 a highly probable peak area.
________________________________________
🧭 Trade Plan (Reference Only):
🔹 Sell Setup #1 – Near Potential Wave 5 Top:
• Sell Zone: 3375 – 3378
• Stop Loss: 3387
• TP1: 3365
• TP2: 3344
• TP3: 3333
🔹 Sell Setup #2 – In Case of Extended Wave 5:
• Sell Zone: 3400 – 3402
• Stop Loss: 3410
• TP1: 3385
• TP2: 3368
• TP3: 3333

Elliott Wave Analysis – XAUUSD, August 3, 2025📊
🔍 Momentum Analysis:
D1 Timeframe: Momentum continues to rise strongly. It's expected that the price will keep rising for at least two more trading days, pushing the momentum indicator into the overbought territory, reinforcing the current bullish trend.
H4 Timeframe: Momentum is showing signs of a potential bearish reversal, indicating a possible corrective pullback during Monday’s trading session.
H1 Timeframe: Momentum is strongly bullish, especially evident from the powerful upward move on Friday. Price may continue rising at the open of the Asian session, potentially creating a Gap. However, caution is advised, as this Gap could signal exhaustion.
📌 Wave Pattern Analysis:
Given Friday's strong price action, the primary scenario currently favors wave 3 within the 5-wave bullish structure (12345 – black). However, we cannot entirely eliminate the possibility that this is wave C within an ABC corrective structure (black).
Presently, the price is forming a smaller 5-wave bullish structure (blue), likely in the final wave 5. Attention should be paid to two critical target zones:
🎯 Blue Wave 5 Targets:
• Target 1: 3368
• Target 2: 3385
⚠️ Next Scenario:
Upon completing the blue 5-wave structure, a corrective move downward will occur.
• If the correction does not break below 3315, the larger 5-wave bullish structure (12345 – black) is confirmed, and the price will continue upward to complete black wave 5.
• If the correction breaks below 3315, the structure shifts to an ABC corrective pattern (black), increasing the likelihood of a deeper decline to complete the larger corrective wave C (red).
🧩 Combining Momentum & Wave Analysis:
• D1 momentum strongly supports the continuation of the bullish trend.
• H4 momentum forecasts a short-term bearish correction on Monday, aligning with the formation of wave 4 correction.
• H1 momentum suggests the possibility of a Gap at Monday's Asian session open, marking the beginning of a corrective pullback as momentum reverses.
🎯 Short-term Trading Plan:
We will trade the current blue wave 5 with the following limit order plan:
✅ Sell Limit Zone: 3385 – 3387
⛔️ Stop Loss (SL): 3399
🎯 Take Profit (TP1): 3368
🎯 Take Profit (TP2): 3355
📌 Note:
The detailed trading plan for capturing the larger wave 4 correction (black) will be updated once sufficient evidence confirms the completion of the blue wave 5.
Happy trading, everyone! 🚀

Elliott Wave Analysis – XAUUSD August 1, 2025📊
________________________________________
🔍 Momentum Analysis:
• D1 Timeframe:
Momentum has reversed to the upside. Based on this signal, we expect a bullish trend to continue for the next 5 daily candles — likely until mid-next week.
• H4 Timeframe:
Momentum has also turned upward → This suggests that from now until the U.S. session, the price will likely continue to rise or consolidate with an upward bias.
• H1 Timeframe:
Momentum is currently turning down → We anticipate a short-term corrective move. We should wait for H1 to enter the oversold zone and give a bullish reversal signal before looking for long entries.
________________________________________
🌀 Wave Structure Analysis:
The current wave structure remains complex and lacks clear confirmation. Thus, the current wave labeling should be considered provisional. However, the wave count has not been invalidated, and D1 momentum supports a bullish outlook — so we continue to maintain our wave structure bias.
Important Note:
Wave (C) in red appears relatively short. This leaves open the possibility that the price may continue lower, targeting:
• ⚠️ 3246
• ⚠️ 3200
→ This scenario will be triggered if price breaks below 3268, especially given today's Nonfarm Payroll (NFP) report.
________________________________________
📌 Two Possible Wave Scenarios:
1. Scenario 1: Black Waves 1 – 2 – 3
o Wave 1 (black) is complete.
o We are now in Wave 2 (black) → Preparing for Wave 3.
o Wave 3 tends to be strong, impulsive, and sharp with large candle bodies.
o Target: 3351
2. Scenario 2: Black ABC Correction
o The market is currently in Wave B (black).
o Potential target for Wave C: 3328
________________________________________
🛡 Support Zones & Trade Strategy:
• Support Zone 1: 3290 → A good area for potential buying, but we must wait for H1 to enter the oversold region and show a bullish reversal.
• Support Zone 2: 3275 → Deeper buy zone if the price corrects further.
________________________________________
💡 Trade Plan:
📍 Option 1 – Buy Limit:
• Buy Zone: 3290 – 3289
• Stop Loss: 3280
• Take Profit 1: 3309
• Take Profit 2: 3328
• Take Profit 3: 3351
📍 Option 2 – Buy Limit:
• Buy Zone: 3275 – 3273
• Stop Loss: 3265
• Take Profit 1: 3309
• Take Profit 2: 3328
• Take Profit 3: 3351
________________________________________
📎 Notes:
• Experienced traders should wait for clear confirmation signals on H1 before entering trades.
• New traders may consider using limit orders in the proposed buy zones.

Elliott Wave Analysis – XAUUSD | July 30, 2025📊
🔍 Momentum Analysis
• D1 Timeframe: Momentum has started to reverse upward, but we need to wait for today’s daily candle to close for confirmation. Until then, there is still a risk of another short-term decline.
• H4 Timeframe: Momentum lines are clustering in the overbought zone, signaling a possible weakening of the current upward move. However, this signal alone is not enough to confirm that the uptrend has ended.
________________________________________
🌀 Wave Structure
• Price has reached the projected target for wave e, but there has been no strong bullish reaction. The recent candles are short-bodied and overlapping – typical of corrective structures. Also, this wave has lasted longer than previous corrective upswings, suggesting that the decline may not be over yet and the wave count needs to be reviewed.
Currently, we are facing two equally probable scenarios (50/50), but they suggest opposite outcomes:
➤ Scenario 1: Zigzag (5-3-5) Structure
• The current structure may represent only wave A of a larger zigzag.
• We are now in wave B, which tends to be complex and unpredictable, making it not ideal for wave-based trading.
• The red zones marked on the chart indicate potential target areas for wave B.
➤ Scenario 2: Completed 5-Wave Correction
• The downtrend may have completed at wave (e).
• The current upward movement could be wave 1 forming as a triangle – a potential start of a new bullish cycle.
• However, to confirm this scenario, price must hold above 3309. If it fails to do so and H4 momentum reverses downward, a new low is very likely.
________________________________________
📝 Trading Plan
Given the current market conditions, I only recommend short-term scalp trading based on the predefined support and resistance zones.
Avoid wave-based trading until the structure becomes clearer. Once clarity returns, I will provide an updated trading plan.

Elliott Wave Analysis – XAUUSD – July 28, 2025📊
________________________________________
🔍 Momentum Analysis:
• D1 Timeframe: Momentum has entered the oversold zone. This strongly suggests a potential bullish reversal today, which could lead to a rally or sideways movement lasting around 4–5 days.
• H4 Timeframe: Momentum is reversing upward. This indicates a likely bullish or sideways move in the short term, at least until momentum reaches the overbought zone (estimated within the next 2 H4 candles).
• H1 Timeframe: Momentum is currently overbought, so we may first see a pullback or sideways movement until a clearer reversal signal appears.
________________________________________
🌀 Wave Structure Analysis:
• On the H4 chart, as noted in previous plans, the assumption that price is forming a contracting triangle (abcde) is still valid. Price is currently in the final leg (wave e) of this triangle.
• On the H1 chart, we can observe a channel structure, within which an abc corrective pattern is unfolding.
• The lower boundary of the triangle (marked by the green trendline) combined with support zones will be critical areas to monitor for the end of wave e.
🔺 Note: Wave e does not necessarily end precisely at the triangle boundary – it can slightly overshoot. Hence, we’ll rely on smaller wave structures to identify potential reversal zones.
________________________________________
🎯 Key Price Zones to Watch:
• Target 1: 3329
• Target 2: 3309
• Target 3: 3290
________________________________________
🔎 Lower Timeframe Structure (M10):
From the current price action (as shown in the chart), we can see a leading diagonal triangle structure forming. This is a pattern commonly seen in wave 1. If this pattern is confirmed, a sharp and steep decline toward the 3329 zone is likely.
________________________________________
⚖️ Combining Momentum & Wave Structure:
• D1: Signals a potential reversal → favors Buy setups.
• H4: Momentum is rising, but price hasn’t confirmed a new bullish trend → need to stay alert and tighten Stop Loss.
• H1: Overbought + possible leading diagonal → Expecting a pullback for wave 2 toward 3329 → this would be the optimal Buy zone.
________________________________________
🧭 Trade Plan:
• For experienced traders:
→ Wait for price to reach key levels and watch for reversal signals before entering.
• For beginners:
→ Use the following Limit Buy setup:
✅ Setup 1:
• Buy zone: 3330 – 3328
• Stop Loss: 3320
• TP1: 3351
• TP2: 3370
• TP3: 3385
✅ Setup 2:
• Buy zone: 3310 – 3308
• Stop Loss: 3300
• TP1: 3328
• TP2: 3351
• TP3: 3370

Elliott Wave Analysis – XAUUSD July 25, 2025📊
________________________________________
🔍 Momentum Analysis
• D1 Timeframe: Momentum is declining. Based on the current pace, it’s likely that only 1–2 more daily candles are needed before momentum enters the oversold zone → suggesting one more potential downward leg.
• H4 Timeframe: Momentum is about to turn bearish, indicating we might see a sideways movement or a slight drop in the short term.
• H1 Timeframe: Momentum is currently falling. By the end of the current H1 candle, momentum will likely enter the oversold zone → potential for a bullish reversal soon.
________________________________________
🌀 Elliott Wave Structure
• A clear 5-wave Wave A has already formed with no irregular patterns, so I’m expecting Wave B (black) to unfold as a 3-wave structure.
• Within this black Wave B, price is now developing Wave B (blue), meaning Wave A (blue) has already completed. Looking at the lower timeframe, I can identify a 5-wave structure → suggesting a zigzag correction in the form of 5-3-5 for black Wave B.
• Target for Wave B (blue): The 3360 area – this is a support level and also aligns with Fibonacci confluence, making it a strong candidate for the end of Wave B (blue) and a potential reversal zone.
• If price respects the 3360 level, then projected targets for Wave C (blue) would be around 3386 or 3402.
• However, if price breaks below 3351, the current wave count becomes invalid. In that case, we will shift to an alternate scenario and look for a buy opportunity near the lower edge of the triangle (c)-(e) and other confluence support zones.
________________________________________
🔄 Combining Momentum & Wave Structure
• D1 momentum shows weakening in this downward move, and the lower boundary of the triangle (c)-(e) is a prime area to look for the end of Wave e.
• Ideally, we want to see:
o A short-term bounce upward aligning with H1 momentum reversal to complete Wave C (blue).
o Then a confluence with H4 momentum turning bearish, indicating possible trend continuation or reversal.
________________________________________
📌 Trade Plan
• For experienced traders:
Watch closely around 3385 and 3401 for reversal signals to enter Sell positions.
• For beginners, I recommend the following limit setup:
o SELL ZONE: 3399 – 3402
o SL: 3501
o TP1: 3374
o TP2: 3351

Elliott Wave Analysis – XAUUSD July 24, 2025📊
________________________________________
🔍 Momentum Analysis:
• D1 Timeframe: Momentum is currently in a downtrend, indicating that the dominant trend in the short term (at least until early next week) is likely to remain bearish or sideways.
• H4 Timeframe: Momentum has entered the oversold zone and is showing signs of a potential bullish reversal. This suggests that a corrective upward move may occur today.
• H1 Timeframe: Momentum is still declining and is expected to need around two more H1 candles before entering the oversold zone, implying that one more leg down may occur before a recovery begins.
________________________________________
🌀 Elliott Wave Structure Update:
Yesterday’s expectation of a breakout above the resistance zone at 3453 to confirm the start of a new bullish trend did not materialize. Instead, price dropped to the 3374 region, opening up two primary scenarios:
✅ Scenario 1: The correction is still unfolding
• Wave (d) in blue appears to be complete.
• The current leg is likely wave (e), the final leg in a contracting triangle correction.
• In this case, the lower boundary of the triangle and overlapping support zones will serve as key levels to watch for the completion of wave (e).
✅ Scenario 2: Wave 1 of a new bullish trend has completed
• The current decline is wave 2 in a new bullish impulsive sequence.
• The objective here is to identify the bottom of wave 2 to prepare for a potential buy entry into wave 3, which is expected to be stronger and longer than wave 1.
📌 Key difference between the two scenarios:
• Scenario 1 → Wave (e) completes, followed by wave 1 of wave 5.
• Scenario 2 → Wave 2 completes, followed by a powerful wave 3 of wave 5.
________________________________________
🧩 Current Wave Structure:
• A five-wave bearish structure is currently unfolding on the chart.
• According to Elliott Wave Theory, corrective patterns do not typically form five-wave structures.
• Therefore, this is likely wave A in a zigzag (5-3-5) formation.
• Possible targets for wave 5 within wave A:
o Target 1: 3374 – current reaction zone.
o Target 2: 3360 – next significant support level.
________________________________________
📌 Combining Wave Structure with Momentum:
The D1 momentum is firmly bearish, reinforcing the view that the market is undergoing a larger ABC correction.
On the H4 timeframe, momentum is oversold and showing early signs of reversal, aligning with the potential formation of wave B — typically a weak, sideways upward move. The likely resistance zone for the end of wave B lies between 3401 and 3410.
Meanwhile, H1 momentum is still falling and not yet in the oversold zone, suggesting there may be one more move down to complete wave 5. The ideal target for this final leg is around 3360.
Summary:
• D1 bearish → confirms ongoing major correction.
• H4 oversold → supports a potential weak wave B.
• H1 still declining → wave 5 may complete around 3360 before a recovery begins.
________________________________________
💼 Suggested Trading Plan:
For traders with limited experience or those not yet confident in reading live market signals, a Buy Limit strategy at clear support levels is recommended:
• Buy Zone: 3362 – 3360
• Stop Loss: 3352
• Take Profit:
o TP1: 3384
o TP2: 3400
🎯 For experienced traders, it is advised to observe price action at the target support zones and look for real-time reversal signals to optimize entry timing.

Elliott Wave Analysis – XAUUSD July 23, 2025
________________________________________
🔍 Momentum Analysis:
• D1 Timeframe: Daily momentum is showing signs of a potential bearish reversal. We need to wait for today’s daily candle to close to confirm this. It signals that the bullish momentum is weakening.
• H4 Timeframe: Momentum is turning down. It may take around 2 more bearish H4 candles to push momentum into the oversold zone → suggesting continued downside movement today.
• H1 Timeframe: Momentum is already in the oversold zone and the indicators are “clinging” together → implying possible continued minor declines or sideways movement.
________________________________________
🌀 Elliott Wave Structure Update:
• On the H1 chart, a 5-wave structure (yellow) is unfolding.
o Wave 3 (yellow) appears completed, supported by a clear 5-wave internal structure in blue.
o The market is currently in Wave 4 (yellow) – a corrective move.
🔸 Potential Wave 4 (yellow) targets:
• Target zone 1: Around 3412
• Target zone 2: Around 3402
📌 Once Wave 4 (yellow) completes, we anticipate the market will form Wave 5 (yellow).
🔸 Projected Wave 5 (yellow) targets:
• TP1: 3461
• TP2: 3492 (in case of an extension)
________________________________________
🔄 Combining Momentum & Wave Structure:
• The potential bearish reversal in D1 momentum suggests the current bullish trend may be nearing its end – consistent with Wave 5 being the final push before a broader correction.
• H4 and H1 momentum support the ongoing correction in Wave 4.
✅ Wave 4 typically takes the form of a zigzag, flat, or triangle → Wait for a strong bullish H1 candle to confirm the end of Wave 4 and initiate a buy entry.
________________________________________
📊 Trade Plan:
🟩 Buy Zone 1:
• BUY ZONE: 3414 – 3412
• SL: 3407
• TP1: 3439
• TP2: 3461
• TP3: 3492
🟩 Buy Zone 2:
• BUY ZONE: 3403 – 3401
• SL: 3393
• TP1: 3439
• TP2: 3461
• TP3: 3492

Elliott Wave Analysis – XAUUSD | July 22, 2025
🔍 Momentum Overview
• D1 timeframe: Momentum has entered the overbought zone, signaling a potential reversal within the next 1–2 sessions. That said, the current bullish leg may still extend — it’s important to wait for tomorrow’s D1 candle close for confirmation. Entering overbought territory is a warning that upside momentum is weakening.
• H4 timeframe: Momentum is currently declining. Unless a strong bullish candle closes above 3391 to trigger a reversal, the price is likely to continue moving sideways or downward today.
• H1 timeframe: There are signs of a bullish reversal. If the price holds above 3385 and posts a strong breakout candle above 3391, it could present a short-term buying opportunity.
🌀 Elliott Wave Structure Update
• Price is consolidating within the 3390 – 3402 range — a key zone to monitor closely.
• The 3380 level is a critical threshold, aligned with the 0.382 Fibonacci retracement of Wave (3). A daily close below this level would raise the possibility that the move is part of a correction rather than Wave 4.
• A flat ABC correction is currently unfolding, with the 1.618 extension of Wave A already reached at 3385.
• If price breaks below 3360, it would overlap with the previous Wave 1, invalidating the current impulsive wave count. In that case, we should consider the potential continuation of a larger abcde triangle correction.
🔗 Momentum & Wave Structure Combined
• H1 is showing early signs of a bullish reversal, but H4 momentum remains bearish. Without a strong breakout candle above 3391, price is likely to drift sideways or lower until H4 reaches the oversold zone.
• Conservative approach: Wait for H4 to enter oversold territory before considering any long positions.
• The ideal buy setup would be a bullish reaction from the 3382 – 3380 zone.
📈 Trade Setup
• Buy Zone: 3382 – 3380
• Stop Loss: 3372
• Take Profit 1: 3402
• Take Profit 2: 3412
• Take Profit 3: 3428

Elliott Wave Analysis – XAUUSD | July 21, 2025🔍 Momentum Analysis
- D1 Timeframe: Momentum is currently rising → the dominant trend over the next 3 days is likely to remain bullish.
- H4 Timeframe: Momentum is approaching the oversold area → just one more bearish H4 candle could complete the entry into oversold territory.
- H1 Timeframe: Momentum is about to reverse downward → suggesting a short-term corrective pullback in the current session.
🌀 Elliott Wave Structure Update
On the H4 chart, price continues to consolidate within a corrective triangle structure. According to our previous plan, price approached the 3358 zone, and we expect:
- Wave 1 (black) may have completed at the 3358 high.
- Currently, Wave 2 (black) is likely unfolding:
+ Wave A appears to have completed.
+ The current upward leg is part of Wave B.
+ A final drop in Wave C is expected, with two key target zones:
- Target 1: 3342
- Target 2: 3332
🔎 Combining Momentum & Wave Structure
- If price breaks above 3358, we want to see a sharp, impulsive, and steep rally to confirm the beginning of Wave 3.
- If price movement remains choppy or overlapping, the market is likely still in a corrective phase.
- Key resistance zone to monitor: 3390–3402 – a clean breakout above this range would significantly strengthen the Wave 3 scenario.
📌 Trade Plan
1️⃣ BUY Setup #1
Entry Zone: 3343 – 3341
Stop Loss: 3337
Take Profit 1: 3358
Take Profit 2: 3390
2️⃣ BUY Setup #2
Entry Zone: 3333 – 3331
Stop Loss: 3323
Take Profit 1: 3358
Take Profit 2: 3390
📎 Note: Prioritize entries that come with clear confirmation signals from price action and momentum. Avoid buying during choppy or indecisive market conditions.

Elliott Wave Analysis – XAUUSD July 17, 2025
🔍 Momentum Analysis
D1 timeframe: Momentum is still trending downward, but we’re starting to see signs of convergence between the indicator lines. Normally, we would expect another two daily candles to reach the oversold zone and trigger a potential reversal. However, with the current narrowing pattern, we cannot rule out the possibility of an earlier reversal. Today’s daily close will be crucial for confirmation.
H4 timeframe: Momentum is clearly declining, suggesting that the market may either continue downwards or consolidate sideways throughout the day.
🌀 Elliott Wave Structure
On the H4 chart, price action is compressing tightly at the end of a symmetrical triangle pattern – a classic setup in Elliott Wave theory. Notably, this final point of compression coincides with the POC (Point of Control), indicating a key price level where high volume has accumulated.
Wave W (in black) follows a 3-wave structure. Yesterday, price surged to the beginning of wave W and then sharply reversed, forming the basis for two potential scenarios:
Scenario 1 – WXY structure with current price completing wave Y within wave e (green):
+ Target 1: 3327
+ Target 2: 3303
Scenario 2 – Wave e (green) evolves into a triangle:
+ In this case, price may consolidate sideways above the 3327 zone.
🔗 Combining Wave and Momentum Analysis
Both D1 and H4 momentum indicators are still pointing downward. However, the price candles appear overlapping and lack clear directional strength – a common trait of compression near the triangle’s apex. With price sitting right on the POC, there’s a high chance of continued tightening before a breakout. At this stage, the recommended strategy is to wait for a strong bullish candle at one of the target zones before entering a BUY position.
📈 Trade Setup
✅ Scenario 1 – BUY at 3327 – 3326
+ Stop Loss: 3317
+ Take Profit 1: 3342
+ Take Profit 2: 3358
+ Take Profit 3: 3402
✅ Scenario 2 – BUY at 3305 – 3302
+ Stop Loss: 3295
+ Take Profit 1: 3327
+ Take Profit 2: 3358
+ Take Profit 3: 3402
