Policy instability, DXY falls sharply, gold recoversPlan XAU day: 01 July 2025
Related Information:!!!
Gold Demand in China Expected to Rise Further
"In the first quarter of the year, China recorded a net export of 36 tons of gold to Hong Kong, reflecting a growing domestic demand for gold despite elevated prices. The uncertainty surrounding U.S. tariff policy has likely been a significant contributing factor. As a result, gold has seen increased appeal among Chinese investors as both an investment asset and a safe-haven store of value. In contrast, demand for gold jewellery likely remained subdued due to persistently high prices."
"China aims to expand its exploitable gold reserves by 5 to 10 percent by 2027, potentially in response to rising domestic demand, according to a statement from the Ministry of Industry and Information Technology released early last week. The country also plans to boost gold production by more than 5 percent over the next two years. While China is already the world’s largest gold producer, it continues to rely on imports to satisfy internal demand.
personal opinion:!!!
Trump administration's policy instability caused the dollar to lose value and gold to fall sharply. Gold is on the way to recovery, returning to the price range of 3366.
Important price zone to consider : !!!
SELL point: 3366 zone
Sustainable trading to beat the market
Xauusdlong

Double Top Breakdown at Resistance ZoneThe chart reveals a classic Double Top pattern formation near the 3,360–3,480 resistance zone, followed by a clear bearish rejection (highlighted with red arrows). This confirms the presence of strong supply pressure in that region.
🔍 Key Technical Highlights:
🔺 Double Top Pattern
The price formed two swing highs near the resistance zone, failing to break above.
After the second peak, the price started declining, confirming the reversal pattern.
📉 Bearish Channel
The recent downtrend is contained within a descending channel, with consistent lower highs and lower lows.
Price broke below the neckline of the double top pattern around 3,270.
🎯 Target Projection
Based on the height of the double top pattern, the projected downside target is near 3,207.5, aligning perfectly with the support zone marked below.
🟠 Historical Support Areas
The large orange circles indicate key reaction points, confirming that the 3,207–3,220 area has acted as support in the past.
📊 Outlook:
If the current bearish momentum continues, price is likely to head towards the support target zone at 3,207.5. Any pullback toward 3,320–3,350 could provide a shorting opportunity with stops above the recent highs.
🔧 Bias: Bearish
📍 Resistance: 3,360–3,480
📍 Support: 3,207–3,220
📍 Target: 3,207.5

XAUUSD! LongHey traders! I'm currently looking for a bullish setup. The market structure is still showing strong bullish signs, so I'm not looking to short at this point. I'm targeting a 1:2 risk-to-reward trade—let's see how it plays out! Staying patient and letting the setup come to me. Let’s go!

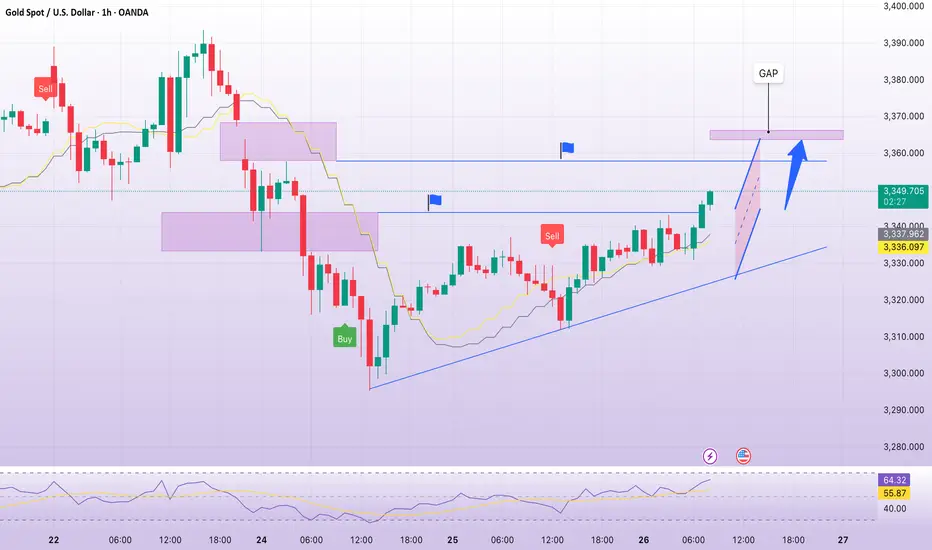
Bears up 3366 , waiting for GDP ! XAUUSDPlan XAU day: 26 June 2025
Related Information:!!!
Gold price (XAU/USD) attracts some buyers for the second consecutive day on Thursday and maintains its positive momentum during the first half of the European session. The US Dollar (USD) continues to face strong selling pressure amid reports that US President Donald Trump is considering replacing Federal Reserve (Fed) Chair Jerome Powell, raising concerns about the central bank’s future independence. Additionally, growing expectations that the Fed may resume its rate-cutting cycle as early as July have pushed the USD to a more than three-year low, which supports demand for the non-yielding yellow metal.
personal opinion:!!!
European session buying pressure helped gold price successfully break 3340, continuing the upward trend 3366
Important price zone to consider : !!!
SELL point: 3367 zone
Sustainable trading to beat the market
Gold price short growth: price zone 3345Plan XAU day: 25 June 2025
Related Information:!!!
US President Donald Trump criticized both Israel and Iran for violating a full ceasefire agreement shortly after it was announced. Moreover, media reports indicated that the recent US airstrikes on Iran’s nuclear facilities likely did not destroy the core components but only delayed Tehran’s program by a few months. Trump, however, reiterated that Iran’s nuclear sites were completely destroyed.
Nonetheless, the ceasefire between Israel and Iran appears to be holding for now, with both sides declaring victory in the conflict and warning that they are prepared to resume hostilities if attacked. This keeps the geopolitical risk premium in play and is likely to continue supporting the safe-haven appeal of Gold ahead of key US macroeconomic data releases later in the week.
personal opinion:!!!
Accumulation price zone: 3300 - 3335 is being maintained in the Asian and European sessions. Pay attention to selling pressure in the liquidity zone 3345.
Important price zone to consider : !!!
SELL point: 3345; 3367 zone
Sustainable trading to beat the market

tXAU/USD Bullish Reversal from Key SupportXAU/USD Bullish Reversal from Key Suppor 📈🟢
📊 Chart Analysis:
Rounded Bottom Structure ⬆️
The price has formed a rounded bottom pattern, indicating potential trend reversal from bearish to bullish.
Multiple bounces (🟠 circles) from the curved support trendline confirm the validity of this structure.
Support Zone Rejection ✅
Price recently rejected from a major horizontal support zone (around 3,303.796 USD) with a strong bullish wick.
This zone has acted as a springboard for prior upward moves.
Falling Wedge Breakout 💥
A falling wedge (bullish pattern) has formed and is breaking to the upside.
Breakout confirmation is underway, indicating momentum shift.
Target Projection 🎯
The projected move from the breakout suggests a potential target at 3,385.820 USD.
This aligns with previous resistance areas.
Key Levels to Watch:
Resistance: 3,385.820 USD (target) and 3,425–3,450 USD (major resistance zone)
Support: 3,303.796 USD (short-term), followed by 3,225–3,250 USD zone
🔔 Conclusion:
Price action suggests a bullish bias with a possible upward continuation if it sustains above the wedge breakout.
Confirmation above 3,330 USD with volume can fuel a rally toward the 3,385–3,400 USD target zone.
📌 Risk Management Tip: Watch for fakeouts near wedge resistance or a re-test of 3,303 USD for better entries.

Gold Eyes Breakout from Ascending Channel Toward $3,500📈 Chart Analysis
1. Rising Channel Structure
Gold (XAU/USD) has been trading within an upward-sloping channel, marked by the blue trendlines connecting interior lows and highs, culminating at point C (~$3,497). The latest bounce off the lower channel near “B” reinforces bullish bias – if this trendline holds, another leg higher toward resistance around $3,497–$3,500 is likely.
2. Support & Resistance Confluence
The purple trendline and the dotted horizontal green level (~$3,498) converge near the projected breakout point. This synergy provides a strong pivot zone — a successful breakout would validate targets near channel highs.
3. Harmonic Pattern in Play
The chart displays a bullish harmonic structure (likely a Bat or Gartley formation), with retracement ratios (0.719, 1.627) anchoring reversal areas. These reinforce the bounce at B and the potential move toward point C.
4. Trade Scenarios
Bullish Scenario (primary): A bounce off the trendline triggers a rally to the channel top and resistance zone ($3,497–$3,500).
Bearish Caution: A drop below the trendline invalidates the pattern, potentially bringing prices back to horizontal support around $3,296 or even $3,120, as indicated at point A.
🛠️ Technical & Market Context
Technicals: Daily trend remains bullish as long as price holds above ~$3,340–$3,350, with resistance forming in the $3,380–$3,400 range
.
Fundamentals: Geopolitical tension (e.g., Middle East conflict) and safe-haven inflows continue to underpin gold — though Citi expects prices to eventually correct toward $3,300–$3,500 mid‑term
Sentiment: Some analysts advocate “selling the rallies,” especially into the $3,450–$3,500 zone . But central banks’ ongoing buying and potential Fed rate cuts support a stronger floor
.
✅ Trade Strategy
Scenario Entry Zone Target Stop Loss Placement
Play the Bounce ~$3,350–$3,360 $3,497–$3,500 Below trendline near B zone (~$3,320)
Breakout Trade On momentum above $3,400 $3,497–$3,550 Below breakout (sub-$3,380)
Bearish Trigger Break & close below trendline Back to $3,296 / 3,120 Just above trendline ($3,360)
🔍 Summary
Gold remains in a structurally bullish setup inside an ascending channel. The confluence of harmonic reversal, strong trendline support, and pending fundamental catalysts presents a high-probability opportunity to push toward the $3,500 area—provided the trendline and $3,340–$3,350 support hold. A drop below would invalidate the bullish outlook and favor deeper retracement.

XAUUSD Potential long setup before big drop ?Gold is currently showing signs of a potential bullish reversal after a prolonged pullback within the Keltner Channel. Price is consolidating near the lower boundary of the 1H channel, indicating possible accumulation. The Heikin Ashi candles are flattening, and momentum appears to be stabilizing.
📍 Entry Zone: Near 3,369
🎯 TP1: 3,391 – aligned with mid-Keltner resistance and recent structure
🎯 TP2: 3,415 – upper Keltner band, offering a strong confluence zone
🛡️ Stop Loss: Below 3,357 – under recent support and Keltner lower band

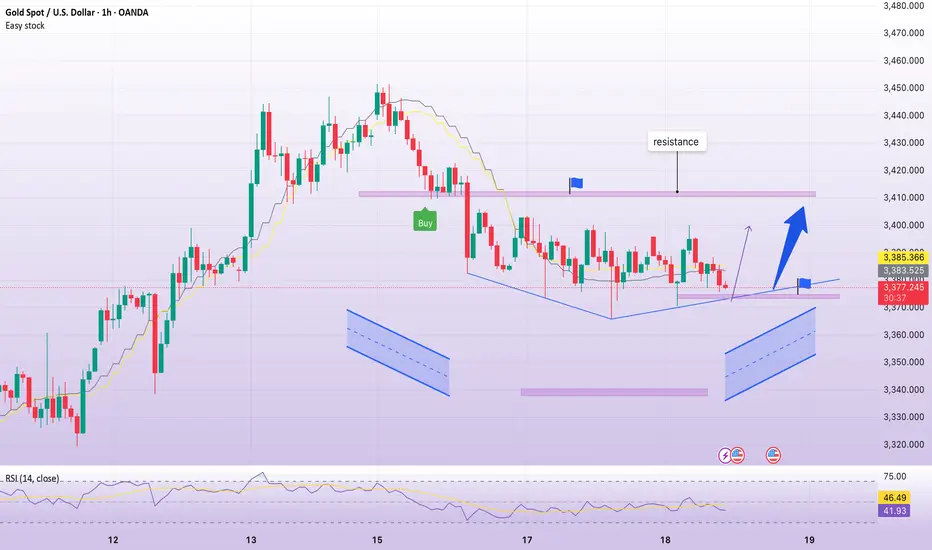
BUY 3375 , sideway H1, gold price accumulatesPlan XAU day: 18 June 2025
Related Information:!!!
Heading into the key central bank event risk, the disappointing US macro data released on Tuesday pointed to a softening economy and reaffirmed bets that the Fed will lower borrowing costs in September. This keeps a lid on the overnight US Dollar rally to the weekly peak.
The US Census Bureau reported that Retail Sales declined by 0.9% in May, compared to a 0.7% contraction expected and a 0.1% dip in April. Moreover, US Industrial Production fell short of estimates and contracted by 0.2% in May, following a revised 0.1% increase the previous month
personal opinion:!!!
sideways fluctuation in the price range of 3370 - 3395, gold price waiting for the result of keeping interest rates unchanged and continuing to accumulate around 3400
Important price zone to consider : !!!
Buy point: 3375 , 3338
Sustainable trading to beat the market
Gold on the Rise! – Bullish Setup in Focus The chart shows a repeating consolidation‑then‑breakout pattern, with Gold forming ascending swing structures, consolidating in rectangles (green), then riding higher along a rising trendline (purple). Price has just bounced off that trendline again, signaling a possible new leg up—potentially targeting the upper range near $3,448–3,450. A clear breakout above that level could open the door toward $3,500+.
📍 Trading Plan
🎯 Entry
Long on breakout above recent consolidation highs (~$3,440–3,448).
Alternatively, buy the dip near the purple trendline (~$3,385–3,390), with confirmation (hammer candle, bounce).
🛑 Stop‑Loss
For breakout: just below the top of the rectangle consolidation (~$3,389).
For trendline entry: slightly below recent swing low (~$3,358–3,360).
🎯 Profit Targets
Primary: upper rectangle level (~$3,448–3,450).
Extension: historic all‑time high region (~$3,500) → next major zone.
🎥 Path
Potential minor pullback toward trendline.
Bounce establishes support.
Surge toward top of range.
Breakout with trend continuation to new highs.
📊 Trade Risk & Reward
Target ~60–100 pts above entry, stop ~50 pts below → ideal Risk:Reward ≥ 1:1.2.
📌 Key Levels to Monitor
Level Role
$3,360 Swift dip support (green base line)
$3,390–3,400 Trendline confluence zone
$3,440–3,450 Breakout area & top of rectangle
$3,500 Next major resistance/all‑time high
🧭 Market Context & Drivers
Broad uptrend remains intact amid geopolitical tensions, especially the Israel–Iran situation, which continues to support safe-haven flows
investing.com
+15
reuters.com
+15
barrons.com
+15
forex24.pro
+1
goldpredictors.com
+1
.
Markets are positioning ahead of Fed’s June 18 decision; dovish signals could fuel continuation toward new highs (~$3,500+)
fxempire.com
.
Technical structure reflects bullish momentum—ascending wedge patterns with shallow dips and strong trendline bounces
fxstreet.com
.
✅ Summary
Bias: Bullish – uptrend intact.
Strategy: Go long on dip near trendline or on breakout above $3,445.
Stop‑Loss: Just below last swing low ($3,360).
Targets:
Near-term: $3,448–3,450
Medium-term: $3,500+
Stay tuned for Fed statements and Middle East headlines—they’ll be catalysts.

XAU/USD Price Action Analysis – June 12, 2025 XAU/USD Price Action Analysis – June 12, 2025 🪙📈
📊 Technical Overview:
The chart presents a clear range-bound market structure with well-defined zones of support and resistance:
📍 Key Levels:
🔴 Resistance Zone: $3,380 – $3,400
Price has been rejected multiple times from this level, as indicated by red arrows. It marks a strong supply zone.
🟢 Support Zone: $3,280 – $3,300
Price has bounced several times from this demand area, forming a reliable support base.
📏 Intermediate Level: $3,319.38
Marked with a purple line, this is likely a mid-range liquidity zone or a previous minor structure level.
🔄 Price Action Insights:
Double Bottom Formation: Notable at the support zone, confirming strong buying interest (highlighted with orange circles and green arrows). This pattern often signals a bullish reversal.
Current Price: Trading near $3,375.645, approaching the resistance area again.
Projected Scenarios:
Bullish Continuation 📈: Break and close above the resistance could trigger momentum to the upside — watch for a breakout with strong volume.
Pullback Scenario 🔁: A rejection from resistance could cause a retest of $3,319.38 or even the support zone, forming a higher low before a potential rally.
🧠 Strategy Outlook:
Bullish Bias 🐂 as long as price holds above $3,319.38.
Watch for Breakout 🚀 above resistance with volume confirmation for long entries.
Caution ⚠️ near resistance; ideal to wait for either a breakout or clear rejection.
📌 Conclusion:
The chart reflects accumulation within a range, with bullish structure emerging. A break above $3,400 could shift market sentiment decisively upward, while a failure at resistance invites a deeper pullback.

XAUUSD Bearish Rejection Setup Unfolding – June 11, 2025XAUUSD Bearish Rejection Setup Unfolding – June 11, 2025 🧠🔍
📊 Technical Breakdown:
🔴 Resistance Rejection Zone (Supply Area)
Price recently tested the $3,440 - $3,460 resistance zone, marked with red arrows. This zone previously acted as a strong supply area, leading to aggressive sell-offs.
📉 Bearish Rejection Candle
A rejection occurred near the same supply zone again, hinting at a potential double top or failure to break structure. Sellers seem to defend this area aggressively.
📍 Current Price: $3,338.6
Price is hovering below mid-range resistance at $3,396.5, indicating weakness after a failed breakout.
📉 Bearish Plan in Motion:
🔁 Scenario Highlighted:
Price might retest the $3,396.5 level (purple line) before resuming the downward move (illustrated by the blue and black arrows).
A breakdown below the $3,290.3 support zone will likely trigger further downside.
🎯 Target Levels:
1st Target: $3,290.3 – Key structural support. A close below this level will confirm the bearish momentum.
2nd Target: $3,207.0 – Final support area aligned with previous accumulation zone.
🛑 Invalidation Point:
A sustained breakout above $3,460 would invalidate the bearish bias and suggest continuation to the upside.
✅ Summary:
Bias: Bearish 📉
Strategy: Sell on pullback to $3,396.5 with stops above $3,460.
Targets: 🎯 $3,290.3 ➡️ $3,207.0
Watch for a strong bearish confirmation candle below $3,290.3 to load in shorts.
🔔 Stay alert for volume spikes and lower time-frame breakdowns to fine-tune entries! 💼📊

Gold on it’s target - Next Move BullishOur yesterday analysis went TRUE . As expected after reaching high gold came down for correction. As you all know today there is PMI news today, so market will come down and after that take upward momentum. So do wait for it and after that execute the trade.
Key point.
Support - 3348, 3335, 3329
Resistance - 3354, 3362, 3371
Any Query Reach Us or comment down
Rudra Vasaikar Wishes You A Great And Very Amazing Trading Life. Trade Safe, Trade Right.
RISK WARNING 🔴 🔴 🔴
There is high risk of loss in Trading Forex, Crypto, Indices, CFDs, Features and Stocks. Choose your trade wisely and confidently, please see if such trading is appropriate for you or not. Past performance is not indicative of future results. Highly recommended - Information provided by Pro Trading Point are for Educational purpose only. Do your investment according to your own risk. Any type of loss is not our responsibility.
HAPPY TRADING.
#gold #xauusd #xauusdtrading #goldtrading #goldanalysis #forextrading #forex #trendline #goldsignals #goldnews goldlatestanalysis #xauusdtradesetup #forextradingguide #fxgold

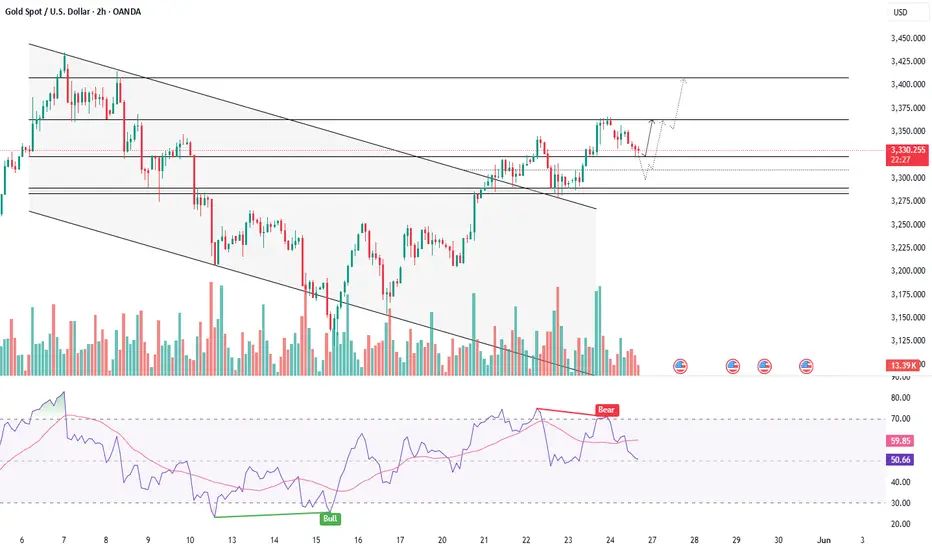
GOLD - RETESTING SUPPORT BEFORE THE NEXT CLIMBSymbol - XAUUSD
CMP - 3327
Gold continues to strengthen, supported by a complex and evolving fundamental landscape.
A false breakdown below the 3285 support level has facilitated a move to a new local high at 3365
Despite a weaker US dollar, gold experienced a modest pullback from the 3365 high amid subdued market activity caused by US market holiday. Investor sentiment reflects profit-taking ahead of key US inflation data releases. Additional downward pressure is linked to optimism surrounding a potential trade agreement between the United States, Europe and Japan. Nonetheless, the decline in gold prices remains limited, as safe-haven demand persists in response to ongoing geopolitical tensions, US fiscal concerns, and instability in the Middle East.
Support levels: 3321, 3308, 3300
Resistance levels: 3363
From a technical perspective, gold appears to be executing a false breakout above consolidation resistance and is entering a corrective phase. During this correction, the price may target liquidity zones in the 3320-3303 range before resuming its upward trajectory.
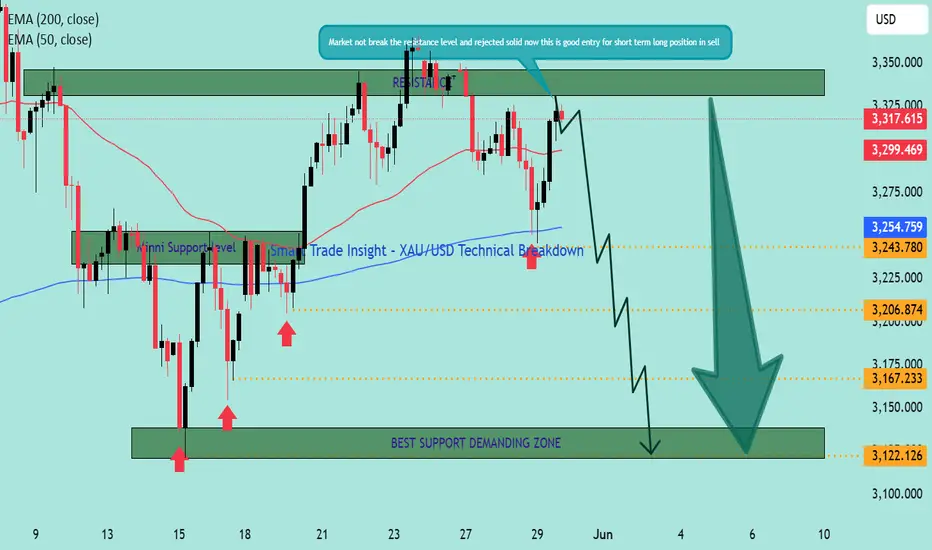
Smart Trade Insight – XAU/USD Technical BreakdownKey Levels & Technical Zones:
🔹 Resistance Zone (🔼 SELL Area):
📌 3,315 – 3,340
This area has been tested and rejected multiple times, as highlighted by the strong bearish wicks. The recent price action failed to break above it, triggering short interest.
🔹 Minor Support Zone:
📌 Around 3,243
Acted as intraday bounce area previously, now likely to offer weak support in the coming move down.
🔹 Major Demand Zone (💚 BUY Interest Zone):
📌 3,120 – 3,140
Labelled as "BEST SUPPORT DEMANDING ZONE" – historical demand visible with strong bounce history. Ideal for monitoring bullish reversal opportunities.
📈 EMA Levels:
🔴 50 EMA: 3,299
🔵 200 EMA: 3,254
Current price action is hovering near the EMAs. The rejection at the resistance while below the 50 EMA indicates weakening bullish momentum.
🔍 Market Structure Overview:
The double-top formation near the resistance shows exhaustion in buying.
Lower highs forming → structure turning bearish short-term.
Solid rejection confirms that this is a valid zone to initiate short positions 🛑📉.
📉 Forecast Path:
🔮 Projected Move:
Price is expected to break below minor support at 3,243.
Intermediate target: 3,206, then 3,167 🟠.
Final destination: Demand Zone at 3,120 – 3,140 🟩 for potential bounce 📈.
💬 "Market not break the resistance level and rejected solid — this is a good entry for short-term sell trades." ✅
✅ Trade Idea Summary:
🟥 Bias: Short
🎯 TP Targets: 3,206 → 3,167 → 3,122
📉 SL Suggestion: Above 3,340 resistance zone
🧭 Risk-Reward Setup: Favorable for short-term traders
Key Levels & Technical Zones:
🔹 Resistance Zone (🔼 SELL Area):
📌 3,315 – 3,340
This area has been tested and rejected multiple times, as highlighted by the strong bearish wicks. The recent price action failed to break above it, triggering short interest.
🔹 Minor Support Zone:
📌 Around 3,243
Acted as intraday bounce area previously, now likely to offer weak support in the coming move down.
🔹 Major Demand Zone (💚 BUY Interest Zone):
📌 3,120 – 3,140
Labelled as "BEST SUPPORT DEMANDING ZONE" – historical demand visible with strong bounce history. Ideal for monitoring bullish reversal opportunities.
📈 EMA Levels:
🔴 50 EMA: 3,299
🔵 200 EMA: 3,254
Current price action is hovering near the EMAs. The rejection at the resistance while below the 50 EMA indicates weakening bullish momentum.
🔍 Market Structure Overview:
The double-top formation near the resistance shows exhaustion in buying.
Lower highs forming → structure turning bearish short-term.
Solid rejection confirms that this is a valid zone to initiate short positions 🛑📉.
📉 Forecast Path:
🔮 Projected Move:
Price is expected to break below minor support at 3,243.
Intermediate target: 3,206, then 3,167 🟠.
Final destination: Demand Zone at 3,120 – 3,140 🟩 for potential bounce 📈.
💬 "Market not break the resistance level and rejected solid — this is a good entry for short-term sell trades." ✅
✅ Trade Idea Summary:
🟥 Bias: Short
🎯 TP Targets: 3,206 → 3,167 → 3,160
📉 SL Suggestion: Above 3,340 resistance zone
🧭 Risk-Reward Setup: Favorable for short-term traders
XAUUSD/GOLD SELL PROJECTION 29.05.25R1 (Resistance): Just above entry, marking the recent high.
S1 & S2 (Support levels): Intermediate levels where price might pause or bounce.
Low Zone: Aligns with TP2, marking a significant potential support zone.

XAUUSD/GOLD 30MIN SELL PROJECTION 28.05.25Bias: Bearish (Sell)
Pattern Identified: Evening Star (Bearish Reversal Pattern)
Entry Zone: Around 3,318.4 (just below the resistance marked S2)
Stop Loss: Just above the high of the Evening Star (~3,323.7)
Take Profits:
TP1: Around 3,311.0
TP2: Around 3,303.9 (near support S1)

Gold (XAUUSD) Technical Observation (XAUUSD):
If Gold (XAUUSD) breaks below the 3279.05 level on the 1-hour time frame, there is a possibility of a move towards the weekly support around the 3241 level. This is purely a technical observation based on current price action and support levels.
Disclaimer:
This is not a trade setup or a trading signal. The content shared is for informational and educational purposes only. It should not be considered as financial advice. Always conduct your own research or consult with a qualified financial advisor before making any trading decisions. Trading in financial markets involves significant risk and may not be suitable for all investors.

Bullish BAT on XAU/USDThere is a good chance for a prospective bullish BAT pattern on OANDA:XAUUSD if price touches around 3021.

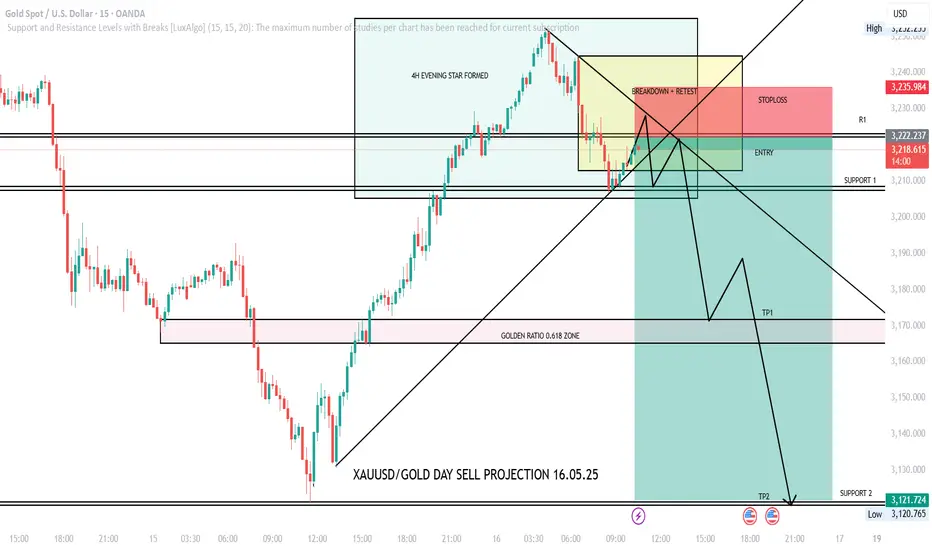
XAUUSD/GOLD DAY SELL PROJECTION 16.05.25📉 Sell Setup Overview:
Pattern Identified:
4H Evening Star — a bearish reversal pattern indicating potential downside.
Trade Setup:
Entry Zone: Around 3,219.970
Stop Loss: Above 3,235.984
Targets:
TP1 (Take Profit 1): Around 3,170.000 (Golden Ratio 0.618 zone)
TP2: Around 3,121.724 (near Support 2)
Technical Zones:
Breakdown + Retest zone highlighted in yellow (indicating confirmation of bearish reversal).
Golden Ratio (0.618) support/fib zone — used as a significant level for TP1.
Support 1 and Support 2 are drawn as potential price stalling or reversal zones.
XAU/USD Intraday Trade Signal**Date:** May 13, 2025
**Asset:** Gold (XAU/USD)
**Trade Type:** Intraday Buy
**Buy Zone:** 3240.00 - 3250.00
**Stop Loss:** 3207.00 (set below entry for risk management)
**Take Profit Levels:**
1st TP: 3260.00
2nd TP: 3278.00
3rd TP: 3294.74
4th TP: 3317.63
5th TP: 3347.38 (near potential high)
**Strategy:** Enter a buy position within the 3240.00–3250.00 range. Place stop loss at 3207.00 to limit downside risk. Target progressive take-profit levels, with the 5th TP at 3347.38 as a stretch goal near the daily high. Monitor price action closely and adjust trailing stops to lock in profits as targets are hit. Ensure risk-reward ratio aligns with your trading plan.

XAUUSD/GOLD WEEKLY SELL PROJECTION 10.05.25From easing tariffs to strong labor data, multiple factors are shaping gold's short-term corrections. Gold prices fall as US jobs data beats expectations and trade talks ease global tension. Spot gold slips from record highs amid China's holiday, but long-term support remains strong

XAUUSD/GOLD 1H SELL PROJECTION 08.05.25Bearish setup on XAUUSD (Gold vs. USD) with a strong indication for a potential short/sell opportunity based on several technical signals:
Key Observations:
Three Black Crows Pattern:
Clearly marked and highlighted on the chart.
This is a classic bearish reversal pattern indicating strong selling pressure.
Break of Neckline:
The price has broken below a previously established neckline area, confirming bearish momentum.
Support Becomes Resistance:
The neckline zone (~$3350.880) is now acting as resistance after the breakdown, further validating the short setup.
Target Levels:
Support S1 around $3330.
Support 2 near $3311.354 – likely the final target area for the sell projection.
Stop Loss Zone:
Clearly marked at $3362.631, above the broken support (now resistance).
Summary:
Entry Zone: Around current price (~$3344)
Stop Loss: $3362.63
Take Profit Zones:
TP1: ~$3330 (Support S1)
TP2: ~$3311.35 (Support 2) bearish setup on XAUUSD (Gold vs. USD) with a strong indication for a potential short/sell opportunity based on several technical signals:
Key Observations:
Three Black Crows Pattern:
Clearly marked and highlighted on the chart.
This is a classic bearish reversal pattern indicating strong selling pressure.
Break of Neckline:
The price has broken below a previously established neckline area, confirming bearish momentum.
Support Becomes Resistance:
The neckline zone (~$3350.880) is now acting as resistance after the breakdown, further validating the short setup.
Target Levels:
Support S1 around $3330.
Support 2 near $3311.354 – likely the final target area for the sell projection.
Stop Loss Zone:
Clearly marked at $3362.631, above the broken support (now resistance).
Summary:
Entry Zone: Around current price (~$3344)
Stop Loss: $3362.63
Take Profit Zones:
TP1: ~$3330 (Support S1)
TP2: ~$3311.35 (Support 2)
