“Bullish Momentum Accelerates → Trendline Support Holding for ?🟡 GOLD (XAU/USD) – Strong Bullish Continuation After Breakout 🚀📈
🔍 Market Structure & Key Observations
Price is respecting a clean upward trendline, confirming a strong bullish structure 📈
Multiple POI (Point of Interest) reactions show consistent buyer absorption → Smart Money accumulation 💼
A clear Breakout + BOS (Break of Structure) has occurred above the previous range ✔️
Price is now holding above the High Pivot Point, which has flipped into support 🟢
Current consolidation above support signals bullish momentum continuation, not exhaustion
🎯 Suitable Target Zones (High Probability)
🎯 Primary Target (TP1)
➤ 4,620 – 4,635 🎯
Aligned with projected bullish leg
Matches upper continuation structure
High probability if price holds above support
🚀 Extended Target (TP2)
➤ 4,660 – 4,680 🚀💰
Channel expansion target
Liquidity resting above recent highs
Valid if momentum accelerates
📌 Bullish Trade Scenario (Optional Setup)
🟢 Buy on Pullback Zone:
➤ 4,565 – 4,585 (trendline + support confluence)
🎯 Take Profit Levels:
TP1: 4,630 🎯
TP2: 4,675 🚀
📊 Risk–Reward: ~1:2.5 to 1:3+
🧭 Market Outlook
Factor Bias
Trend Strong Bullish 📈
Momentum Buyers in control 💪
Structure Higher highs & higher lows ✅
Liquidity Target Above highs 💧
Xauusdsetup

XAUUSD/GOLD 30MIN SELL PROJECTION 12.01.26Chart reading (simple)
Supply zone la price reject aagudhu → sell bias
Current price ~ 4574 (chart right side)
Resistance line near 4583–4584 area
Swing low target near 4546
✅ Best Next Move (30M Plan)
🔥 Sell Entry Zone
➡️ 4573 – 4576 (Entry zone chart-la mark panniruka range)
🛡 Stoploss (safe SL)
➡️ 4586 – 4588 (Supply/Stoploss zone top)
🎯 Targets
TP1: 4565 (support zone touch)
TP2: 4555
Final TP: 4546 (Swing Low) ✅

XAUUSD/GOLD WEEKLY BUY PROJECTION 11.01.2026🎯 Targets
✅ Target 1: 4,550 (Previous ATH + Double Top zone)
✅ Target 2: 4,625 (Resistance R2 zone)Bullish Momentum Candle
Bullish Pin Bar
Support RetestAscending Triangle Pattern
Higher lows (keezha trend line up poguthu)
Same resistance zone (double top + previous ATH zone)
I bullish continuation pattern.

Gold (XAUUSD) — Bullish Trend Test Near Support Before BreakoutWhat are your thoughts on GOLD?
Gold recently break resistance of range-bound consolidation phase successfully.
After breakout of resistance it is now forming pullback after the resistance.
Here our momentum is bullish
Recent events (e.g., U.S.–Venezuela crisis and broader political instability) have pushed investors into gold as a safe asset — lifting prices toward record highs. Gold traditionally rises when global risks increase because traders and institutions want to protect capital.
📌 Plan A — Bullish (Main Idea)
• Wait for pullback to trendline/support area — a good entry spot for a long (buy).
• Entry: near trendline/support check (price shows bounce pattern).
• Stop Loss: just below the trendline/support (risk control).
• Target: near the top resistance zone — move higher if breakout happens.
📌 Plan B — Breakout Buy
• If price breaks above the resistance zone with strength, enter on the breakout candle close.
• Stop Loss: just below breakout level.
• Targets: next resistance levels higher.

“Bullish Pullback → Trendline Support Holding for Next Rally🔍 Key Technical Analysis
Price previously formed a strong bearish breakout, followed by a price rebound from a high pivot demand zone (POI) 🔄
Market has established a clear upward channel, confirming a medium-term bullish structure 📈
Break of Structure (BOS) to the upside signals a shift from bearish to bullish momentum ✅
Price is currently pulling back toward the upward trendline & horizontal support, indicating a healthy retracement, not a reversal 🟦
Bullish momentum remains valid as long as price holds above the support zone around 4,440 – 4,450 💪
Liquidity is resting above recent highs near the resistance trendline 🎯
🎯 Potential Price Targets (with stickers)
Target Type Price Area Sticker
TP1 → Recent High Retest 4,490 – 4,500 🎯
TP2 → Trendline Resistance 4,520 – 4,540 🚀💰
📌 TP1 = Conservative & high-probability target
📌 TP2 = Extended bullish move if momentum accelerates
📌 Trade Setup Idea
🟢 Buy Zone:
➤ 4,440 – 4,455 (trendline + support confluence)
🎯 Take Profit:
➤ TP1: 4,500 🎯
➤ TP2: 4,535 🚀
🧭 Overall Market Bias
Factor Bias
Market Structure Bullish 📈
Trend Upward Channel Holding ✅
Momentum Buyers in control 💹
Liquidity Target Above highs 💧

XAUUSD/GOLD 1H BULLISH ENGULFING BUY PROJECTION 07.01.26Falling Wedge pattern (Bullish Reversal) on XAUUSD – 1H timeframe.
Why this is a Falling Wedge 👇
Price is making lower highs and lower lows
Both trendlines are converging
Selling pressure is reducing
Pattern forms after an uptrend → healthy pullback
What it indicates 📈
Bullish reversal / continuation
High probability of upside breakout
Best used for BUY setups
Your chart logic is correct because:
Entry is near wedge support
Stop-loss placed below structure support
Target toward previous resistance / ATH
Risk–Reward ≈ 1:2 (good trade management)
Trade idea summary:
Pattern: Falling Wedge
Bias: Bullish
Action: Buy on breakout / confirmation
Target: Resistance / ATH zone
SL: Below wedge + support

XAUUSD/GOLD WEEKLY SELL PROJECTION 04.01.26Price was moving inside a parallel uptrend channel
That channel is clearly broken, which is the first early warning of trend weakness
After the break, price failed to continue higher → bullish momentum exhausted
2️⃣ Major Reversal Patterns
Double Top Formation
Price tested the same resistance zone twice
Both tops were rejected strongly
This confirms buyers are unable to push price higher
M Pattern Confirmation
After the second top, price breaks below the neckline
This confirms trend reversal
3️⃣ Candlestick Confirmation (Very Strong)
At the resistance zone:
Evening Star (Triple Candlestick Pattern) → Classic reversal signal
Bearish Engulfing Candle → Sellers completely overpower buyers
These patterns together give a high-probability SELL confirmation
4️⃣ Resistance Zones
Resistance R2 → Major rejection zone (double top area)
Resistance R1 → Previous supply zone
Price respected resistance and obeyed the trendline → SELL zone
5️⃣ Entry Logic (SELL)
Sell after:
Trendline break
Double top confirmation
Bearish engulfing close
This is a swing low sell setup
6️⃣ Targets & Risk Management
Support S1 → First target / partial booking zone
Support S2 → Final target
Risk : Reward = 1 : 2

2026 XAUUSD/GOLD YEARLY ANALYSISXAUUSD / GOLD – 2026 Yearly Buy Plan
With Entry, Stop Loss & Targets
🔹 Market Bias
Gold (XAUUSD) is bullish for 2026 based on:
Global economic uncertainty
Central bank gold accumulation
Expected US interest-rate cuts
Strong long-term bullish structure on the daily chart
🔹 Buy Zones (Entries)
✅ Major Buy Zone (Best Risk–Reward)
Entry: 3,250 – 3,300
This zone is near:
Golden Fibonacci retracement
Yearly swing low
Strong institutional demand area
👉 Suitable for positional & long-term investors
✅ First Confirmation Buy
Entry: 3,950 – 4,050
Buy only if price holds above support and shows bullish candles
👉 Suitable for safe swing traders
🔴 Stop Loss (Risk Control)
🛑 Stop Loss Placement
Stop Loss: Below 3,150
Reason:
Break of yearly structure
Bullish view invalid below this level
📌 Risk should be 1–2% per trade, not more.
🎯 Take Profit Targets (2026)
🎯 Target 1
4,800 – 5,000
Partial profit booking recommended (30–40%)
🎯 Target 2
5,800 – 6,000
Trail stop loss to cost or profit
🎯 Target 3 (Long-Term Extreme Target)
7,500 – 7,800
Only for patient positional holders
🔹 Trade Management Plan
Buy only on pullbacks, not at highs
Book partial profits at each target
Move stop loss gradually as price moves up
Avoid over-leverage

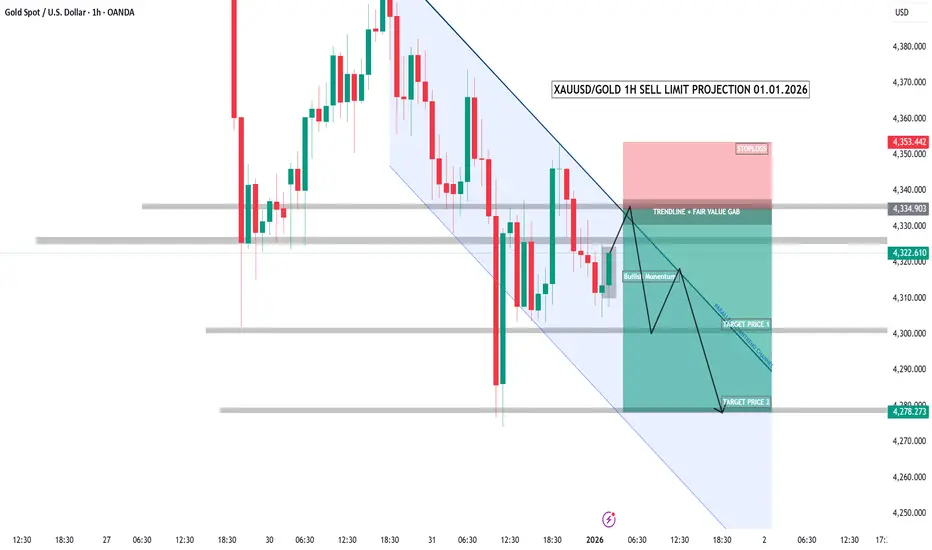
XAUUSD/GOLD 1H SELL LIMIT PROJECTION 01.01.26This is XAUUSD – Gold – on the 1-hour timeframe.
The market is clearly in a downtrend,
forming lower highs and lower lows.
Price is currently in a pullback phase within the trend.
This pullback is moving into a strong confluence zone —
the descending trendline combined with a fair value gap.
This area acts as a high-probability sell zone.
Sell limit area:
4330 to 4340.
Here, we expect a short-term bullish move to trap buyers,
followed by a strong rejection and continuation to the downside.
Stop loss:
4353 — a clear invalidation of the setup.
Target one:
4300 — a short-term support level.
Target two:
4278 — a strong demand zone and trend continuation target.
This is a pullback sell strategy.
Trade with the trend, not against it.
No emotions.
No overtrading.
Only structure, discipline, and patience.
XAUUSD ANALYSISI have market the possible wave count as per my analysis we can see new high in upcoming months before new high we can see 10 percent correction in gold in upcoming days this is simple correction all metals are bullish as per my analysis. i am attaching last analysis of gold also.
Thanks
Ishu Prajapati

XAUUSD/GOLD 4H BUY PROJECTION 28.12.25Pair: XAUUSD / Gold
Timeframe: 4H
Bias: Bullish (Buy continuation)
Date: 28-12-2025
Market is in a strong uptrend, respecting a parallel ascending channel.
📈 Technical Structure Explained
1️⃣ Trend & Pattern
Price is moving inside a Parallel Uptrend Channel
A Bullish Flag formed after a strong impulsive move
Then price formed a V-Continuation Pattern → strong bullish sign
Breakout happened with momentum candles
👉 This confirms trend continuation, not reversal
2️⃣ Key Levels Marked
🟦 Supports
Support S1: ~4520
Support S2: ~4500
These are dip-buy zones if price retraces.
🟥 Resistance / Breakout Area
Immediate Resistance: ~4530
Price broke & retested this zone
Also aligns with Fibonacci retracement + structure break
👉 This level is now acting as support
3️⃣ Entry Logic (Buy Setup)
✅ Buy Confirmation Zone
After breakout + retest
Strong bullish candle close above 4530
Momentum continuation (higher highs & higher lows)
🟩 Safe Buy Area:
4525 – 4535 (retest zone)
4️⃣ Targets (Upside Projection)
🎯 Target 1 (R1 / Previous High): ~4560
🎯 Target 2 (Expected ATH): ~4620
🎯 Extended Target: ~4660 – 4680
(Top of the channel / projected ATH)
5️⃣ Stop Loss (Risk Management)
🛑 SL Options:
Conservative SL: below 4500
Aggressive SL: below 4510
ATR-based SL preferred for volatility control

XAUUSD (Gold) Technical Outlook - 12/12/2025XAU/USD is trading around $4,278 with a Strong Buy trend across all major timeframes, confirming a solid bullish structure. As long as price holds above the 4,257 pivot, the uptrend remains intact, supported by the price trading above all moving averages. The bullish targets for the day are 4,283 → 4,311 → 4,340, with ideal buying opportunities on dips between 4,260–4,270 or a breakout entry above 4,285. Stop-loss for dip buying is 4,247, and for breakout buying is 4,270. A bearish scenario becomes valid only if price falls below 4,257, opening downside targets toward 4,230 and 4,175, but this remains a low-probability setup.
Price: $4,278 | Trend: Strong Buy
All timeframes (30M–Monthly) show bullish momentum
Price trading above all MAs = uptrend confirmed
Bullish Scenario
Bullish above 4,257
Targets: 4,283 → 4,311 → 4,340
Buy dips: 4,260–4,270
Breakout buy: Above 4,285
Bearish Scenario (Low Probability)
Bearish only below 4,257
Targets: 4,230 → 4,175
Day Strategy
Dip Buy SL: 4,247
Breakout Buy SL: 4,270
Disclaimer: This analysis is for educational and informational purposes only. It is not financial advice. Trading in Forex, Commodities, and Crypto involves risk. Always do your own research and trade at your own responsibility.

XAU/USD: SEIZE THE BUYING OPPORTUNITY BEFORE THE FED STORM!1. 📰 Fundamental Analysis (FA)
Cash flow is focusing on the FED this Wednesday.
Rate cut: A 25 basis point cut is expected. This puts downward pressure on the USD, pushing Gold (a non-yielding asset) to rise.
Safe haven: Ongoing Ukraine tensions further support the rise of precious metals.
Risk: Strong employment data (JOLTS) could slow the USD's decline, but the main trend remains policy easing.
2. 📊 Technical Analysis (TA)
On the 1H chart, Gold is completing a correction to the important Demand zone.
Buy Zone (Order Block): 4,175.00 – 4,195.00. This is where Smart Money accumulates before major events.
Target 1 (TP1): 4,228.214 – Fill the price gap (FVG).
Target 2 (TP2): 4,259.407 – Potential supply zone (POI).
Stop Loss (SL): Below 4,170.00 to protect the account if the scenario changes.
Strategy: Wait for the price to drop to 4,176.247 and a reversal signal to appear on the M15 chart to trigger a Long order. Be cautious of Chairman Powell's statements!
#XAUUSD #Gold #FED #FOMC #InterestRates #SmartMoneyConcept #OrderBlock #ForexTrading #TechnicalAnalysis #FundamentalAnalysis

Holding Breath for FOMC News - Will History Repeat?XAUUSD Trading Idea Today 10/12/25 (FOMC - Big News)
Will history repeat:
Before the news: Sideway | News release: prioritize SELL
Today's range: 417X–423X
Expectation: FOMC release leads to selling (Powell is usually hawkish → price drops like in September & October)
1) Intraday Trading (catching the Sideway range)
Upper range:
4218–4220
4230–4233
Lower range:
4170–4173
4180–4182
→ Morning & afternoon prioritize catching the range – trade within the range for safety before the news.
2) During the news (for those who trade the news)
Not suitable for those who are risk-averse, so you can skip if you can't handle it. Limit if you want to learn and profit using a very small account.
1) 4218–4220 (Risk-only) (if it doesn't break all day)
• High reaction area
• Safe → skip
• Risk → Probe sell, small SL
2) 4230–4233 (Main Sell)
• Strong resistance within the range
3) 4240–4244–424X (Best Sell)
• Liquidity zone
• If spike during/before news → High RR sell
3) Target down
TP1: 418X
TP2: 416X-5x
TP3: 409X (main target – swing + FVG + fibo)
4) BUY?
Attention area:
4150-52
4128-32
4102-96
5) Note on the news
This scenario holds if Powell maintains a hawkish tone.
If Powell is more "dovish" → it may go against expectations.
Risk-averse traders → do not trade the news.
News traders → use a small account to test market reactions.
Quick Summary
Before the news → Sideway, catch the range 417X–423X
News release → prioritize SELL
SELL zone: 4218, 4230–4233, 4240–4244
Main target: 409X
The price will move with each statement from the Fed Chairman and keep an eye on Trump too.
Wishing everyone a victorious day.

XAUUSD/GOLD 1H BUY PROJECTION 10.12.25“Character Invalid Here” (Lower Pink Zone)
This zone represents heavy sell pressure.
Price dropped deeply here → buyers were weak → sellers dominated.
From this area, the market started recovering upward slowly.
2️⃣ Day High as Resistance R1 (Middle Pink Zone)
This is a strong resistance level.
Price tested this zone multiple times and faced rejection.
This confirms it as a key intraday resistance.
Once price breaks and retests this area, bullish confirmation becomes stronger.
3️⃣ Bounce Back Area (Green Horizontal Zone)
This area is where you expect the pullback (retracement) to happen.
When price returns to this zone:
✔ Buyers re-enter the market
✔ Trend continues upward
✔ You get safe entry confirmation
This is a high-probability buy zone.
4️⃣ Entry After Bounce Back (Red Zone)
This is the ideal buy entry area after confirmation.
Your structure shows:
Price breaks the resistance
Pulls back for retest
Holds the major trendline
Respects the curved support (cup structure)
This indicates a strong bullish continuation setup.
5️⃣ Target Price (Weekly High Resistance & TP)
This is the weekly high, which acts as the final target.
The price is expected to reach this level due to:
Strong bullish momentum
Breakout + retest confirmation
Trendline support
Clean upside liquidity
This is a realistic and high-probability target.

XAUUSD/GOLD JOLTS Job Openings News Projection 09.12.25Main Idea
Gold is currently ranging between 4,191 – 4,210 zones.
During JOLTS news volatility, price may either break upward or break downward from this zone.
Your plan is a breakout + retest entry with a 1:3 Risk–Reward Ratio.
🟢 Bullish Scenario (Buy Setup)
Conditions to Buy:
Price breaks above 4,210 zone
Retests the same zone and holds as support
Enter after bullish confirmation
Target:
4,250 zone
Stoploss:
Below 4,191 zone
🔴 Bearish Scenario (Sell Setup)
Conditions to Sell:
Price breaks below 4,191 zone
Retests the level as resistance
Enter after bearish confirmation
Target:
4,163 zone
Stoploss:
Above 4,210 zone
🎯 Risk–Reward Ratio: 1:3
Both setups aim for a low-risk and high-reward breakout trade using news momentum.

XAUSD/GOLD 4H SELL PROJECTION 07.12.251. Major Rejection Zone
Price tapped into the Huge Liquidity Collection Zone (yellow zone).
Strong rejection with bearish candlestick formations (Engulfing + Spinning Top).
2. Pattern Confirmation
Double Top formation at Resistance R1–R2.
Neckline broken and candle closed below – confirming trend reversal.
Break of a major triangle pattern also supports bearish continuation.
3. Entry Zone
Entry marked at 4,207.97 zone after retest and bearish confirmation.
Confluence with:
Resistance Rejection
Structure Break
Bearish candle patterns
4. Stop Loss (SL)
SL placed at 4,243.17, above the wick and liquidity grab zone.
5. Take Profit (TP)
Targeting Premium Zone around 4,146.62.
Risk–Reward Ratio: 1 : 2
🎯 Final Sell Projection
Expecting price to drop towards 4,146–4,150 zone after rejection from liquidity and break of structure.
Bearish candlestick confirmation increases probability of continuation move.

XAUUSD - Gold Spot US Dollar Technical Analysis🟢 BUY zones + buy confirmation levels
🔴 SELL zones + sell confirmation levels
🚫 NO-TRADE zone
🎯 TP (Take Profit) levels
🛑 SL (Stop Loss) levels
📌 Why buy / why sell (Price-Action logic)
✅ 1. NO-TRADE ZONE (as on chart)
The shaded middle area 4,150 – 4,210 is a NO-TRADE ZONE.
❌ Why no trade here?
Price is compressing sideways.
No fresh demand or supply.
Buyers/sellers both weak → liquidity building.
Best area to wait for breakout above or below.
🟢 2. BUY SETUP (Bullish Scenario)
✔ Buy Trigger
Buy ONLY above: 4,265 → clean breakout from supply
When price breaks and closes above 4,265, it confirms:
Supply removed
Trend continuation
Buyers taking control
🛑 Buy Stop-Loss
Place SL below the breakout candle or safe level:
SL = 4,198 – 4,210 zone (mid-zone)
Because if price falls back inside zone → fake breakout.
🎯 Buy Take Profit Levels
TP1 → 4,320 – 4,350
TP2 → 4,449 (major supply zone)
TP3 → 4,550+ if strong momentum continues
📌 Why Buy?
Break above previous high
Clean imbalance above (room to move)
Price action pattern → Break of Structure (BOS)
Market in bullish expansion when above 4,265
🔴 3. SELL SETUP (Bearish Scenario)
Sell only when price breaks below NO-TRADE ZONE.
✔ Sell Trigger
Sell below: 4,096 (break of demand)
This confirms:
Demand removed
Trend shift to bearish
Sellers active after taking liquidity from the range
🛑 Sell Stop-Loss
SL above failed demand zone:
SL = 4,150 – 4,170
🎯 Sell Take Profit Levels
Use the marked blue lines:
TP1 → 3,991
TP2 → 3,952
TP3 → 3,901
TP4 → 3,762 (extended target)
📌 Why Sell?
Break of key structure level (4,096)
Below range → trend continuation short
Liquidity targets below (equal lows + imbalances)
Price action → Lower Low + Lower High continuation
🔥 PRICE ACTION LOGIC (Simple Explanation)
✔ Buy Logic
Market is accumulating in the NO-TRADE zone
Break above 4,265 = buyers win
Price targets previous supply zones
✔ Sell Logic
If price breaks below 4,096, demand collapses
Market enters markdown phase
Lower supports become liquidity targets

XAU/USD: Hold Gold, Await Big Waves from PCE!Gold is moving sideways within a narrow range, supported by a weak USD and expectations of a dovish Fed. All attention is focused on the upcoming PCE Index – the data will determine the long-term momentum of XAU/USD!
📰 Fundamentals: Awaiting Major Signals
Gold's Advantage: USD weakens due to predictions of early Fed rate cuts + Safe haven demand.
Key Point: PCE data will be the "push" confirming the Fed's path.
📊 4H Technical: Trend-Following Buy Strategy
Market structure remains BULLISH. We await a correction to enter at optimal price levels:
Ideal BUY Zone (OTE/Support):
Price: $4,133 - $4,161
Action: Wait for reversal signals here to BUY (Long).
Upside Target: $4,334 up to $4,382 (Previous high).
Safe Stop Loss: Below $4,046 (Below OB), a break here will invalidate the bullish structure.
🎯 In Summary: BE PATIENT! Look to BUY in the $4,133 - $4,161 zone after PCE release to optimize R:R.
#XAUUSD #GOLD #Gold #PCE #FED #TradingView #MarketStructure #OTE #Forex

Gold (XAU/USD): FED WILL CUT! ADP HAS MADE IT CLEAR.🎯 Fundamental Summary
SHOCKING News: ADP private payrolls unexpectedly DECREASED by 32,000 (completely contrary to the expected increase).
Impact on Fed: This weak labor data strongly reinforces the expectation that the Fed will cut interest rates by 25 basis points at the next meeting.
Conclusion: A lower interest rate environment is the main "tailwind," boosting demand for non-yielding Gold.
📈 Technical Analysis
The market is approaching a decisive zone. Gold needs a breakthrough:
Strong Supply Zone (Key Level): $4,200 – $4,212
Expected Action/Reaction: If Gold breaks and closes above $4,212, the fundamental momentum will prevail, confirming a strong UP trend.
Important Demand Zone (Strong Support): $4,131 – $4,140
Expected Action/Reaction: The final support area. If there is a deep decline, this is a potential buying point based on the news.
#XAUUSD #GoldAnalysis #SmartMoneyConcepts #FundamentalAnalysis #Fed #ADP #LaborMarket #TradingView

what do you think about today's gold price?Hello Traders, what do you think about today's gold price?
Today the market will have news related to Unemployment Benefits, so I expect the trading range to be slightly narrow and liquidity relatively low. Please be more cautious in placing orders and managing capital.
Below are the important support – resistance zones I am monitoring today:
🔵 BUY ZONE (Support)
4180 – 4184
4160 – 4165
4150 – 4155
4130 – 4133
➡️ These are strong support zones – prioritize watching for Buy in the Sideway range.
🔴 SELL ZONE (Resistance)
4240 – 4244
4250 – 4255
➡️ These are the upper resistance zones – suitable for watching for Sell when the price rebounds to the range.
👀 NEAREST OBSERVATION ZONE
4217 – 4220
➡️ This is the directional zone, observe price reactions to determine continuation or adjustment forces.
🎯 Trading orientation for the day
Personal style: SL10 price – TP10 price.
Trade within the Sideway range, Buy low – Sell high.
Break any zone, trade that zone, avoid holding orders against the trend.
Low liquidity → trade lightly & manage capital tightly.
⚠️ Note: This is a personal trading plan, not investment advice. Please consider it as reference material.
Wishing you a successful trading day – enter and win! 💹✨

XAUUSD: Rate Cut Storm Ahead! Is Gold Set to Soar?1. 📢 FUNDAMENTALS PUSHING PRICE
FED About to Cut Interest Rates (90%): Cooling U.S. economic data strengthens the expectation of a 25bps cut next week. This weakens the USD and supports Gold.
Geopolitical Risks: Russia-Europe tensions keep the safe-haven demand for Gold high.
Key Event: Watch PCE on Friday to better determine the Fed's monetary policy path.
2. 🎯 TECHNICAL ENTRY POINTS
The optimal strategy is to BUY ON DIPS at strong support:
Optimal Buying Zone (Discount Zone): $4,181 – $4,186. This is the ideal Long Entry Point.
Resistance/POC: $4,207. Important short-term level.
Upside Target: $4,240. Next profit-taking target.
👉 Conclusion: Be patient and wait for Gold to adjust to the $4,181 - $4,186 zone to enter a buy order with low-risk advantage, leveraging macro upward momentum.
#XAUUSD #GOLD #FED #InterestRateCut #GoldAnalysis

XAUUSD/GOLD 1H BUY PROJECTION 02.12.25“Gold is currently reacting strongly from the premium weekly support zone.
A clear bullish engulfing candle has formed at the bottom, indicating strong buying pressure.”
Next:
Price was moving inside a parallel downtrend channel, but
The bearish structure has now broken, confirming a potential trend reversal.
The market has also broken the trendline, showing strong momentum from buyers.
After breaking the trendline, price is expected to:
Retest the break level (support turning from resistance).
Continue bullish towards Resistance R1 around 4228–4232.
If momentum holds, the move may extend towards Resistance R2 at 4255–4260.
This structure aligns with a clean liquidity grab, followed by trend reversal and bullish continuation.
🎯 Key Points (Easy to Explain on YouTube)
✅ Premium Weekly Support Zone Hit – strong reversal area
✅ Bullish Engulfing Formed – confirmation of buyer strength
✅ Downtrend Channel Broken – trend reversal confirmation
✅ Expecting Retest → Buy Continuation
🎯 Target 1: Resistance R1 (4230 level)
🎯 Target 2: Resistance R2 (4260 level)
⛔ Stop Loss: Below Weekly Support Zone (around 4185)
📌 Summary for Your Video / Telegram Post
“Gold is showing a strong bullish reversal from the premium weekly support zone.
A bullish engulfing followed by a clean trendline break confirms a potential buy setup.
As long as price holds above the retest zone, we expect upside targets towards 4230 and 4260.”
If you want, I can also prepare:
✔ YouTube Title + Description
✔ Thumbnail text (big bold letters)
✔ Short-form script (30–45 sec)
✔ Hashtags
✔ PDF or PNG formatted analysis
Just tell me “make title, description & thumbnail” and I’ll generate it.
