XAUUSD: Rate Cut Storm Ahead! Is Gold Set to Soar?1. 📢 FUNDAMENTALS PUSHING PRICE
FED About to Cut Interest Rates (90%): Cooling U.S. economic data strengthens the expectation of a 25bps cut next week. This weakens the USD and supports Gold.
Geopolitical Risks: Russia-Europe tensions keep the safe-haven demand for Gold high.
Key Event: Watch PCE on Friday to better determine the Fed's monetary policy path.
2. 🎯 TECHNICAL ENTRY POINTS
The optimal strategy is to BUY ON DIPS at strong support:
Optimal Buying Zone (Discount Zone): $4,181 – $4,186. This is the ideal Long Entry Point.
Resistance/POC: $4,207. Important short-term level.
Upside Target: $4,240. Next profit-taking target.
👉 Conclusion: Be patient and wait for Gold to adjust to the $4,181 - $4,186 zone to enter a buy order with low-risk advantage, leveraging macro upward momentum.
#XAUUSD #GOLD #FED #InterestRateCut #GoldAnalysis
Xauusdsetup

XAUUSD/GOLD 1H BUY PROJECTION 02.12.25“Gold is currently reacting strongly from the premium weekly support zone.
A clear bullish engulfing candle has formed at the bottom, indicating strong buying pressure.”
Next:
Price was moving inside a parallel downtrend channel, but
The bearish structure has now broken, confirming a potential trend reversal.
The market has also broken the trendline, showing strong momentum from buyers.
After breaking the trendline, price is expected to:
Retest the break level (support turning from resistance).
Continue bullish towards Resistance R1 around 4228–4232.
If momentum holds, the move may extend towards Resistance R2 at 4255–4260.
This structure aligns with a clean liquidity grab, followed by trend reversal and bullish continuation.
🎯 Key Points (Easy to Explain on YouTube)
✅ Premium Weekly Support Zone Hit – strong reversal area
✅ Bullish Engulfing Formed – confirmation of buyer strength
✅ Downtrend Channel Broken – trend reversal confirmation
✅ Expecting Retest → Buy Continuation
🎯 Target 1: Resistance R1 (4230 level)
🎯 Target 2: Resistance R2 (4260 level)
⛔ Stop Loss: Below Weekly Support Zone (around 4185)
📌 Summary for Your Video / Telegram Post
“Gold is showing a strong bullish reversal from the premium weekly support zone.
A bullish engulfing followed by a clean trendline break confirms a potential buy setup.
As long as price holds above the retest zone, we expect upside targets towards 4230 and 4260.”
If you want, I can also prepare:
✔ YouTube Title + Description
✔ Thumbnail text (big bold letters)
✔ Short-form script (30–45 sec)
✔ Hashtags
✔ PDF or PNG formatted analysis
Just tell me “make title, description & thumbnail” and I’ll generate it.

XAUUSD/GOLD 1H BUY PROJECTION 02.12.25Market Structure
Price has broken the uptrend line, causing a corrective move inside a descending channel.
The correction is respecting channel boundaries (multiple rejections on top & bottom).
🔹 Key Zones
Support Zone: 4180 area
→ Confluence of FVG (Fair Value Gap) + Demand Zone + Channel Bottom.
Target Zone: 4218–4220
→ Retest of the broken structure zone.
🔹 Buy Setup Logic
Price dipped into OBEY CHANNEL + FVG + SUPPORT zone (blue/purple box).
Expectation: Price should bounce from support and move higher.
First target aligns with:
Channel Top
Breaked zone retest
Previous minor structure level.
🔹 Projection Outcome
A bullish push towards 4218.89 zone is projected if support holds.
SL should be placed below the 4168–4170 zone under channel + FVG.

GOLD IN HAND WITH FED'S PUSH: ADJUSTMENT IS AN OPPORTUNITY!Wonderful! I will create another headline focusing on market dynamics and fundamental factors, excluding specific price levels, but still maintaining appeal and information.
🐂 GOLD IN HAND WITH FED'S PUSH: ADJUSTMENT IS AN OPPORTUNITY! 🚀
1. Fundamental Push
Main Support Force: Expectations of a dovish Fed and weak US economic data (PMI ISM 48.2) are weakening the USD and increasing bets on a Fed rate cut in December, strongly supporting Gold.
Geopolitical risks remain a potential "lifeline."
2. Technical Analysis & Opportunity
The main structure (1H) remains an Uptrend. The current price drop is a Pullback.
Strategic BUY Zone (DPZ):
Range: $4,195.961 – $4,199.760 (Converging with the Uptrend Line).
Action: WAIT TO BUY (LONG) when a confirmed reversal signal appears in this zone.
Targets:
TP1 (Short-term): $4,219.953
TP2 (Long-term): $4,244.426
Stop Loss:
Set a safe SL below DPZ, for example: Below $4,190.00.
🔥 Conclusion: As long as XAU/USD holds above the Uptrend Line and DPZ, we prioritize seeking BUY opportunities to continue the main trend.
#XAUUSD #Gold #GoldAnalysis #ForexTrading #FED #USD #LongOpportunity #MarketStructure

What do you think about gold’s movement today?Hello traders!
What do you think about gold’s movement today?
Market Context
This morning, the Fed Chair delivered a speech without mentioning any economic updates. Despite that, gold still showed a corrective move, indicating that the SELL side remains dominant at the moment.
Main Strategy for Today
🔴 Prefer SELL setups
Stop selling only if price breaks above 4,246 — a key level defended by sellers.
Consider SELL entries at the previous high 4,265.
Additional SELL reaction zone to watch: 4,227 – 4,225.
BUY on deeper pullbacks
Ideal BUY zone: 4,194 – 4,190
BUY zone: 4,209 – 4,206
→ Only BUY if strong support reactions or reversal patterns appear.
🎯 Risk Management
Stop Loss (SL): 100 pips
Take Profit (TP): 100 pips
→ Maintain consistent risk throughout the session.
Do you think gold will continue to face bearish pressure and break lower,
or will it bounce from these deeper support zones and regain momentum?

Resistance Rejection → Bearish Pullback Toward Support🟡 GOLD (XAU/USD) – Bearish Rejection from Major Resistance 🟥📉
🔍 Key Technical Insights
Price rejected the major resistance zone around 4,245 – 4,255
Rising Support Line has been broken → signals weakening bullish momentum ❌
Current structure favors a pullback toward demand area
Market seeking liquidity below recent swing lows 💰
🎯 Suggested Targets (with stickers)
Target Type Price Area Sticker
TP1 → Support Retest 4,210 – 4,215 🎯
TP2 → Demand Zone 4,195 – 4,205 📉💰
📌 TP1 is your high-probability target
📌 TP2 is for extended move if bearish momentum continues ⬇️
📌 Trade Setup Idea
📍 Sell Entry Zone:
➤ 4,238 – 4,245 (after failed breakout)
🎯 Take Profit:
➤ TP1: 4,215 🎯
➤ TP2: 4,200 📉💸
🧭 Overall Market Outlook
Factor Bias
Short-term Trend Bearish Pullback 🔻
Liquidity Downside targets in focus 💧
Resistance Reaction Strong rejection 🚫

GOLD EXPLOSION: XAUUSD READY TO ACCELERATE!📰 BASIC SUMMARY (FA): PRESSURE ON USD AND SAFE HAVEN DEMAND
Gold is receiving strong support thanks to:
FED DOVISH: Recent comments from FED Governors (Waller, Williams) and information about Kevin Hassett potentially taking the position of FED Chairman (supporting strong rate cuts) are boosting expectations for rate cuts, weakening the US Dollar (USD).
GEOPOLITICS/ECONOMICS: News about conflicts in the Black Sea and weakening Chinese manufacturing data (PMI decline) reinforce Gold's safe haven role, pushing prices to a 6-week high.
📈 TECHNICAL ANALYSIS (TA): MAINTAINING UPWARD STRUCTURE
The 2H chart shows Gold in a clear UPWARD trend (with multiple BOS). The optimal strategy is to wait for price adjustments to the key demand zone:
Action: ENTRY (BUY)
Price Range: $4,185 – $4,192 (Breakout/Demand zone established. Wait for confirmation here.)
STOP LOSS (SL): Below $4,160.9 (Invalidates upward structure if price breaks.)
TARGET 1 (TP): $4,244.8 (Nearest resistance.)
TARGET 2 (TP): $4,270.1 – $4,276.1 (Main growth target.)
Strategy: Patiently wait for a Pullback to the $4,185 – $4,192 zone to enter a LONG position following the trend.
⚠️ IMPORTANT ECONOMIC CALENDAR:
Pay attention to the US ISM Manufacturing PMI data and other macro reports this week to assess USD momentum.
#XAUUSD #GOLD #GoldAnalysis #FED #Dovish #Uptrend #MarketStructure #TradingView #Forex

GOLD EXPLOSION: READY TO CONQUER NEW HEIGHTS?I. HOT NEWS 💥
Gold is experiencing its 4th consecutive monthly increase, reaching $4,192.78/oz (closing on 11/28) thanks to significant changes from the Fed.
Interest Rate Reversal: Recent statements from the Fed Governor have increased the probability of a rate cut in December 2025 to 89% (up from 50% last week).
Gold Connection: A low-interest-rate environment is a paradise for Gold, propelling it to become a safe-haven asset. The fundamental momentum is EXTREMELY STRONG.
II. TECHNICAL ANALYSIS 📊
The price is approaching a critical supply zone. The current strategy is Buy on Dip with higher targets.
Short-term Resistance Target (PDI):
Price Range: $4,210 – $4,235
Strategy: Short-term resistance, requires a decisive Breakout to continue the upward momentum.
Ultimate Target (FVG):
Price Range: $4,260 – $4,330
Strategy: The next potential profit-taking target for Smart Money. Main Long target.
Strong Demand Zone (OB - Order Block):
Price Range: $4,046 – $4,064
Strategy: Strategic support (Demand Zone). A safe buying area if the price corrects deeply.
III. CONCLUSION & RISKS 🎯
Market Sentiment: Strongly BULLISH thanks to momentum from the Fed.
Focus: Monitor price action around $4,235. If surpassed, $4,330 is not far off.
Warning: Always manage risk (SL) tightly. Do not trade without Price Action confirmation!
#XAUUSD #GOLD #FOREX #FedDovish #RateCuts #SMC #OrderBlock #FVG #BullishTrend #TradingView

“BOS Confirmed — Demand Retest for Next Bullish Leg🟡 GOLD (XAU/USD) – Bullish Continuation Setup from High Probability Demand Zone 🆙
🔍 Chart Breakdown & Key Insights
Price created a Break of Structure (BOS) to the upside → confirming bullish momentum ✔️
Retested the Demand Line + Support Zone → buyers defending strongly 💪
High Probability POI (previous accumulation zone) remains valid with liquidity swept below → smart money accumulation evidence 💰
Current pullback = healthy retracement into demand before potential continuation
🎯 Targets (With stickers)
🎯 Target Zone Price Region Sticker
TP1 → Retest recent high 4,165 – 4,175 🎯
TP2 → Liquidity above highs / extended target 4,180 – 4,195 🚀💸
TP1 hit possibility is HIGH due to bullish structure 📈
TP2 depends on strength of breakout ⬆️
📌 Trade Idea (High Probability Setup)
🟩 Buy Entry Zone:
➤ 4,120 – 4,130 (pullback entry at support)
🟢 Take-Profit:
➤ TP1: 4,170 – TP2: 4,190
📊 Risk-Reward Ratio: 1:2.5 – 1:3+ ✔️
🧭 Market Structure Sentiment
Factor Outlook
Trend Bullish 📈
Liquidity Upside still available 💧
Smart Money behavior Accumulation & continuation expected 💼
⚠️ Just watch if price breaks below the demand line → would weaken this bullish plan.

USD Stunned: Buy Gold at the Adjustment Bottom!1. Fundamentals Quick Take
US Data: Positive (Jobless Claims 216K, lowest in 7 months, Durable Goods +0.5%).
Fed Policy: Extremely Dovish. Fed officials hint at a 25bps rate cut as early as December.
Impact: Low interest rate expectations push DXY down: Strong support for Gold.
2. Technical Outlook - H1
Trend: Strong Uptrend.
Position: Price is below Resistance/Supply (CP Zone - around 4,175 - 4,195). High likelihood of short-term adjustment.
Strategy: Focus on BUY (Long) at strong Demand/Support zones, do not Short based on short-term reactions.
Ideal Long Zone: Around 4,129 or 4,096.
Conclusion: Wait for price to adjust to the Demand zone to enter Long orders following the main trend, based on the USD's decline momentum from Fed signals.
#XAUUSD #Gold #Fed #DXY #TradingView

XAUUSD BUY OR SELL TODAY?1. Main Market Context for Today
Jobless claims came in better than expected → USD strengthens, but gold did not drop — it continued to move sideways → the market is in accumulation and waiting for a breakout.
Today’s priority strategy is range trading:
Lower range: 4130–4135
Upper range: 4170–4175
Once price breaks clearly out of either range → switch to trend-following (pursuit) trading.
2. Range-Trading Plan (Primary Strategy for Today)
(A) Buy at the Lower Range – 413X Zone
Buy area: 4130–4135
SL: 100 pips
TP: 100 pips
Reason: This is the main demand zone and aligns with the ascending trendline shown on your chart.
➡️ Strategy:
Wait for price to “sweep” the lows → show confirmation → then take a quick BUY trade.
(B) Sell at the Upper Range – 417X Zone
Sell area: 4170–4175
Reason: Strong supply zone with repeated reactions.
➡️ Strategy:
Wait for a rejection candle (pin bar / bearish engulfing) → then SELL.
3. Current Reaction Zone – 414X
This is the zone price is currently testing.
Do not enter immediately; just observe:
If price bounces strongly from 414X → target is to retest 417X
If 414X breaks → price will likely retest 413X → better BUY entries there.
4. Deeper BUY Zones (If Price Breaks Downward)
Here are the levels you mentioned, organized clearly:
BUY Zone
4110–4108
4102–4100
4096–4094
→ These are deeper liquidity zones below the main range, activated only if gold breaks below 413X.
5. SELL Zones if Price Breaks Upward (Above 417X)
SELL Zone
4202–4200
4194–4190
4183–4180
→ These are upper supply retest zones, activated only after price breaks above 417X.
🟨 6. Main Scenarios for Today
Scenario 1 – Expected Sideway (Highest Probability)
Price moves within 413X – 417X, bouncing between the range limits.
→ Trade the range (scalp/intraday).
Scenario 2 – Break Below Range
If 4130 breaks → price will head to 4110 → 4100 → 4094
→ BUY at deeper zones.
Scenario 3 – Break Above Range
If 4175 breaks → price will aim for 4183 → 4194 → 4200–4202
→ SELL at higher zones.
✅ One-Line Trading Summary
Trade primarily within the 413X–417X range (buy low – sell high). If the range breaks, switch to trend-following using the deeper BUY zones or higher SELL zones provided above.

Gold (XAU): Fed Cut Incoming? Breakout Time!I. 📰 FUNDAMENTAL ANALYSIS (FA)
The Vibe: The US Dollar (DXY) is facing serious heat! The US Fed's recent dovish signals are a major tailwind for non-yielding Gold.
Fed's New Tune: Big guns like Governors Williams and Waller are now talking about rate cuts soon. Why? Because US economic data (Retail Sales, Consumer Confidence) is getting weaker, boss.
Market Buzz: The market is pricing in a strong nearly 85% probability of a 25bps rate cut in December. Picture clear, right?
Takeaway: This shift is Massively Bullish for Gold because lower interest rates make the Dollar less attractive.
II. 📈 TECHNICAL ANALYSIS (TA)
The Scene: Gold is currently bumping heads with a major hurdle – the Discount Zone (our supply zone). The real action is here!
Crucial Resistance: Gold is testing the Discount Zone (the main resistance area). This is the make-or-break level.
The Short Game (Bearish): Wait for a clear rejection signal at this resistance zone. If it holds, a correction is coming.
The Long Game (Bullish): For Gold to go on a proper rally, it needs a Strong Breakout and Close above the entire resistance area.
💡 THE STRATEGY
Focus on the Resistance Level: Trade based on Confirmation, whether that's a reversal signal for a short correction, or a strong breakout for a fresh long position.
Don't miss the US data tonight (Durable Goods/Jobless Claims) – it will be the real fire starter!
#GoldTrading #XAUUSD #ForexIndia #FedRates #DovishFed #TechnicalAnalysis #MarketUpdate #FinanceIndia

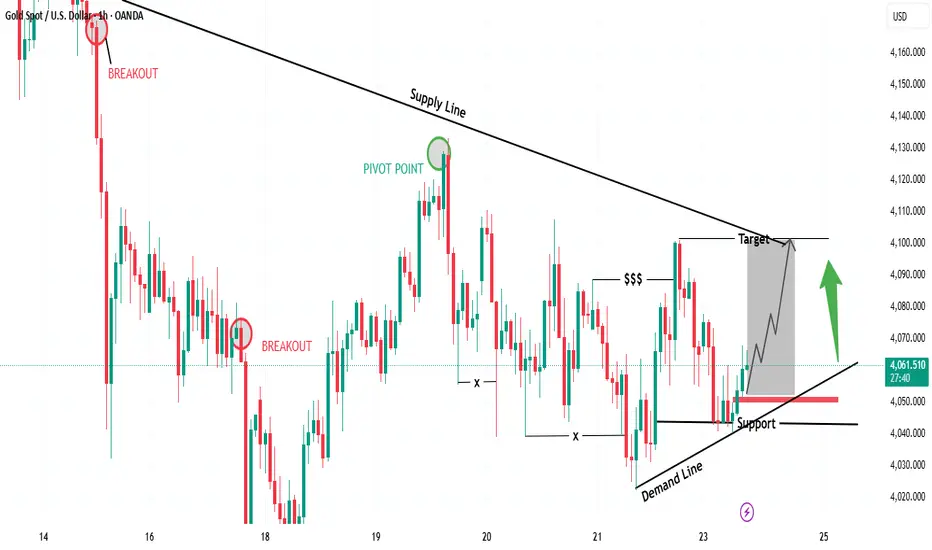
“Gold Rebounding from Demand – Targeting Supply Line Retest🔍 Key Observations
📉 Supply Line (Downtrend Resistance)
Each rally is being capped by the descending supply line
📈 Demand Line (Ascending Support)
Buyers defending higher lows
Strong bullish reaction off support
💰 Liquidity Grab ($$$)
Liquidity was taken below swing lows — bullish signal
Smart money likely securing positions before pushing up
🟢 Bullish Confirmation
If price holds above demand line + support zone
Expect bullish continuation toward supply line retest
🎯 Suitable Target Levels
Target Level (Approx) Status
🥇 First Target 4,095 – 4,105 At supply line retest
🥈 Extended Target 4,120 – 4,130 Breakout continuation
📌 Trade Idea (Bullish Scenario)
Entry Zone: 4,055 – 4,065 🟩
Stop Loss: Below 4,025 ❌
Take Profit 1: 4,100 🎯
Take Profit 2: 4,125 🚀
RR Ratio: 1:2.5 – 1:3 📈
🧭 Market Sentiment
📍 Bias → Short-term Bullish
🛑 But… sellers may reappear at supply line
⚠️ Watch for fakeouts near the target
GOLD (XAUUSD): FINAL SQUEEZE! TRADE ZONES READY!Timeframe: 1H | Gold is tightly consolidated between 4,040 - 4,085 (Symmetrical Triangle).
1. ⚙️ TECHNICAL ANALYSIS (TA) & ACTIONABLE ZONES
The market is coiled like a spring. We have identified specific zones for high-probability setups.
🔥 BUY ZONE (Reversal Play):
Entry: 4,044 - 4,046
Stop Loss (SL): 4,038
Strategy: This is our Strong Support confluence area. A golden opportunity for a bounce play.
⚠️ SELL Scalp (Intra-range):
Entry: 4,071 - 4,073
Stop Loss (SL): 4,077
Strategy: Near-term resistance. Quick profit booking expected here.
🚨 SELL ZONE (Strong Resistance):
Entry: 4,097 - 4,099
Stop Loss (SL): 4,107
Strategy: A major supply zone. Excellent spot to short if the initial Long move fizzles out.
⚡ MEGA BREAKOUT SCENARIO
LONG Breakout: Above 4,085 to TP: 4,110 to 4,130.
SHORT Breakout: Below 4,040 to TP: 4,020 to 4,000.
2. 📰 FUNDAMENTAL ANALYSIS (FA)
The market is waiting for Major US Data (Jobs report, PCE Inflation) and Fed sentiment. This data will be the ultimate catalyst for the breakout
Weak Data: Supports Gold (Long) due to a weaker USD.
Strong Data: Pressurizes Gold (Short) due to a stronger USD.
💡 THE GOLDEN STRATEGY
Patience is key! Do not jump the gun inside the triangle. Set strict SLs for all trades. Act only on a confirmed technical breakout backed by the Fundamental news flow.
#Gold #XAUUSD #ForexIndia #IndianTraders #TechnicalAnalysis #Intraday #BreakoutTrade #GoldAnalysis #TradingSetup

Gold (XAU/USD) 2H Chart Analysis – Sell Setup from High ProbabilBased on the chart you provided, Gold is currently reacting near a High Probability POI (supply zone) after a corrective bullish move. The structure still shows:
Lower highs and lower lows → Bearish market structure
Price is approaching a supply zone where sellers previously dominated
Liquidity has been taken above internal highs (marked as "$$$"), indicating a liquidity grab
This supports a short position idea from the supply zone.
🔍 Key Technical Levels
Zone / Level Meaning
4,125 – 4,150 USD High Probability POI / Supply (Sell area)
4,080 – 4,100 USD Entry region (price is currently here)
4,040 – 4,025 USD First reaction / partial take zone (50% area)
3,990 – 4,000 USD Main Target (previous demand + equal lows)
🎯 Suggested Target
Primary Target: $4,000
(Exactly aligning with your chart’s marked “TARGET” zone where liquidity sits)
If momentum continues and structure breaks more aggressively:
Extended Target: $3,975 – $3,960
(deeper sweep into demand)
🛑 Risk Management
Detail Level
Stop Loss Above 4,155 USD (beyond POI + liquidity)
R:R Potential Approx. 1:3 to 1:4
📌 Summary
Price has retraced into a key supply zone
Liquidity was taken → seller confirmation likely
Expectation is continuation downward towards the liquidity pool below
📊 Title Recommendation:
“Gold Retests Supply Zone – Bearish Continuation Toward $4,000 Expected”

XAUUSD/GOLD 1H BUY PROJECTION 24.11.25(XAUUSD/GOLD 1H BUY PROJECTION – 24.11.25).
🔍 What the Chart Shows
Your chart displays a buy setup on the 1-hour timeframe with the following key elements:
🟦 1. Support Zone (S1)
Price is reacting from the horizontal support zone.
This zone aligns with the 1H uptrend line, adding confluence.
Good demand area.
📉 2. Trendline Support (1H Uptrend)
The price is touching the ascending trendline, indicating continuation of the uptrend.
🔦 3. Hammer Candle Confirmation
A bullish hammer candle is highlighted (yellow box).
This indicates seller exhaustion and possible reversal to upside.
This candle gives confidence for a buy entry.
🎯 4. Entry, SL, TP
Entry: At the hammer candle close near 4043–4045 zone.
Stop Loss: Below support zone and trendline (~4020–4025 zone).
Target: Back to Resistance R2, around 4100+ zone.
Risk/Reward: 1:4 shown — good reward potential.
🟪 5. Resistance Levels
Resistance R1: Mid chart area.
Resistance R2: Strong resistance zone near 4100+.
📌 Overall Summary
Your setup is logically structured with:
Support + Trendline confluence
Hammer reversal confirmation
Clean R:R
Uptrend continuation expectation
This is a valid 1H buy setup based on price action and structure.

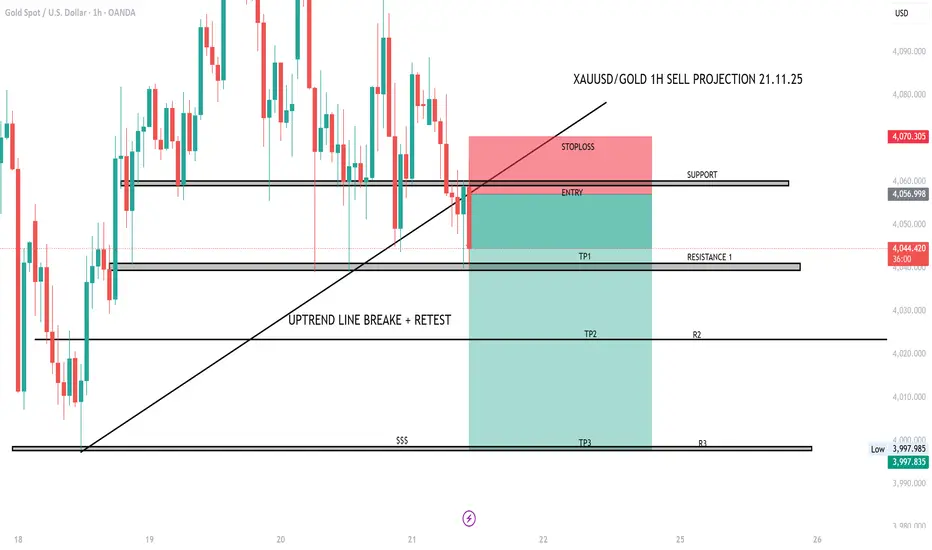
XAUUSD/GOLD 1H SELL PROJECTION 21.11.25XAUUSD / GOLD 1H SELL projection based on the chart you uploaded:
✅ Overall View
The chart shows a confirmed uptrend line break + clean retest, which is a strong bearish signal on 1H timeframe. Your setup is technically correct and follows proper structure.
📉 SELL SETUP ANALYSIS
1. Entry Zone
Your entry is placed exactly at the support → turned resistance zone after the trendline break + retest.
This is a smart location because:
Price rejected the retest
Previous support is now acting as resistance
Weak bullish candles on retest confirm sellers are active
🛑 Stop Loss
Stop loss is placed above the retest wick, which is correct.
Because:
If price moves above this, structure becomes bullish again
SL protects you from fake breakout
🎯 Targets
TP1 – Resistance 1 (Now Support Zone)
Good first target. High probability area where price may react.
TP2 – R2
This level has strong confluence:
Previous consolidation zone
Fresh liquidity area
High chance price may reach here if bearish momentum continues.
TP3 – R3 (Final Target)
This is your deep liquidity zone ($$$).
Smart money usually reaches this zone after trend reversal.
⭐ Trade Quality Rating: 9/10
Reasons:
Trendline break + retest = strong confirmation
Clean structure
Proper RR setup
Logical TP placements
SL placed safely
📌 Suggested Trade Plan
Enter only if candle closes below your entry zone again
Book partial profits at TP1
At TP1: move SL to breakeven
Let runner hit TP2 / TP3
GOLD (XAU/USD): THE BATTLE OF NFP AND FED!1️⃣ TECHNICAL VIEW (TA): Awaiting Sell Confirmation
Structure: The short-term uptrend has ended, prices are adjusting/reversing.
Main Supply Zone (Order Block - OB): Prices are retracing to the ideal sell zone (around $4,064 - $4,081).
Strategy: Prioritise seeking SELL signals at the OB zone.
Target: $3,976 and $3,931 if the OB zone holds.
2️⃣ FUNDAMENTAL VIEW (FA): Interest Rate Pressure
Selling pressure is increasing from:**
Fed Rate Cut Expectations Dwindle: The probability of a 25bps rate cut in December has fallen below 50%. The "Higher for Longer" signal reduces Gold's appeal.
Upcoming Risks: The market awaits NFP and FOMC Minutes. Strong data will bolster USD and sink Gold.
⚠️ Opposing risk: Uncertainty from the US Government shutdown and geopolitical tensions (Russia/Ukraine) may restrain the decline.
#XAUUSD #Gold #TradingSetup #SELLZone #Fed #NFP #PriceAction #SmartMoneyConcepts #Forex

GOLD (XAU/USD): 2 Crucial Orders Before the NFP Storm!📉 Technical Analysis (SMC - 2H)
Trend: Decline after a clear MSS/BOS.
Focus: Price is retracing to the Selling Zone (Premium) to fill the FVG.
⚔️ Detailed Trading Plan (R:R > 1:2)
1. Priority Strategy: SELL Limit (Trend Following)
Entry: 4,157.782 (FVG Peak - Supply Zone)
Stop Loss (SL): 4,206.895 (Safe SL above the nearest structural peak)
Take Profit 2 (TP2): 4,051.733 (Main structural target - Nearest bottom)
Objective: Participate in the ongoing price decline.
2. Counter-trend Strategy: BUY Limit (Technical Rebound)
Entry: 4,051.733 (Nearest structural bottom - Support)
Stop Loss (SL): 4,018.699 (SL below lower FVG)
Take Profit 2 (TP2): 4,126.333 (Rebound to the upper FVG bottom)
Objective: Capitalise on the technical rebound from strong support.
🚨 Basic Risk: This Week's Focus
Hawkish Fed: Officials like Schmid assert high inflation, unwilling to ease policy, maintaining high interest rates (Negative for Gold).
Major News: FOMC Minutes (Wednesday) and especially NFP (Thursday) will determine the short-term momentum of USD/Gold.
Risk Management: Gold will be highly volatile from Wednesday. Adhere to SL and manage capital under 2% per order.
#Gold #XAUUSD #Forex #TechnicalAnalysis #FVG #SmartMoney #Fed #NFP #TradingView

XAU/USD – Gold Slightly Adjusts, Monitoring Pullback to Support Hook: XAU/USD – Gold Slightly Adjusts, Monitoring Pullback to Support 4,151 USD
Body: 📊 Market Structure
After the Break of Structure (BoS) at the 4,208 USD region, gold confirms the continuation of the upward trend and is forming a technical adjustment.
The price has touched the Resistance Zone 4,208 – 4,237 USD and is currently adjusting as expected, heading towards the Support Zone 4,151 USD – which previously created an impulsive move.
Below Support 4,151, there is a strong OB at 4,104 USD.
As long as the price does not break deeply below 4,104 USD, the bullish structure remains intact.
💎 Key Technical Zones
• Resistance Zone: 4,208 – 4,237 USD → supply area + where a downward reaction occurs
• Support Zone: 4,151 USD → area awaiting upward reaction
• Strong OB + Support: 4,104 – 4,110 USD → base of the upward structure
• Liquidity Zone (Target): 4,260+ USD → next wave expansion area
🎯 Trading Plan
1️⃣ BUY Setup – Trend-following priority
If the price adjusts correctly to discount areas:
• Entry 1: 4,151 USD
• Entry 2: 4,104 USD (best area – confluence OB)
SL: below 4,090 USD
TP1: 4,208
TP2: 4,237
TP3: 4,260
→ Main strategy: wait for pullback → re-enter the upward wave → follow the strong trend.
2️⃣ SELL Scalp – Reaction at Resistance (counter-trend)
If the price retests the 4,208 – 4,237 area and creates a clear rejection:
Entry: 4,218 – 4,230
SL: 4,245
TP1: 4,180
TP2: 4,151
→ Setup only for flexible traders, short trades, no holding positions.
🧠 Vincent’s View
The current structure is very precise:
Impulsive Move → Short-term Distribution → Pullback to Support → Continue upward wave.
The 4,151 USD area is the focal point to observe.
The 4,104 USD area is the best BUY area if the market wants to hunt deeper liquidity.
As long as the price does not break 4,104 USD, buyers still hold the entire advantage.

XAUUSD/GOLD 1H SELL PROJECTION 11.11.25XAUUSD/GOLD 1H Sell Projection (11.11.25) chart.
Here’s a quick technical breakdown of what this chart represents:
🟣 Setup Overview
Pair: XAUUSD (Gold)
Timeframe: 1 Hour (H1)
Bias: Bearish (Sell Setup)
🧩 Key Levels
Resistance / High: 4148.82
Stoploss: ~4141.63
Entry Zone: ~4129.45–4128.32
Target 1 (TP1): Around 4110 (S1 + FVG zone)
Target 2 (TP2): Around 4081 (S2 zone)
📉 Projection Logic
Price rejected from major resistance at 4148.
A short-term pullback / retracement is expected into the entry zone.
After possible retest, price is expected to drop towards TP1 and TP2.
The setup suggests a Risk-Reward Ratio (RRR) of roughly 1:2.5 to 1:3, favoring the sell side.
⚙️ Trading Idea Summary
Parameter Value
Bias Sell
Entry Range 4128–4130
Stop Loss 4141
Take Profit 1 (TP1) 4110
Take Profit 2 (TP2) 4081
R:R Ratio ≈ 1:3
Confirmation Bearish engulfing or rejection from resistance zone

GOLD: US Fed is Not Giving Up! Big Selling Zone is Activated.Hello, Traders! It's a crucial time, yaar! Gold is at a major crossroads. The pressure from the US Fed is real, and it’s lining up perfectly with our key price levels. Let’s do a quick scan of the market.
I. FUNDAMENTALS: The Big Boss (The Fed) is Hawkish 📰
Main Reason for Bears: The US Fed officials are not interested in rate cuts for now. They are very much "hawkish" due to inflation concerns. This has crushed market optimism.
The Direct Impact: Higher US interest rates mean the Dollar is strong and mighty. For a non-yielding asset like Gold, this is a major negative signal.
Long-Term View (The Hope): Don't lose heart completely! Big institutions still see Gold climbing (like Morgan Stanley projecting $4,300/oz by 2026). So, current dips are good for long-term accumulation.
II. TECHNICAL ANALYSIS: The Supply-Demand Game 🎯
The H4 chart is showing a confirmed DOWNTREND. The recent small rally is just a necessary pullback to test the sellers' power before the next big drop.
1. Primary Strategy: GO SHORT (Following the Main Trend)
The Hot Selling Zone: $4,059 to $4,085. This is our Supply Area where the institutional players are likely waiting. This level is key.
Action Plan: Wait for Gold to enter $4,059 - $4,085. Look for a solid rejection (a strong reversal candle) to confirm your SHORT entry.
Final Target (TP): Our main target is the Strong Demand Zone at $3,939 - $3,952.
2. Counter-Trend Strategy: The Bounce Level
Crucial Buying Zone: $3,939 - $3,952. This is a major support level.
Action Plan: If the price really drops here, you can watch for a quick long entry for a bounce, but maintain tight stop-loss.
🔑 Final Verdict
Best Bet: We must look for a SELL near the $4,059 - $4,085 Supply Zone. Everything is lining up for a continued downside move. Risk management is paramount, okay?
What's your plan for Gold? Will the market respect the $4,085 level? Tell me in the comments! 👇
#XAUUSD #GOLD #FED #TechnicalAnalysis #ForexTrading #SupplyAndDemand #Bearish #TradingStrategy #IndianTrader #MarketAnalysis

XAUUSD/GOLD 4H WEEKLY BUY PROJECTION 02.11.25XAUUSD (Gold) 4H Weekly Buy Projection for 02.11.25.
Here’s a breakdown of what your chart indicates:
🧭 Technical Overview:
Pattern Forming: Symmetrical Triangle inside a larger Parallel Downtrend Channel.
Key Confirmation: “W” pattern confirmation with 0.618 Fibonacci retracement zone, indicating strong potential reversal.
Current Price Zone: Around 4002, consolidating near triangle resistance.
🔍 Key Levels:
Support S1: ~3960
Support S2: ~3920
Resistance R1: ~4040
Resistance R2: ~4080
Resistance R3: ~4160
📈 Projection Summary:
If Price Breaks Triangle Upward:
→ Strong bullish momentum expected toward R1–R3 zones.
→ “Huge buy expected” once breakout candle closes above the upper trendline with volume.
Invalidation:
→ If price breaks below 3960, the bullish setup weakens.
→ Below 3920, trend may retest the lower parallel channel zone.
💡 Trading Plan (Based on Chart Logic):
Buy Entry: Above 4040 confirmation breakout
Target 1: 4080
Target 2: 4160
