“Gold Price Action: Bullish Momentum with Key Correction ZonesAnalysis of XAU/USD (Gold Spot)
The chart shows a clear uptrend channel, supported by higher highs and higher lows.
Price recently pulled back after testing the $3,915 zone, which is acting as a short-term resistance.
Multiple support zones are highlighted (around $3,760 and $3,700), which can provide strong buying opportunities on retracement.
The structure suggests impulse–correction–impulse movement, aligning with bullish continuation patterns.
Bullish Scenario
If price holds above the $3,760–$3,780 support, continuation towards $3,915 (previous high) is expected.
A breakout above $3,915–$3,920 will open the door for further upside, targeting $3,960–$3,980.
Bearish Scenario
If price breaks below the trendline support (~$3,760), deeper correction is possible toward $3,680–$3,640 (TP1 zone).
That zone is mentioned on the chart as a strong re-entry point for long positions.
✅ Suitable Target (Bullish):
Immediate Target: $3,915 (previous high)
Extended Target: $3,960 – $3,980
⚠️ Correction Target (Bearish Pullback):
$3,680 – $3,640 (strong buy zone for re-entry)
Xauusdsetup

Gold Hits $394x! New ATH: Fed & BoJ Drive the Rally.Hello, traders!
Gold (XAU/USD) has just delivered a massive breakthrough in the Asian session, setting a New ATH around $394x after comfortably breaching that $3900 level. This strength, bhai, is getting serious support from two big monetary policy moves: Fed rate cut expectations and the likelihood of the BoJ (Bank of Japan) delaying rate hikes due to the new PM. Paisa hi paisa!
Fundamentals & Technical Caution: Mind the FOMO
Dual Drivers: Market sentiment is clear—the Fed is expected to cut rates two more times, and the dovish BoJ outlook only adds more fuel, creating a rock-solid foundation for Gold.
Safe-Haven: The continuous US Shutdown drama and geopolitical tensions are keeping that safe-haven bid strong.
FOMO Warning: The momentum is fierce, but you must avoid buying the high. Prioritize Buying on pullbacks to FVG (Fair Value Gaps) to secure a safer entry point. Discipline is key, boss.
Key Price Levels:
Resistance: $3954, $3963
Support: $3910, $3895, $3883, $3870
Trading Strategy (Absolute Risk Management):
BUY SCALP: $3910 - $3908
SL: $3904
TPs: $3918, $3928, $3938, $3948, $3958
BUY ZONE (FVG): $3895 - $3893
SL: $3885
TPs: $3903, $3913, $3923, $3933, $3943
SELL ZONE (High Risk): $3964 - $3966
SL: $3974
TPs: $3956, $3946, $3936, $3926, $3916
Are you placing your bets on a $4000 target this week? Let me know your plan! 👇
#Gold #XAUUSD #ATH #Fed #BoJ #Shutdown #TradingView #MarketAnalysis #GoldFever

New ATH: Shutdown Fuels Gold's Seventh Straight WinHello, traders!
Gold just sealed its seventh consecutive weekly gain, boss, with futures hitting a whopping $3,908.9/oz. This rally is powered by growing tension over the US Government Shutdown and the solid expectation of a Fed rate cut (97% chance in October, no less!).
Fundamentals & Outlook: Pure Safe-Haven Rally
Political Instability: The prolonged Shutdown is a proper bullish driver now. It's delaying key economic reports, creating huge uncertainty, and attracting big safe-haven capital flows.
Rate Cut Certainty: The market is absolutely banking on a Fed rate cut, giving massive support to non-yielding Gold.
Technicals & Trading Strategy: Focus on $3867
The weekly buying power is super strong. Gold is holding steady near the $3900 mark. The $3867 level is our critical line, bhai; if the price stays above it, the potential for new ATHs remains very high.
Key Price Levels:
Resistance: $3902, $3912, $3922, $3942
Support: $3867, $3855, $3839, $3792
Trading Strategy (Absolute Risk Management):
BUY ZONE 1: $3867 - $3865
SL: $3857
TPs: $3875, $3885, $3895, $3905, $3915
BUY ZONE 2: $3839 - $3827
SL: $3824
TPs: $3847, $3857, $3867, $3877, $3887
SELL ZONE 1: $3902 - $3904
SL: $3912
TPs: $3894, $3884, $3874, $3864
SELL ZONE 2: $3942 - $3944
SL: $3952
TPs: $3934, $3924, $3914, $3904
What's your view? Will the US political drama help Gold finally break past $3900 next week? Tell me below! 👇
#Gold #XAUUSD #ATH #Shutdown #Fed #TradingView #MarketAnalysis #GoldRush

XAUUSD/Gold Weekly Buy Projection (05.10.25) chartXAUUSD/Gold Weekly Buy Projection (05.10.25) chart.
Here’s a clear technical summary of what your chart shows:
🔹 Overall Structure
The chart projects a bullish move for XAUUSD (Gold).
Title: Weekly Buy Projection – 05 Oct 2025
Main trend: Ascending continuation pattern (marked by blue upward trendlines).
Current price zone: around $3,886.45.
🔹 Key Levels
Support S2: around $3,838 – $3,846
Support S1: around $3,870 – $3,878
Resistance 1: around $3,900 – $3,910
Resistance 2 (New ATH): around $3,939 – $3,970
🔹 Pattern & Projections
Golden Ratio (0.618 Fibonacci) formed near $3,874, signaling a retracement support.
Bullish engulfing candle noted at Support S1, confirming buying interest.
Possible Double Top highlighted near Resistance 1, indicating a short-term pullback risk before continuation.
Fair Value Gap (FVG) exists between $3,875–$3,890, suggesting potential liquidity refill before next le

XAUUSD/GOLD WEEKLY BUY PROJECTION 28.09.25XAUUSD/Gold Weekly Buy Projection (27.09.25). Here’s a breakdown of what it shows:
Current Price Level: Around 3,759.85.
Technical Zones Marked:
Broke the Uptrend Line (earlier support turned resistance).
Bearish Engulfing Failed (bullish strength seen).
Fair Value Gap (FVG) near 3,740–3,750 zone, acting as a demand zone.
Projection Path:
Price expected to bounce from the FVG/demand area.
Then follow an upward zigzag movement toward the target zone around 3,860.
Trend Channel:
Multiple parallel blue channels drawn indicate a bullish structure.
Projection suggests continuation of the uptrend.
Target Price:
Marked close to 3,860, aligning with the upper channel line.
🔑 Summary of Projection:
Bias: Bullish
Entry Zone: 3,740–3,760 (Fair Value Gap zone)
Target Zone: 3,860
Risk Area: If price breaks below 3,720, projection may fail.
👉 Do you want me to prepare a trading plan (entry, SL, TP, and risk %) based on this projection for you?

XAUUSD SHOWING A GOOD DOWN MOVE WITH 1:10 RISK REWARDXAUUSD SHOWING A GOOD DOWN MOVE WITH 1:10 RISK REWARD DUE TO THESE REASON
A. its following a rectangle pattern that stocked the marketwhich preventing the market to move any one direction now it trying to break the strong resistant lable
B. after the break of this rectangle it will boost the market potential for breakC. also its resisting from a strong neckline the neckline also got weeker ald the price is ready to break in the outer region
all of these reason are indicating the same thing its ready for breakout BREAKOUT trading are follws good risk reward
please dont use more than one percentage of your capitalfollow risk reward and tradeing rules that will help you to to become a bettertrader
thank you

XAUUSD/GOLD Unemployment Claims 18.09.25XAUUSD/Gold – Unemployment Claims (18.09.25):
Current Price Zone: Gold is trading around $3,668.81.
Trading Idea: The chart suggests a buying opportunity if the U.S. unemployment claims data comes out negative (worse than expected).
Key Levels:
Major Resistance R1 → Around $3,685 – $3,690
Breakout and retest of this level signals a buy entry.
Resistance 2 – Yesterday’s High & News High → Around $3,710
Acts as the next upside target after breakout.
Resistance 3 – Expected New ATH → Around $3,736 – $3,740
This is the final bullish target if momentum sustains.
Strategy:
Plan A (Main Setup):
Wait for breakout above R1 (3,690) → Enter buy trade on retest.
Ride the move towards R2 (3,710) and possibly R3 (3,736–3,740).
Confirmation Zone:
If news is negative for USD, gold is expected to rally strongly (bullish bias).
Risk Management:
Stop Loss (SL): Below 3,680 zone, as marked in the red area.
Take Profit (TP): Stepwise at 3,710 → 3,736 → 3,740.
👉 In summary: The chart indicates a news-driven bullish breakout plan — gold buys are favored if the data weakens the USD, with targets up to 3,740.

XAUUSD/GOLD 1H BUY PROJECTION – 18.09.25The 1-hour chart of Gold shows a recent V pattern formation, signaling a strong bullish reversal after a sharp drop.
A downtrend breakout is confirmed, supported by a Three White Soldiers pattern, strengthening the bullish momentum.
Entry Zone: Around 3,668 (current price).
Support (S1): 3,655 – strong demand zone where buyers are likely to defend.
Resistance (R1): 3,685 – key target level for this bullish move.
Risk-to-Reward Setup: Stop-loss below support (S1) at 3,655, with take-profit at resistance (R1) near 3,685.
🔑 Conclusion: Gold (XAUUSD) is showing bullish signs with breakout confirmation. As long as price holds above support at 3,655, the projection favors upside movement towards 3,685.

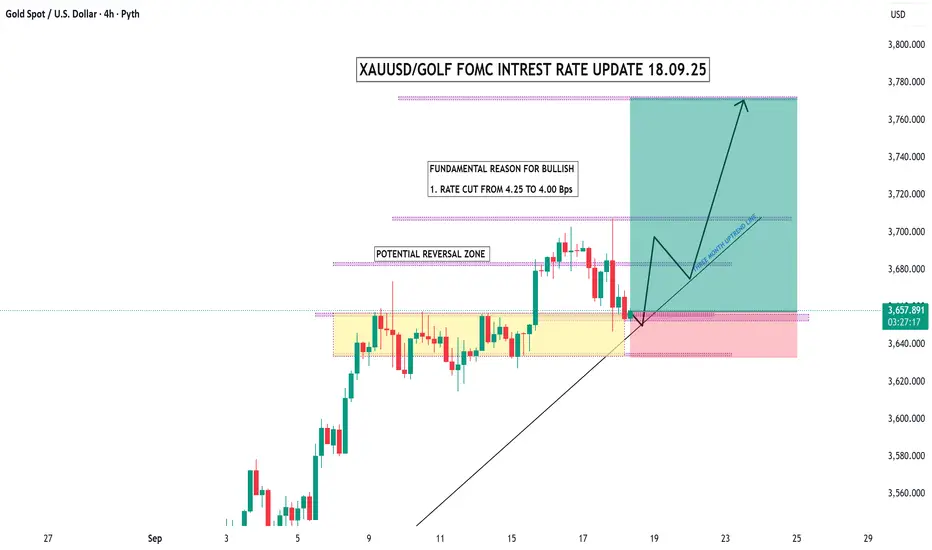
XAUUSD / Gold FOMC Interest Rate Update – 18.09.25Fundamental Reason for Bullish:
The Federal Reserve cut rates from 4.25% → 4.00%.
This supports gold’s bullish momentum since lower rates reduce the opportunity cost of holding gold.
Technical Structure:
Potential Reversal Zone: Highlighted in yellow. Price is currently testing this area around 3645–3655.
A bounce from this zone aligns with the 3-month uptrend line (black trendline).
If price respects this support, bullish continuation is expected.
Bullish Projection Path:
First, a rebound from the reversal zone.
Then, a push towards 3700–3720 with a possible retest.
Final Target Price Zone: ~3750–3780.
Risk Area (Stop Loss Zone):
If price breaks below the reversal zone and trendline (~3640–3635), bullish outlook weakens and downside risk opens.
🎯 Summary
Bias: Bullish (Fundamental + Technical confluence).
Reason: Rate cut + uptrend line support.
Targets: 3700 → 3750 → 3780.
Invalidation: Break below 3640.
Gold (XAUUSD) FOMC Forecast – 17 Sept 2025Gold (XAUUSD) FOMC Forecast – 17 Sept 2025
Current Price: ~3666
Key Levels Identified:
Resistance R1: ~3700
Trendline Resistance R2: ~3780
Support S1: ~3623
Support S2: ~3540
📰 News Impact Projection:
If the Federal Reserve Cuts the Funds Rate
Expect bullish momentum.
Strategy: Buy after a retest above Resistance R1 (~3700).
Target: Trendline Resistance R2 → ~3780.
If the Federal Reserve Increases the Funds Rate
Expect bearish momentum.
Strategy: Sell after a retest below Support S1 (~3623).
Target: Support S2 → ~3540.
⚠️ Stop Loss (SL):
Around 3658, near current consolidation zone.
🎯 Summary
Bullish case (Rate Cut): Buy above 3700 → Target 3780.
Bearish case (Rate Hike): Sell below 3623 → Target 3540.
Market direction will strongly depend on FOMC Funds Rate decision.

“Gold Shines Bright | Bullish Momentum Targeting $3,700🔎 Technical Analysis – XAU/USD (1H Chart)
Trend: Strong bullish trend confirmed, with price making higher highs and higher lows.
Buy Zone: Around 3,590 – 3,600 USD, where buyers stepped in aggressively.
Short-Term Target 🎯: 3,650 – 3,700 USD (already highlighted on chart).
Key Support Levels:
3,561 USD (near-term support)
3,490 USD (major support, bullish structure invalidation if broken)
📌 Outlook: As long as price holds above the buy zone, momentum favors bulls with potential continuation toward 3,700+ USD.
🌍 Fundamental Drivers for Gold Bullishness ✨
Federal Reserve Rate Cuts Expectations 🏦⬇️ – If the Fed signals easing or holds a dovish stance, real yields fall → Gold strengthens.
Weakening US Dollar (DXY) 💵📉 – A softer dollar makes gold more attractive to global investors.
Geopolitical Risks 🌍⚠️ – Rising global tensions increase demand for safe-haven assets like gold.
Central Bank Demand 🏦🔒 – Many central banks are adding gold reserves to hedge against currency risks.
Inflation Hedge 📊🔥 – Gold remains attractive when inflationary pressures stay elevated.

Gold Facing Strong Resistance – Bearish Move Towards Support ?Analysis:
Resistance Zone: Price is struggling to break above the $3,645–$3,650 area, which has acted as a strong resistance multiple times.
Support Levels: Immediate support lies around $3,620 and $3,614, with the major support zone at $3,580.
Price Action: Repeated rejections from resistance indicate weakening bullish momentum. Sellers are gaining control near the resistance zone.
Bearish Outlook: A potential downward move is projected, with price likely to test $3,580 support if resistance continues to hold.
Risk Management: A break and close above $3,650 would invalidate the bearish scenario and could trigger a bullish continuation.
✅ Bias: Bearish below $3,650
🎯 Targets: $3,620 → $3,614 → $3,580
🛑 Invalidation: Above $3,650

XAUUSD/GOLD 1H BUY PROJECTION 16.09.25XAUUSD/Gold 1H Buy Projection (16.09.25). Here’s a breakdown of the key points from your analysis:
🔹 Chart Analysis
Support & Resistance
Support S1: Around 3678 zone.
Minor Resistance Breaked: Price broke above the 3680 resistance area.
Resistance R1 (ATH): Around 3692 – 3696 area.
Entry & Stoploss
Current price: 3683.63
Stoploss: Below 3676 level.
Risk Zone (Red Area): Price should not break below this zone for the buy setup to remain valid.
Target Levels
Target Price 1: ~3688
Target Price 2: ~3692–3696
Indicators
Stochastic Oscillator (top indicator):
Showing a bullish crossover (green line crossing above red), suggesting upward momentum.
RSI (bottom indicator):
Turning upward from 64.47, showing renewed buying pressure.
🔹 Projection
The setup is bullish with expected upward movement from 3683 → 3692 → 3696+.
The chart suggests a possible pullback and continuation before reaching higher targets.
As long as 3680 support holds, momentum favors the upside.

XAUUSD/GOLD 1H SELL PROJECTION 15.09.25XAUUSD/Gold 1H Sell Projection (15.09.25). Here’s a structured breakdown of what the chart indicates:
🔎 Chart Analysis
Entry Zone: Around 3646 – 3647 (confluence of trendline + 0.618 Fibonacci retracement = "Golden Ratio").
Stop Loss: Around 3653.16 (above trendline & key resistance).
Take Profit Targets:
TP1 (Support S1): Around 3639 – 3640
TP2 (Support S2): Around 3630 – 3631
🧭 Trade Idea (Sell Bias)
Reasoning:
Price has rejected the descending trendline resistance.
Confluence with Fibonacci 0.618 retracement level (3647).
Bearish projection towards support zones.
📌 Summary
Setup: Short/Sell
Entry Zone: 3646 – 3647
Stop Loss: 3653
Target 1: 3640
Target 2: 3630

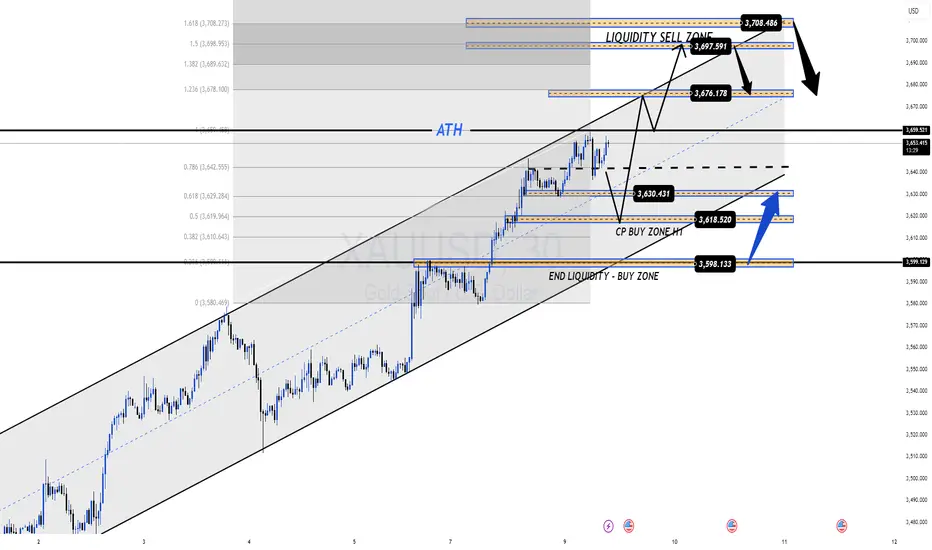
XAUUSD – Breakout Confirmed & Macro Outlook📊 Market Context & Macro View
Gold (XAUUSD) has broken out above its short-term descending trendline, signalling renewed bullish momentum after several sessions of consolidation. This breakout aligns with traders pricing in slower US inflation and growing confidence that the Federal Reserve may pause or ease monetary policy in the coming months.
🔹 Macro Drivers Supporting Gold:
Soft US CPI & PPI → Cooling inflation strengthens expectations for stable or lower rates.
Steady Treasury yields and a weaker USD continue to fuel gold’s upside.
Geopolitical tensions and central bank accumulation remain long-term bullish factors.
⚠ Risk: Liquidity sweeps remain possible before the Fed meeting—watch for fakeouts or sharp reversals.
🔑 Key Technical Levels (H1)
Immediate Resistance: 3,654.17 (React Zone FIB)
OBS Sell Zone: 3,664.52
Upper Liquidity Target: 3,679.31
Major Sell Liquidity: 3,709.85
Supports / Buy Liquidity Zones:
• 3,637.91 – Breakout Retest
• 3,631.63 – CP Support
• 3,622.41 – Deeper Liquidity Layer
• 3,584.78 – END Liquidity BUY ZONE
📈 Scenario & Outlook
London Session: Possible retest at 3,638–3,632 for liquidity collection before the next leg higher.
A clean break through 3,654 → 3,664 could spark strong buying toward 3,679–3,709.
Losing 3,622 would expose 3,584 as the next major support.
📌 Trading Plan
🔵 BUY ZONE 1: 3,635 – 3,633
SL: 3,629
TP: 3,640 → 3,645 → 3,650 → 3,660 → 3,670 → ???
🔵 BUY ZONE 2: 3,621 – 3,619
SL: 3,615
TP: 3,625 → 3,630 → 3,635 → 3,640 → 3,650 → 3,660 → ???
🔴 SELL ZONE: 3,708 – 3,710
SL: 3,715
TP: 3,704 → 3,700 → 3,695 → 3,690 → 3,680 → ???
🔴 SELL SCALP: 3,679 – 3,681
SL: 3,685
TP: 3,675 → 3,670 → 3,665 → 3,660 → ???
✅ Summary
Gold is maintaining its breakout, supported by softer US inflation and a weaker USD. While liquidity sweeps may occur, the overall trend remains bullish above 3,622.
👉 Follow MMFLOW TRADING for real-time updates, liquidity plays, and BIGWIN setups as gold reacts to key macro drivers and price zones.

XAUUSD – Intraday Plan: Bullish Trend + Key Liquidity ZonesMarket Pulse:
The US jobs data (05/09) showed a slowdown in hiring. According to CME FedWatch, there is an 88% chance of a 0.25% Fed rate cut in September, and 12% for a 0.5% cut. Lower rates support gold as a non-yielding asset.
Gold has already gained 38% YTD, after rising 27% in 2024. A weaker USD, central bank buying (China added gold for the 10th month in a row in August), loose monetary policy, and global risks keep gold in a strong bullish trend.
👉 Market bias: Macro + liquidity flows favour BUY.
Technical View (M30):
Price stays in an up channel, making higher lows.
3616–3596 is the key support zone.
Liquidity SELL zones at 3653–3655 and 3675–3677 may give short intraday pullbacks before trend continues.
Execution Plan (Today):
🔵 BUY ZONE #1: 3618 – 3616
SL: 3610
TP: 3624 → 3630 → 3635 → 3640 → 3650 → 3660 → 3670+
🔵 BUY ZONE #2: 3598 – 3596
SL: 3590
TP: 3602 → 3606 → 3610 → 3615 → 3620 → 3630 → 3640 → 3650+
🔴 SELL ZONE #1: 3653 – 3655
SL: 3660
TP: 3648 → 3644 → 3640 → 3635 → 3630 → 3620
🔴 SELL ZONE #2: 3675 – 3677
SL: 3681
TP: 3670 → 3665 → 3660 → 3650 → 3640
Summary:
✅ Gold trend stays bullish – best setups are buying dips into liquidity zones.
⚡ Intraday scalps possible at SELL liquidity zones.
👉 Follow MMFLOW TRADING for daily precision setups.
XAUUSD/Gold 1H Buy Projection – 08.09.25🔎 Chart Analysis
Price Action
Current price: 3588.15
Support Zone (S1): Around 3575 – 3578
Resistance Zones:
R1 ≈ 3590
R2 ≈ 3600+
Projection shows a possible bounce from support → break R1 → move toward R2.
Indicators
Stochastic (5,3,3):
Current: %K 21.78, %D 31.90
Oversold region → “Tends to Buy” signal.
RSI (14):
Value: 58.55 (above 50)
Suggests short-term uptrend momentum.
Overall Projection
Market bias: Bullish (Buy Setup)
If price respects support at S1, probability is high for upside movement towards R1 → R2.
Risk: If support S1 breaks, downtrend continuation is possible.
✅ Summary (08.09.25):
Buy Bias on 1H timeframe.
Support: 3575 zone
Target 1: 3590 (R1)
Target 2: 3600 (R2)
Indicators confirm bullish momentum (RSI > 50, Stoch oversold).

XAU/USD Bullish Setup – OB Zone to $3,590 TargetChart Overview (XAU/USD – 30m):
Current price: $3,534
Price is in a strong bullish channel (higher highs & higher lows).
Market forming an ATH (All-Time High) and consolidating.
📌 Strategies Applied:
1. Trendline Strategy:
Price respecting support & rejection lines inside ascending channel.
Trend remains bullish as long as price holds above support.
2. Order Block (OB) Zone:
Identified buying zone at $3,501 – $3,514.
Strong support + liquidity area → possible rebound point.
3. Moving Averages (EMA):
EMA 70 (3,508) and EMA 200 (3,464) both acting as dynamic support.
EMA alignment confirms bullish momentum.
4. Risk–Reward Setup:
Entry near OB Zone: $3,501 – $3,514
Stop-loss: below $3,500
Target: $3,590 (R:R ~ 1:3).
✅ Summary:
Gold is in a strong bullish trend 🚀. The OB Buying Zone aligns with EMA support, offering a low-risk long entry. As long as $3,500 holds, price likely pushes towards the target zone $3,589 – $3,590.

XAU/USD Bullish Setup – Buy from POI Zone Towards 3545 TargetXAU/USD (15M Chart) Analysis
Trend Analysis:
Price is in a clear uptrend, supported by higher highs and higher lows above the EMA 70 & EMA 200. Both EMAs are pointing upward, confirming bullish momentum.
POI & FVG Zone:
A POI/FVG buying zone (highlighted in pink) is marked between 3481 – 3491, acting as a strong demand area for re-entry if price retraces.
Chart Pattern:
Price has broken out of a rising wedge formation and is retesting the breakout zone, showing potential continuation to the upside.
Support & Resistance:
Support: 3481 – 3491 zone (FVG & EMA confluence).
Resistance/Target: 3545.608 (major target point).
Entry & Risk Management:
Entry: Buy near 3491 or 3481 (within POI/FVG zone).
Stop Loss: Below 3480 (to protect against false break).
Target: 3545 (approx. +55 points).
Strategy Confirmation:
Trend-following: Bullish continuation above EMAs.
FVG/POI: Perfect re-entry buying zone.
Breakout strategy: Price broke wedge → retest → continuation expected.
Risk-Reward Ratio: Around 1:4, favorable trade setup.
✅ Summary:
XAU/USD remains bullish above EMAs. Ideal trade is to buy the dip at 3481–3491 zone with a target at 3545 and stop loss below 3480. Multiple strategies align for upside continuation.

Gold's Bullish Run Meets Resistance – Time to Fade the Rally?Gold (XAUUSD) surged strongly after Friday’s event-driven move, but the momentum now appears to be stalling. Price is consolidating in a defined range, and we’re watching a key resistance zone between 3475 – 3488, where fresh sellers may step in to challenge the bulls.
🔻 Short Trade Setup – Fading the Strength
Entry: Sell at 3475
Add on Strength: 3485
Targets: See chart for marked zones
Invalidation: Daily close above 3495
📉 Risk-Reward Outlook
This setup presents a favorable risk-reward ratio, especially for short-term traders aiming to capitalize on a potential rejection at resistance. As always, keep your risk tight and position sizing disciplined.
Gold has had its run — now the odds may favor the contrarian. Keep an eye on momentum and price action at the resistance zone.
👍 If this idea aligns with your view, give it a like and drop your thoughts in the comments — let’s exchange ideas and insights!
🔔 Follow us for more actionable trade setups.
Happy Trading,
– The InvestPro Team

Technical analysis projection for XAU/USD 25.08.25Chart Overview
Type: Daily candlestick chart of XAU/USD.
Current Price: Around 3,369 USD/oz.
Bias: Bullish (Buy projection).
📊 Key Technical Highlights
Trendline & Pattern
A major ascending triangle pattern is visible.
Price is respecting a major upward trendline (Day Uptrend Line).
Recently, a Double Bullish Engulfing candle formed near the trendline support – a strong bullish reversal signal.
Support & Resistance Levels
Support S1: Around 3,360 – 3,370 (close to current price).
Support S2: Around 3,330 – 3,340 (stronger downside support).
Resistance R1: Around 3,410 – 3,420.
Resistance R2: Around 3,450 – 3,460.
A Flat Resistance Zone exists between 3,400 – 3,420.
Bullish Signals
Bullish Momentum Formed: Price has bounced from support, forming upward momentum.
Major Trendline Obeyed: Price tested the uptrend line and respected it, confirming bullish structure.
Double Bullish Engulfing Pattern: Reinforces buying strength.
🟢 Projection Path (Bullish Scenario)
From the current price (3,369):
Expect a move toward Support S1 confirmation.
Break above Flat Resistance Zone (3,400 – 3,420).
Target Resistance R2 at 3,450 – 3,460.
🔴 Risk (Bearish Scenario)
If price fails to hold Support S1, it may retest Support S2 (~3,340).
A break below 3,330 would invalidate this bullish outlook and may push gold further down.
✅ Summary:
This chart shows a bullish projection for gold with price expected to rise from the current level 3,369 → 3,450, supported by an ascending triangle pattern, bullish engulfing signals, and strong trendline support.

XAU/USD – Bullish Breakout: Buy Dips Toward $3,409 Target📊 XAU/USD (Gold) – 2H Analysis
Gold has just broken out of its descending channel, showing a clear change of character (CHOH) around the $3,348–$3,358 support zone. This breakout suggests bullish momentum is taking control after weeks of compression.
Key Observations:
✅ Support Zone: $3,348–$3,358 is now a strong demand zone (previous rejection area flipped to support).
✅ Moving Averages: Price is above both the EMA 70 ($3,342) and EMA 200 ($3,346), strengthening the bullish bias.
✅ Projection: A potential continuation rally toward $3,409 (major liquidity target).
⚠️ Risk: If the support zone fails, price could re-test $3,334 or even $3,326.
Trading Plan (Short-Term):
Entry (Buy): Around $3,358–$3,348 (support retest).
Stop Loss: Below $3,342 (under EMAs).
Target 1: $3,390
Target 2: $3,409
👉 In summary: Gold is in a bullish reversal phase, and buying dips into the support zone offers the best risk-reward setup.

Gold (XAUUSD) – Key Support Zone in Play: 3330–3315Gold is currently approaching a critical support zone at 3325–3315, where buying interest is expected to build. A confirmed bounce from this area could trigger a potential bullish reversal and a move toward higher targets.
🔻 Trade Setup
Entry: Buy at 3327 | Add on dips near 3310
Targets: Refer to marked zones on the chart
Invalidation: Setup invalid if price closes below 3304
📌 Risk-Reward Outlook:
Tight downside risk with strong upside potential. Stick to your risk management rules and adjust your position size accordingly.
👍 If this setup resonates with you, give it a like and share your thoughts below. Let’s grow and win together!
Happy Trading,
– The InvestPro Team
