SKY ROCKET XAUUSD/GOLD BUY PROJECTION 21.01.26rend = Strong Bullish
Price uptrend channel la travel pannudhu ✅
Bullish momentum candle confirm pannudhu ✅
Break + retest idea perfect ✅
Fair Value Gap (FVG) zone la re-entry buy chance iruku ✅
📌 Trade Plan (Based on your chart)
🟦 BUY AREA (Entry Zones)
✅ Zone 1 (Best Entry):
📍 FVG + retest area around 4720 – 4680
✅ Zone 2 (Aggressive Entry):
📍 Breakout retest near 4750 – 4720
🛑 STOPLOSS (Chart la marked)
📍 Below structure support / zone
✅ Stoploss: 4660 – 4640
🎯 Targets (As per Projection)
🎯 Target 1: ~4850 (Target Price 1)
🎯 Target 2: ~5000 (Target Price 2 / Major resistance + Fib retracement)
📌 Confirmation Checklist (Signal)
Buy confirm panna:
✅ Retest candle + rejection wick
✅ Bullish close above retest zone
✅ Trendline hold
Xauusdtrade

XAUUSD/GOLD 1H SELL LIMIT PROJECTION 19.01.26✅ XAUUSD / GOLD (1H) – SELL LIMIT PROJECTION (19.01.26)
Gold is currently respecting the 1H downtrend line, and price is moving in a bearish structure. Even though we saw a bullish engulfing reaction from demand, this move is likely a pullback before bearish continuation.
📌 Key Levels
🔴 Supply / Resistance Zone: 4615.608
This level is acting as a premium zone + resistance area.
⚫ Key Mid Support/Resistance: 4585.679
Important reaction level. Price must reclaim & hold above this for further upside push.
🔵 Demand / Support Zone: 4576 – 4578
Strong demand region where buyers previously entered and formed engulfing.
📍 Current Market Price: 4596.320
📉 Trade Idea (Sell Limit Setup)
✅ Sell Limit Entry: 4610 – 4615 (inside supply + trendline confluence)
🛑 Stoploss: 4628 – 4630 (above supply highs)
🎯 Targets:
TP1: 4585.679
TP2: 4576 – 4578 (Demand zone)
📊 Risk-Reward: 1:2
🧠 Setup Logic
✔ 1H trendline still bearish
✔ Entry at premium / supply zone (4615.608)
✔ Target into support/demand zone (4576 – 4578)
✔ High probability continuation after pullback
⚠️ Confirmation: Watch for bearish rejection / wick near 4615 zone

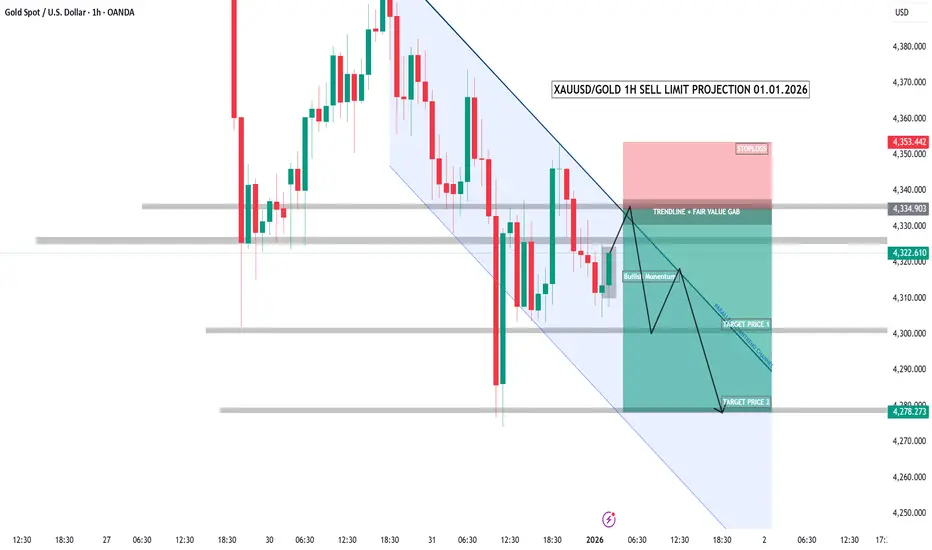
XAUUSD/GOLD 1H SELL LIMIT PROJECTION 01.01.26This is XAUUSD – Gold – on the 1-hour timeframe.
The market is clearly in a downtrend,
forming lower highs and lower lows.
Price is currently in a pullback phase within the trend.
This pullback is moving into a strong confluence zone —
the descending trendline combined with a fair value gap.
This area acts as a high-probability sell zone.
Sell limit area:
4330 to 4340.
Here, we expect a short-term bullish move to trap buyers,
followed by a strong rejection and continuation to the downside.
Stop loss:
4353 — a clear invalidation of the setup.
Target one:
4300 — a short-term support level.
Target two:
4278 — a strong demand zone and trend continuation target.
This is a pullback sell strategy.
Trade with the trend, not against it.
No emotions.
No overtrading.
Only structure, discipline, and patience.
Will gold stay sideways before the rate announcement?WILL GOLD CONTINUE TO SIDEWAY BEFORE INTEREST RATE ANNOUNCEMENT? WHAT DO YOU THINK
2 projected scenarios THIS WEEK.
Scenario 1 – Gold moves sideways below 4,200 until close to FOMC
If the price stubbornly stays below 4,200, unable to break through → when FOMC erupts, there's a high chance gold will break through 4,200.
Target falls to: 4,000 – 4,050 → this is the beautiful zone to Buy swing
The nearest zone 409x might have a reaction, pay attention (this zone is for today before fedfundrate)
Scenario 2 – Early week gold strengthens back to 4,200
If early in the week gold recovers well, touching 4,200 → FOMC at this time will become a push to propel gold back up.
Near target: 4,360, returning to test the previous peak.
THE MOST IMPORTANT FACTOR: FED'S TONE.
A 0.25% reduction is almost certain.
But the story lies in what Powell will say.
If Powell is HAWKISH like:
“Only reducing this time, economy is strong, not considering QE yet…”
→ This is strong bad news for gold and the entire asset market.
Gold drops, coins drop, stocks drop...
If the FED softens a bit:
Just a little dovish → gold will bounce extremely fast, no time to react.
In summary for this week
Gold is compressing very strongly around 4,200
FOMC will decide the direction
Major volatility will definitely appear
Just wait for the price to react before taking action — follow the strategy, follow the discipline.
Trade well, everyone.

what do you think about today's gold price?Hello Traders, what do you think about today's gold price?
Today the market will have news related to Unemployment Benefits, so I expect the trading range to be slightly narrow and liquidity relatively low. Please be more cautious in placing orders and managing capital.
Below are the important support – resistance zones I am monitoring today:
🔵 BUY ZONE (Support)
4180 – 4184
4160 – 4165
4150 – 4155
4130 – 4133
➡️ These are strong support zones – prioritize watching for Buy in the Sideway range.
🔴 SELL ZONE (Resistance)
4240 – 4244
4250 – 4255
➡️ These are the upper resistance zones – suitable for watching for Sell when the price rebounds to the range.
👀 NEAREST OBSERVATION ZONE
4217 – 4220
➡️ This is the directional zone, observe price reactions to determine continuation or adjustment forces.
🎯 Trading orientation for the day
Personal style: SL10 price – TP10 price.
Trade within the Sideway range, Buy low – Sell high.
Break any zone, trade that zone, avoid holding orders against the trend.
Low liquidity → trade lightly & manage capital tightly.
⚠️ Note: This is a personal trading plan, not investment advice. Please consider it as reference material.
Wishing you a successful trading day – enter and win! 💹✨

Gold (XAU): Fed Cut Incoming? Breakout Time!I. 📰 FUNDAMENTAL ANALYSIS (FA)
The Vibe: The US Dollar (DXY) is facing serious heat! The US Fed's recent dovish signals are a major tailwind for non-yielding Gold.
Fed's New Tune: Big guns like Governors Williams and Waller are now talking about rate cuts soon. Why? Because US economic data (Retail Sales, Consumer Confidence) is getting weaker, boss.
Market Buzz: The market is pricing in a strong nearly 85% probability of a 25bps rate cut in December. Picture clear, right?
Takeaway: This shift is Massively Bullish for Gold because lower interest rates make the Dollar less attractive.
II. 📈 TECHNICAL ANALYSIS (TA)
The Scene: Gold is currently bumping heads with a major hurdle – the Discount Zone (our supply zone). The real action is here!
Crucial Resistance: Gold is testing the Discount Zone (the main resistance area). This is the make-or-break level.
The Short Game (Bearish): Wait for a clear rejection signal at this resistance zone. If it holds, a correction is coming.
The Long Game (Bullish): For Gold to go on a proper rally, it needs a Strong Breakout and Close above the entire resistance area.
💡 THE STRATEGY
Focus on the Resistance Level: Trade based on Confirmation, whether that's a reversal signal for a short correction, or a strong breakout for a fresh long position.
Don't miss the US data tonight (Durable Goods/Jobless Claims) – it will be the real fire starter!
#GoldTrading #XAUUSD #ForexIndia #FedRates #DovishFed #TechnicalAnalysis #MarketUpdate #FinanceIndia

Strong news chain could push gold to retest 4300🟡 XAU/USD – Weekly Trading Plan (Nov 23–29)
SMC – FVG – Supply/Demand – High-Impact News Week
1. Market Context
Gold is sideways in the H4 accumulation structure, forming higher lows along the trendline.
Above are 3 important supply layers:
OLD FVG 1
OLD FVG 2
Large FVG 4220–4300
the price needs to sweep liquidity & hit the supply zone before creating a new direction.
2. Strong News Schedule for the Week
This week has a lot of USD news directly affecting gold:
Tuesday (Nov 25)
Core PPI – Retail Sales – PPI (4 consecutive red news) → strong volatility.
Wednesday (Nov 26)
Unemployment Claims
Durable Goods → Core Durable Goods
GDP q/q – GDP Price Index
Core PCE (most important inflation news of the week)
➡️ This is the decisive day for the trend for the rest of the week.
Friday (Nov 28)
German CPI (affects EUR → USD indirectly)
🎯 News Conclusion:
→ Gold likely to fake move – sweep liquidity before running correctly.
→ Thin SL zones will be continuously hunted.
3. Key Levels (from the chart you sent)
🔻 SELL Zone (Supply – FVG)
4189 – 4191 (Main Sell)
SL: 4195
This is a strong reaction zone for the week.
4132 – 4134 (Sell scalp)
SL: 4138
🔵 BUY Zone (Demand – Trendline – SMC)
4906 – 4904 (main BUY scalp zone in the chart)
SL: 3999
→ This is the only zone clearly marked as BUY in the chart.
Psychological level: 4000 – 3985
If the price falls → strong reaction to form the weekly low.
4. Weekly Trading Scenarios
🅰️ Scenario 1 – Price retraces to supply zone before dropping (most likely)
Price is forecasted to retest 4132–4134 → 4189–4191
After hitting 4190 ± → potential appearance of:
Bearish BOS H1/H4
Strong reversal to 4050 – 4000
🔻 SELL Plan
Sell 4132–4134 (scalp) SL 4138
Main Sell 4189–4191 SL 4195
TP targets:
TP1: 4090
TP2: 4050
TP3: 4000
🅱️ Scenario 2 – Price dips before news then surges (kill liquidity)
If gold is pushed down before PPI/GDP news:
Best BUY zone: 4000 – 3985
Form a low → surge back up to test supply.
🔵 BUY Plan
BUY 4000–3985
SL: 3975
TP:
4050
4100
4130
🅾️ Scenario 3 – If 4200 breaks
If 4200 is broken by a large-bodied H4 candle:
➡️ High probability gold will move up to test large FVG 4250–4300
→ At that point, only look for BUY pullbacks, no more SELL.

WILL GOLD CONTINUE TO RISE?I. BASIC CONTEXT
On November 10, 2025, gold prices surged after the market reacted positively to news of the U.S. government reopening.
The current market sentiment expects the FED to cut interest rates soon as recent economic data indicates a weakening U.S. economy.
Lower interest rates mean cheaper money, a weaker USD, thereby driving funds into safe-haven assets like gold.
The current rally is seen as a news-based pullback, potentially extending to key resistance areas before the market establishes a medium-term trend.
II. TECHNICAL ANALYSIS
Main timeframe: H2
Market structure:
Gold prices have broken out of the accumulation triangle pattern.
Formation of an Inverse Head and Shoulders pattern → signaling the correction phase has ended.
III. TRADING SCENARIOS
✅ Main scenario: WATCH TO BUY THE TREND (BUY THE DIP)
Trend expectation: Prices continue to extend the pullback to resistance areas 4180–4220.
Buy zones (BUY ZONES):
Zone 4105–4103 (near old H2 resistance → becoming new support).
Zone 4115–4116 (confirmation area post-breakout).
Deeper zone: 407x – 405x (Fib 0.618, trendline confluence area).
If prices retest the H2 structure: 4040 – 4035.
Buy stop:
When prices break through the 416x area with strong candle force → a buy stop can be placed to follow the breakout momentum.
Note to check the timing and candle force on H2/M30 to confirm momentum.
⚠️ Alternative scenario: WATCH TO SELL REACTION
If clear signs of weakness appear at resistance, consider a short SELL reaction at:
4180–4185
4205–4220
These are potential profit-taking areas for the current pullback wave.
IV. RISK MANAGEMENT
Stop Loss (SL): 10 points
Take Profit (TP): 10–12–13 points depending on setup
RR ratio: 1:1 – 1:1.3
Prioritize capital management according to the principle R ≤ 1% account/order.
Additionally, monitor news on Mr. Trump's actions during this period.
The U.S. government has reopened this week, so expect a fair amount of news, stay alert.
Trade effectively

XAUUSD / GOLD 1H BUY PROJECTION – 12.10.25The 1H structure is showing a clean breakout and retest, indicating strong bullish continuation.
✅ Technical Breakdown:
Price broke above the resistance zone and retested the breakout level, confirming support at $4,007–$4,012.
Fibonacci 0.618 Golden Ratio aligned with the support adds confluence for a long setup.
An upward trendline is being respected, signaling controlled bullish structure.
A fair value gap remains unfilled below, but since it’s in the order block zone, it’s less likely to break for a sell.
Strong bullish momentum candles indicate buyers in control.
🎯 Targets:
TP1: $4,030 (Resistance R1)
TP2: $4,050 (Resistance R2 / ATH Zone)
🛡️ Invalidation:
A clean break below $3,996 (order block zone) would weaken this bullish projection.
📈 Summary:
Entry: $4,007–$4,012 zone after retest
TP1: $4,030
TP2: $4,050
SL: Below $3,996
Bias: Bullish
Timeframe: 1H
⚠️ Always use proper risk management and follow the trend structure.

XAUUSD / GOLD WEEKLY BUY PROJECTION – 12.10.25The market is currently showing strong bullish momentum after a clean V-shaped reversal from the support zone around $3,960–$3,980.
✅ Key Technical Highlights:
Support S2 Zone held well, forming a reversal V pattern, confirming buyers stepping in.
Price has broken and retested the breakout zone around $4,000, indicating buying strength.
A bullish momentum candle confirms continuation towards higher levels.
Fibonacci 0.5–0.618 retracement zone aligned perfectly with the support, giving more confluence for long entries.
If momentum sustains, price is projected to push towards:
📍 Resistance R1: $4,060 zone (first TP)
📍 Resistance R2 / New ATH Zone: $4,120 zone (final TP)
🛡️ Invalidation:
A clean break below the $3,960 support and the fair value gap would signal weakening momentum and cancel the bullish outlook.
📈 Summary:
Entry: After retest of breakout zone ($4,000–$4,010)
TP1: $4,060
TP2: $4,120
SL: Below $3,960 (Fair value gap)
🚀 Bias: Bullish
📅 Timeframe: 4H / Weekly
⚠️ Note: Always manage risk with proper position sizing and SL discipline

GOLD SHOWING A GOOD UP MOVE WITH 1:10 RISK REWARD GOLD SHOWING A GOOD UP MOVE WITH 1:10 RISK REWARD
DUE TO THESE REASON
A. its following a rectangle pattern that stocked the market
which preventing the market to move any one direction now it trying to break the strong resistant lable
B. after the break of this rectangle it will boost the market potential for break
C. also its resisting from a strong neckline the neckline also got weeker ald the price is ready to break in the outer region
all of these reason are indicating the same thing its ready for breakout BREAKOUT trading are follws good risk reward
please dont use more than one percentage of your capitalfollow risk reward and tradeing rules
that will help you to to become a bettertrader
thank you

XAUUSD/GOLD 1H BUY PROJECTION – 18.09.25The 1-hour chart of Gold shows a recent V pattern formation, signaling a strong bullish reversal after a sharp drop.
A downtrend breakout is confirmed, supported by a Three White Soldiers pattern, strengthening the bullish momentum.
Entry Zone: Around 3,668 (current price).
Support (S1): 3,655 – strong demand zone where buyers are likely to defend.
Resistance (R1): 3,685 – key target level for this bullish move.
Risk-to-Reward Setup: Stop-loss below support (S1) at 3,655, with take-profit at resistance (R1) near 3,685.
🔑 Conclusion: Gold (XAUUSD) is showing bullish signs with breakout confirmation. As long as price holds above support at 3,655, the projection favors upside movement towards 3,685.

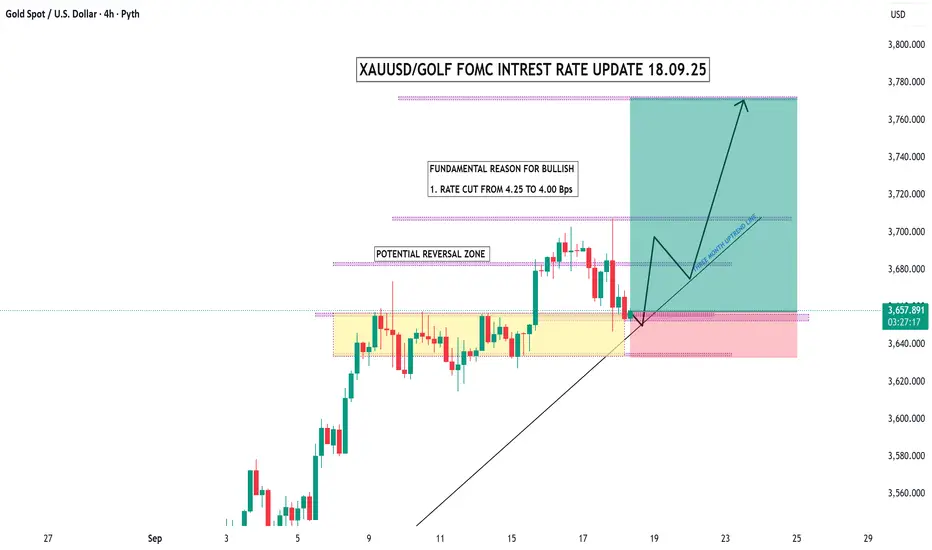
XAUUSD / Gold FOMC Interest Rate Update – 18.09.25Fundamental Reason for Bullish:
The Federal Reserve cut rates from 4.25% → 4.00%.
This supports gold’s bullish momentum since lower rates reduce the opportunity cost of holding gold.
Technical Structure:
Potential Reversal Zone: Highlighted in yellow. Price is currently testing this area around 3645–3655.
A bounce from this zone aligns with the 3-month uptrend line (black trendline).
If price respects this support, bullish continuation is expected.
Bullish Projection Path:
First, a rebound from the reversal zone.
Then, a push towards 3700–3720 with a possible retest.
Final Target Price Zone: ~3750–3780.
Risk Area (Stop Loss Zone):
If price breaks below the reversal zone and trendline (~3640–3635), bullish outlook weakens and downside risk opens.
🎯 Summary
Bias: Bullish (Fundamental + Technical confluence).
Reason: Rate cut + uptrend line support.
Targets: 3700 → 3750 → 3780.
Invalidation: Break below 3640.
Trading Analysis for Gold Spot / U.S. Dollar (15-Minute Chart)Sorry I am late in giving the signal but I will say that manipulation in XAU/USD is at extreme level. Keep portfolio at least $1000.
Take buy position in XAU/USD as much as possible.
Not more than $3630.00.
Target 1 3353.00
Target 2 3358.00
Target 3 3365.00
Target 4 3372.00
SL 3630.00
Based on the provided 15-minute chart for Gold Spot / U.S. Dollar (XAU/USD), published by NaviPips on TradingView.com on June 30, 2025, at 17:53 UTC, here’s a suggested trading setup for a buy position:
Current Price and Trend: The current price is 3,241.875, with a slight increase of +0.250 (+0.01%). The chart shows a recent downtrend that appears to be stabilizing near the current level, suggesting a potential reversal point.
Buy Entry: Enter a buy position at 3,312.875 (current price), as it aligns with a support zone where the price has found a base, indicated by the horizontal dashed line and recent consolidation.
Stop Loss: Place a stop loss at 3,295.250, below the recent low, to protect against further downside. This level is approximately 10.625 points below the entry, defining the risk.
Take Profit Levels:
Take Profit 1: 3,317.875, a conservative target about 20.000 points above the entry, aligning with a minor resistance zone.
Take Profit 2: 3,324.750, a mid-range target approximately 31.875 points above the entry.
Take Profit 3: 3,332.500, a deeper target about 45.625 points above the entry, indicating a potential trend reversal.
Price Action: The chart indicates a downtrend with a possible bottoming pattern near the current level. The support zone and upward candlestick suggest a buy opportunity if the price holds.
Risk-Reward Ratio: The distance to the stop loss (10.625 points) compared to the take profit levels (20.000 to 45.625 points) offers a favorable risk-reward ratio, ranging from approximately 1:1.9 to 1:4.3.
Conclusion
Enter a buy at 3,241.875, with a stop loss at 3,295.250 and take profit levels at 3,317.875, 3,324.750, and 3,332.500. Monitor the price action for confirmation of an upward move, and be cautious of a potential continued downtrend if the price breaks below the stop loss level. (Note: I assume "take profot" was a typo for "take profit" and have corrected it accordingly.)

XAU/USD Ready For Big Dhamaaka - Neal BhaiXAU/USD Ready For Big Dhamaaka, don't miss it. jackpot neal bhai ka.... rok sako to rok lo.

Gold's Bullish Run Meets Resistance – Time to Fade the Rally?Gold (XAUUSD) surged strongly after Friday’s event-driven move, but the momentum now appears to be stalling. Price is consolidating in a defined range, and we’re watching a key resistance zone between 3475 – 3488, where fresh sellers may step in to challenge the bulls.
🔻 Short Trade Setup – Fading the Strength
Entry: Sell at 3475
Add on Strength: 3485
Targets: See chart for marked zones
Invalidation: Daily close above 3495
📉 Risk-Reward Outlook
This setup presents a favorable risk-reward ratio, especially for short-term traders aiming to capitalize on a potential rejection at resistance. As always, keep your risk tight and position sizing disciplined.
Gold has had its run — now the odds may favor the contrarian. Keep an eye on momentum and price action at the resistance zone.
👍 If this idea aligns with your view, give it a like and drop your thoughts in the comments — let’s exchange ideas and insights!
🔔 Follow us for more actionable trade setups.
Happy Trading,
– The InvestPro Team

XAUUSD DAILY UPDATES DATE:22/07/2025XAUUSD retest between 0.5 and 0.618 i can buy this level... otherwise i will wait for confirmation bullish candle at 1hr and 4hr trendline.
This is just an idea not a financial advise, Please manage proper risk management

Gold/USD Bullish Breakout Toward Target Zone Gold/USD Bullish Breakout Analysis 🚀🟢
The chart illustrates a strong bullish breakout from a consolidation zone, signaling upward momentum:
🔍 Key Technical Observations:
Support Zone: The price respected the support area around 3,325 – 3,330 USD, forming a solid base for reversal.
Bullish Structure: Series of higher lows and higher highs indicate a bullish trend formation.
Breakout Confirmation: Price broke above short-term resistance with a strong bullish candle, indicating buying pressure.
Trendline Support: The ascending trendline has held well, confirming trend continuation.
Target Point 🎯: Projected target is near 3,365 USD, which aligns with a previous resistance and Fibonacci confluence zone.
✅ Conclusion:
The breakout above resistance, supported by a bullish structure and momentum, suggests further upside potential toward the 3,365 USD target zone. As long as price holds above the breakout level, bullish bias remains valid.
🛑 Watch for invalidation if price falls back below 3,330 USD zone.

GOLD PRICES STEADY AHEAD OF US CPI & TRADE TALKSSymbol - XAUUSD
CMP - 3324
Gold is currently testing the liquidity zone during the Asian trading session, exhibiting signs of a potential false breakout. While the metal is showing signs of recovery, the broader fundamental backdrop remains uncertain.
As of Monday, gold is trading steadily around the 3300 level, supported by a weaker US dollar and cautious sentiment among market participants ahead of upcoming US-China discussions and the release of US Consumer Price Index (CPI) data scheduled for Wednesday. Robust Non-Farm Payroll (NFP) figures for May have strengthened the dollar and diminished expectations for a near term FED rate cut. Nonetheless, ongoing domestic challenges in the US are exerting downward pressure on the currency. Investors are repositioning ahead of the CPI release.
From a technical standpoint, the trend remains bullish. Although the price previously breached structural support, it has rebounded during the Asian session following a false breakdown of both the order block and the 3300 liquidity zone. Price action in the near term will be influenced by the 3300–3335 range.
Resistance levels: 3325, 3343, 3375
Support levels: 3303, 3275
Gold appears to be approaching the 3325–3335 zone for a potential retest. Should the dollar continue to weaken and gold sustain a move above the 3340 level, the bullish momentum may persist. However, caution is warranted-a false breakout within the 3325–3335 area could signal a breakdown of the bullish structure and result in a renewed downward move.

XAU/USD Price Action Analysis – Bullish Breakout Setup XAU/USD Price Action Analysis – Bullish Breakout Setup 🚀
🔍 Chart Overview:
This chart illustrates the price movement of XAU/USD (Gold vs USD) on a mid-term time frame, highlighting a potential bullish breakout scenario from a key resistance zone.
🟩 Key Levels:
Support Zone: 🛡️
➤ $3,140 – $3,200
This zone has acted as a strong support multiple times, preventing further declines and serving as a springboard for bullish moves.
Breakout Zone (Current Level): ⚡
➤ $3,340 – $3,390
Price is currently testing this crucial resistance-turned-potential-breakout zone. A successful close above this level could confirm bullish continuation.
First Target: 🎯
➤ $3,435.87
This intermediate resistance aligns with a previously tested high. It may act as the first barrier after the breakout.
Second Target: 🥇
➤ $3,502.13
This is the major resistance zone. If bulls maintain momentum, this area will likely be tested.
🧭 Market Structure & Bias:
Price is forming higher lows, signaling growing bullish strength.
The chart shows a bullish breakout of a sideways consolidation zone.
The upward arrows and curved projection suggest a potential pullback-retest scenario at the breakout level before rallying towards targets.
🧠 Trading Plan (Illustrated by Chart):
📈 Breakout Entry:
Wait for confirmation above $3,390 with strong bullish candles and volume.
🔁 Retest Opportunity:
If price pulls back to the breakout zone ($3,340 – $3,390), this may serve as a solid re-entry point for long positions.
🎯 Profit Targets:
TP1: $3,435
TP2: $3,502
🛑 Invalidation:
A strong close back below $3,320 may invalidate the bullish bias.
📌 Conclusion:
The chart indicates a bullish continuation setup for XAU/USD with clearly defined breakout, retest, and target zones. Traders should monitor price action closely around the breakout area for confirmation before entering long positions. Risk management remains key. 🧮⚖️

GOLD - SHORT SQUEEZE BEFORE THE DROP?Symbol - XAUUSD
CMP - 3247
Gold is currently undergoing a phase of consolidation. The market lacks a decisive catalyst, and given the prevailing uncertainty in the macroeconomic landscape, traders have largely adopted a cautious, wait and watch approach. This period of consolidation may give way to a sharp movement at any time but the direction remains uncertain.
Investors are closely monitoring signals from the Federal Reserve and ongoing trade negotiations. The US dollar continues to exert downward pressure on gold amid anticipation of trade talks involving China, India, South Korea, and Japan along with recent statements from the Federal Reserve. Previously, gold received support from a weaker dollar following Moody’s downgrade of the US credit rating. However, rising risk appetite and optimism surrounding potential peace talks between Russia and Ukraine have reduced safe-haven demand for gold. Key market drivers namely, Fed commentary and international negotiations will remain crucial in shaping the future trajectory of both the dollar and gold prices.
From a technical perspective, the price remains within a downtrend and is currently in consolidation. A breakout from this range could be accompanied by significant momentum. However, my view is that any movement against the prevailing trend is unlikely to be sustained. A retest of resistance may result in a renewed decline.
Key Resistance Levels: 3257, 3265
Key Support Levels: 3204, 3153
Within the broader bearish trend, the most probable scenario is a short squeeze followed by a downside breakout from the consolidation triangle. As fundamental pressures and economic risks gradually ease, gold may continue to lose value. A false breakout in the 3250-3265 zone could potentially trigger a continuation of the downward trend toward the 3150-3120 zone.

GOLD - RESISTANCE RETEST BEFORE THE DROPSymbol - XAUUSD
Gold is currently undergoing a corrective phase, retesting a significant resistance and liquidity zone within the broader context of a prevailing downtrend. The global trend appears to be approaching a critical juncture, potentially signaling a reversal.
Ahead of the forthcoming US inflation report, gold prices have stabilized following a 3% decline, trading steadily around the 3250 level. This consolidation is occurring against a backdrop of a weaker US dollar. Market participants are awaiting the release of US Consumer Price Index (CPI) data, which is expected to provide clearer direction for both monetary policy expectations and asset flows.
Support for gold prices is being derived from a combination of factors, including optimism surrounding the US-China trade dialogue, signs of easing geopolitical tensions, and profit-taking on long dollar positions. However, the market remains cautious, closely evaluating the potential implications of inflation data on Federal Reserve policy and the demand for safe-haven assets.
Despite the current stabilization, skepticism persists regarding the sustainability of any upward momentum. Technical conditions suggest the possibility of a sharp reversal, with attention focused on key inflection points that could trigger renewed selling pressure.
Key Resistance Levels: 3269, 3284
Key Support Levels: 3246, 3200, 3167
Should the CPI report fail to deliver any major surprises, a false breakout within the 3260-3270 resistance zone followed by price consolidation could serve as a catalyst for a decline toward the 3200-3150 range.

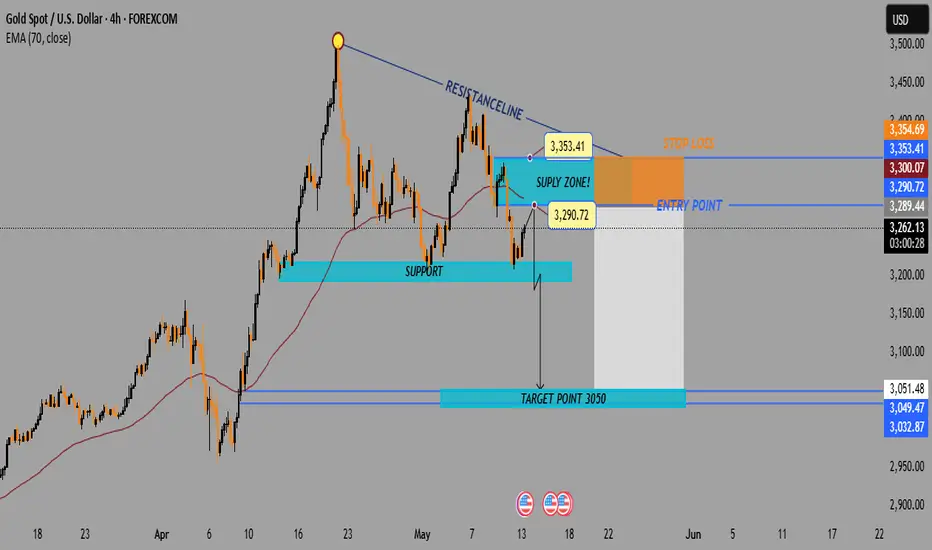
XAU/USDBearish Trade Setup Supply Zone Rejection to Target $3050Trend Overview
📉 Downtrend in Play
Price has reversed from the peak near $3,354
Currently trading below the 70 EMA (📍$3,299.86)
Forming lower highs – indicating bearish momentum.
Key Zones & Levels
🔶 Supply Zone (Resistance)
📍 $3,290.72 – $3,353.41
Strong selling pressure expected here
Possible short entry if price gets rejected
🟦 Support Zone (Previous Support)
📍 Around $3,254 – $3,210
Price has previously bounced here
🎯 Target Point (Take Profit)
📍 $3,050
Clear support level – used as a profit target
Trade Setup – Bearish Bias
🟩 Entry Point
📉 Sell near $3,290.72 (inside supply zone)
🛑 Stop Loss
❌ Above $3,354.69 (above resistance line)
✅ Take Profit
💰 Target $3,050
⚖️ Risk-Reward Ratio
Approx. 1:3 – Favorable for short trades.
Summary
🔍 Watch for a rejection in the supply zone
💼 Setup is ideal for short sellers
📊 Downtrend is supported by structure and EMA