Gold in Decision Zone – GAP Reaction Defines Next MoveMarket Context (Fundamentals → Flow)
Recent sessions continue to be driven by elevated geopolitical and macro uncertainty. Risk sentiment remains fragile as markets reassess global political tensions and their implications for trade, energy routes, and monetary stability.
As a result:
USD remains under pressure, lacking strong follow-through buying.
Equities show signs of fatigue near highs.
Gold continues to attract defensive flows, keeping the broader bullish structure intact.
This environment supports trend continuation, but not without technical pullbacks.
Technical Structure (H1–H4)
Gold is trading within a well-defined ascending channel.
Multiple BOS (Break of Structure) confirm the bullish trend.
The recent impulsive leg created a bullish GAP / imbalance.
Price is now reacting near the mid-channel decision zone, where continuation vs. deeper retrace is decided.
➡️ Trend is bullish, but location matters.
Key Levels to Watch
Current resistance: 5,080 – 5,100
GAP / reaction zone: 5,020 – 5,000
Major demand (FVG): 4,960 – 4,940
Invalidation: H1 close below 4,940
Scenarios (If – Then)
Scenario 1 – GAP Holds (Primary Bias)
If price holds above 5,000
Buyers defend the imbalance
→ Continuation toward 5,120 – 5,180 within the channel.
Scenario 2 – Deeper Pullback (Healthy Correction)
If price loses 5,000
Expect a retrace into 4,960 – 4,940 FVG.
Bullish reaction here keeps the higher-timeframe trend intact.
Only a clean break and acceptance below 4,940 would weaken the bullish structure.
Summary
Gold is not topping — it is pausing at a decision zone. In a risk-sensitive environment, pullbacks are opportunities, not threats.
Xauusdtrading

XAUUSD – Brian | H3 Technical AnalysisGold continues to trade within a well-defined bullish structure on the H3 timeframe, supported by strong technical momentum. Price action remains orderly, with impulsive advances followed by controlled pullbacks — a characteristic of a healthy trending market.
From a macro standpoint, geopolitical uncertainty remains elevated after recent comments from President Trump regarding increased U.S. control over strategic military areas in Greenland. While not implying direct occupation, the development adds to broader risk sensitivity and continues to support gold’s role as a defensive asset.
Market Structure & Technical Context (H3)
On the H3 chart, XAUUSD remains firmly above its rising trendline, with market structure defined by higher highs and higher lows. A prior break of structure (BOS) confirmed bullish continuation and opened the door for further expansion.
Key technical areas highlighted on the chart:
A strong impulsive leg followed by corrective pullbacks, consistent with trend continuation.
Fibonacci expansion with the 2.618 extension near the 5005 zone, acting as a major reaction area.
A liquidity pullback zone around 4825, aligned with trendline support and suitable for continuation scenarios.
A lower POC / value area acting as deeper support if volatility increases.
As long as price holds above these demand zones, the broader bullish structure remains intact.
Liquidity & Forward Expectations
Upside liquidity remains available above recent highs, while short-term pullbacks are likely driven by profit-taking rather than structural weakness. The 5000–5005 area represents a key decision zone where price may pause or consolidate before the next directional move.
Trading Bias
Primary bias: Bullish continuation while structure holds
Key zones to monitor:
4825 – liquidity pullback / trend continuation
5000–5005 – major extension & reaction zone
Preferred timeframe: H1–H4
Risk management remains essential, particularly in a market sensitive to sudden news flows.
Refer to the accompanying chart for a detailed view of market structure, liquidity zones, and Fibonacci extensions.
Follow the TradingView channel to receive early updates and join the discussion on market structure and price action.

SKY ROCKET XAUUSD/GOLD BUY PROJECTION 21.01.26rend = Strong Bullish
Price uptrend channel la travel pannudhu ✅
Bullish momentum candle confirm pannudhu ✅
Break + retest idea perfect ✅
Fair Value Gap (FVG) zone la re-entry buy chance iruku ✅
📌 Trade Plan (Based on your chart)
🟦 BUY AREA (Entry Zones)
✅ Zone 1 (Best Entry):
📍 FVG + retest area around 4720 – 4680
✅ Zone 2 (Aggressive Entry):
📍 Breakout retest near 4750 – 4720
🛑 STOPLOSS (Chart la marked)
📍 Below structure support / zone
✅ Stoploss: 4660 – 4640
🎯 Targets (As per Projection)
🎯 Target 1: ~4850 (Target Price 1)
🎯 Target 2: ~5000 (Target Price 2 / Major resistance + Fib retracement)
📌 Confirmation Checklist (Signal)
Buy confirm panna:
✅ Retest candle + rejection wick
✅ Bullish close above retest zone
✅ Trendline hold

XAUUSD (H4) — Bond Selloff, Yields UpPullback Opportunity or Rejection at the Top?
Gold is still holding a bullish structure on the H4 chart, but the rebound in global yields can easily trigger sharp swings around key resistance. Today’s approach is simple: trade the zones, not the noise.
I. Executive Summary
Primary trend: H4 uptrend remains intact.
Trading bias: Prefer BUY on pullbacks into demand; consider SELL only with clear rejection at Fibonacci resistance.
Key zones:
Sell: 4774–4778
Buy: 4666–4670
Value Buy: 4620–4625
Rule: Enter only after zone touch + confirmation (rejection / micro-structure shift).
II. Macro & Fundamentals (optimized & concise)
Global bond selloff: Bond selling is spreading globally; Japan’s 40-year JGB yield hitting 4% signals broad, persistent yield pressure.
US yields rebounding: Higher US yields (10Y–30Y) raise the opportunity cost of holding gold → short-term bearish pressure for XAUUSD.
Risk premium still alive: Geopolitical tension and tariff headlines keep markets sensitive, supporting defensive flows and limiting deep downside.
Fundamental takeaway: Rising yields can drive a pullback, but the broader risk backdrop favors a correction within an uptrend, not a full reversal (unless structure breaks).
III. Technical Structure (from your chart)
1) H4 overview
Price is extended after a strong impulse and is now consolidating, while structure still prints Higher Highs / Higher Lows.
The ascending trendline remains supportive → the higher-probability play is buying dips into demand rather than chasing price.
2) Key zones
Fibonacci Sell zone: 4774 – 4778 (major supply / resistance — profit-taking and rejection risk)
Buy zone: 4666 – 4670 (shallow pullback within trend)
VL / Value Buy: 4620 – 4625 (deeper pullback — higher-quality dip if yields spike again)
Lower support zones remain a contingency for a deeper flush.
IV. Trading Plan (Brian style — 2 scenarios)
⭐️ PRIORITY SCENARIO — BUY (trend continuation)
Idea: As long as the H4 uptrend holds, look to buy pullbacks into demand with confirmation.
Option A — Buy pullback: 4666 – 4670
SL: below 4620 (more conservative: below 4616–4610 depending on volatility/spread)
TP: 4716 – 4740 – 4774 – 4800
Option B — Value Buy (if a deeper sweep happens): 4620 – 4625
SL: below the nearest H4 swing low / below 460x (risk preference dependent)
TP: 4666 – 4716 – 4774 – 4800
Confirmation cues (optional):
Strong rejection wick at the buy zone, or
H1 micro-structure break back to the upside, or
Liquidity sweep then close back above the zone.
⭐️ ALTERNATIVE SCENARIO — SELL (rejection at Fibonacci resistance)
Idea: With yields rising, gold may react sharply at the top — treat this as a reaction trade, not a macro trend reversal call.
Sell zone: 4774 – 4778 (SELL only if price rejects clearly)
SL: above 4788 – 4800
TP: 4740 – 4716 – 4670
Important: If H4 closes and holds above 4778 (acceptance), the bias shifts to buying pullbacks instead of forcing shorts.

GOLD SHOWING A GOOD UP MOVE WITH 1:8 RISK REWARD GOLD SHOWING A GOOD UP MOVE WITH 1:8 RISK REWARD
DUE TO THESE REASON
A. its following a rectangle pattern that stocked the market
which preventing the market to move any one direction now it trying to break the strong resistant lable
B. after the break of this rectangle it will boost the market potential for break
C. also its resisting from a strong neckline the neckline also got weeker ald the price is ready to break in the outer region
all of these reason are indicating the same thing its ready for breakout BREAKOUT trading are follws good risk reward
please dont use more than one percentage of your capitalfollow risk reward and tradeing rules
that will help you to to become a bettertrader
thank you

XAUUSD H1 – Range Bound MarketSideways Consolidation, Waiting for a Range Break
Gold on the H1 timeframe is currently trading inside a clear sideways range near the ATH, showing signs of balance after the recent impulsive move. At this stage, the market is not trending — it is building liquidity and waiting for a breakout.
MARKET STRUCTURE
Price is consolidating inside a wide sideways box after failing to continue higher from the ATH.
Multiple rejections on both sides of the range confirm that neither buyers nor sellers have full control yet.
This behaviour typically appears before a volatility expansion.
KEY ZONES & LIQUIDITY
Upper range – Resistance / Breakout trigger:
~4620 – 4640
Acceptance above this zone would signal renewed bullish strength and open the path toward new highs.
Mid-range equilibrium:
Current price is hovering around the balance area, where false signals are common. Patience is required here.
Lower range – High liquidity support:
~4580 – 4590
This zone has absorbed selling pressure multiple times. A clean reaction here could support a bounce back into the range.
Deeper liquidity support:
~4515 – 4520
If the range breaks to the downside, this is where strong demand and liquidity are likely to sit.
SCENARIOS TO WATCH
Bullish breakout scenario:
Price holds above the lower range and breaks cleanly above 4620–4640.
Acceptance above the range confirms continuation toward new ATH levels.
Bearish liquidity sweep scenario:
Price sweeps below 4580–4590, tapping deeper liquidity.
A failure to reclaim the range would shift short-term bias to the downside.
SUMMARY
Current state: Sideways / consolidation
Market is compressing and building liquidity
Best trades come after the range breaks, not inside it
Let price show direction before committing
In this environment, discipline matters more than activity — wait for the breakout, and trade the reaction, not the noise.

XAUUSD H1 – Bullish bias, awaiting channel breakout.XAUUSD H1 – Bullish Bias, Waiting for Channel Breakout
Gold continues to trade inside an ascending channel on H1, and the overall structure still favors upside continuation. At this stage, the priority is not chasing price, but waiting for either a clean channel breakout or a controlled retest of demand before the next impulsive move.
TECHNICAL STRUCTURE
Price is consolidating inside a rising channel after a strong impulsive rally.
Higher lows are still being respected, showing that buyers remain in control.
The current range looks like re-accumulation, preparing for the next expansion leg.
KEY LEVELS TO WATCH
Buy-on-retest zone:
4612 – 4615
This is the most important level in the short term. A successful retest and hold here keeps the bullish structure intact and opens the door for continuation.
Upper resistance / reaction zone:
4688 – 4690
This area may cause short-term reactions or consolidation, but a strong break and acceptance above it would confirm bullish momentum.
Upside target:
4745
This is the next major objective once price breaks out of the channel and absorbs sell-side liquidity above.
Sell-side liquidity below:
The lower boundary of the channel acts as liquidity support. As long as price holds above it, pullbacks are considered corrective.
PRIORITY SCENARIO – BULLISH CONTINUATION
Price retests 4612–4615, holds above the zone, and forms bullish confirmation.
A breakout above 4688–4690 confirms strength.
Momentum accelerates toward 4745 as buy-side liquidity is triggered.
ALTERNATIVE SCENARIO – RANGE EXTENSION
If price fails to break immediately, further consolidation inside the channel is possible.
In this case, patience is key until a clear breakout or a clean retest of demand appears.
SUMMARY VIEW
Bias remains bullish
Focus on buying pullbacks, not chasing highs
A confirmed break of the channel is the signal for the next expansion
4612–4615 defines whether buyers stay in control
The market will show direction once liquidity is taken — wait for confirmation.

XAUUSD (H3) – Liam StrategyTrendline break confirms the uptrend ✅ | Buy the discount, scalp-sell at ATH
Quick overview
On the H3 chart, the story is clean: price has broken the bearish trendline and held structure after a clear BOS, which keeps the bias bullish for continuation.
But the best execution is still the same: no FOMO. I’d rather buy from discount liquidity zones than chase mid-range candles.
Key Levels (from your chart)
✅ Buy Zone 1 (re-buy): 4434 – 4437
✅ Buy Zone 2 (liquidity imbalance): 4340 – 4343 (deep sweep zone)
✅ ATH Sell scalping: 4560 (main profit-taking / reaction sell)
Technical read (Liam style)
Breaking through the trend confirms uptrend: the trendline break signals buyers are back in control.
4434–4437 is the clean re-entry area: a logical pullback zone with better R:R.
If volatility spikes and price hunts liquidity, 4340–4343 is the “best value” area to look for a strong reaction.
Trading scenarios
✅ Scenario A (priority): BUY the pullback at 4434–4437
Entry: 4434 – 4437
SL: below 4426 (or below the most recent H1/H3 swing low)
TP1: 4485 – 4500
TP2: 4560 (ATH – main target)
Logic: Uptrend confirmation is in place — I only want the pullback entry, not a chase.
✅ Scenario B (deep buy): If price sweeps down into 4340–4343
Entry: 4340 – 4343
SL: below 4330
TP: 4434 → 4500 → 4560
Logic: This is the “sweet spot” if the market does a liquidity reset before pushing higher again.
⚠️ Scenario C (scalp only): SELL reaction at ATH 4560
Entry: 4560 (only if we see clear rejection / weakness)
SL: above the sweep high
TP: 4520 → 4500 (quick scalp)
Note: This is a scalp idea at ATH — not a long-term bearish call while the bullish structure is intact.
Key notes
Avoid entries mid-range. Only execute at 4434–4437 or 4340–4343.
Wait for confirmation on M15–H1 (rejection / engulf / MSS).
Risk management: 1–2% per idea, scale out into ATH.
Are you waiting for the 4434 pullback buy, or hoping for a deeper sweep into 4340 for the cleanest entry? 👀

XAUUSD H1 - Liquidity reaction post-geopolitical spikeGold surged strongly at the start of the week as escalating geopolitical tensions boosted safe-haven demand, while expectations of further Fed rate cuts continued to support the broader bullish narrative. From a technical perspective, price is now reacting around key liquidity and Fibonacci zones rather than trending impulsively.
TECHNICAL OVERVIEW
On H1, gold experienced a sharp sell-off followed by a recovery, forming a V-shaped reaction that suggests aggressive liquidity clearing.
Price is currently trading below prior breakdown zones, indicating that supply remains active at higher levels.
The market structure favors selling on rallies in the short term, while deeper pullbacks may attract fresh buyers.
KEY LEVELS & MARKET BEHAVIOR
Upper sell zones (supply & Fibonacci confluence):
4497 – 4500 (FVG sell zone, premium area)
4431 – 4435 (Fibonacci + former support turned resistance)
These zones represent areas where sellers previously stepped in aggressively, making them important reaction levels if price rebounds.
Lower buy-side liquidity:
4345 – 4350 (Value Low / buy-side liquidity zone)
This area aligns with trendline support and prior accumulation, making it a key level to monitor for a bullish reaction if price rotates lower.
EXPECTED PRICE FLOW
Short term: price may continue to consolidate and rotate between resistance and liquidity below, with choppy price action likely.
A rejection from the upper resistance zones could lead to another leg lower toward buy-side liquidity.
If buy-side liquidity is absorbed and defended, the market may attempt another recovery move.
FUNDAMENTAL CONTEXT
Gold’s strength is underpinned by two major factors:
Rising geopolitical risk, which increases demand for safe-haven assets.
Dovish expectations from the Federal Reserve, as markets continue to price in additional rate cuts, reducing the opportunity cost of holding non-yielding assets like gold.
These fundamentals support gold on higher timeframes, even as short-term technical corrections play out.
BIG PICTURE VIEW
Medium-term bias remains constructive due to macro and geopolitical support.
Short-term price action is driven by liquidity and reaction zones rather than trend continuation.
Patience is key—allow price to interact with major levels before committing to the next directional move.
Let the market show its hand at liquidity.

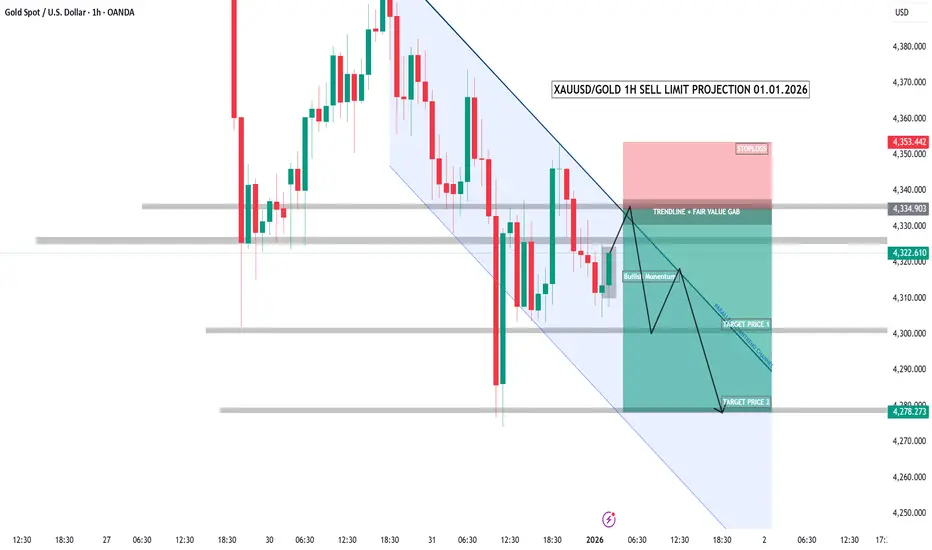
XAUUSD/GOLD 1H SELL LIMIT PROJECTION 01.01.26This is XAUUSD – Gold – on the 1-hour timeframe.
The market is clearly in a downtrend,
forming lower highs and lower lows.
Price is currently in a pullback phase within the trend.
This pullback is moving into a strong confluence zone —
the descending trendline combined with a fair value gap.
This area acts as a high-probability sell zone.
Sell limit area:
4330 to 4340.
Here, we expect a short-term bullish move to trap buyers,
followed by a strong rejection and continuation to the downside.
Stop loss:
4353 — a clear invalidation of the setup.
Target one:
4300 — a short-term support level.
Target two:
4278 — a strong demand zone and trend continuation target.
This is a pullback sell strategy.
Trade with the trend, not against it.
No emotions.
No overtrading.
Only structure, discipline, and patience.
XAUUSD (H4) – Weekly Outlook (Dec 22–26)Buy the dip inside the channel, watch for a short-term correction after Wave 5
Strategy summary for next week
On the H4 chart, gold is still trading inside a mid-term rising channel. However, the wave structure suggests Wave 5 is likely finished, so next week I’m focusing on two main ideas:
Mid-term BUY bias, but only if price pulls back to a better liquidity area.
Short-term SELL correction, triggered only with confirmation (break below 4309) on the lower timeframe.
1) Technical view: Uptrend channel holds, but a correction is likely
Price is currently in the upper half of the channel → not an ideal spot to chase buys.
The chart highlights two key liquidity areas:
Liquidity Sell Zone near 4433 (upside target, only valid if price builds a clean path higher).
Strong Liquidity around 4254 (the area where I want to reload mid-term buys).
Meaning: The channel is still the main framework, but if Wave 5 has finished, a pullback/correction is normal before the next directional leg.
2) Mid-term plan (priority): BUY at channel liquidity
✅ Buy zone: 4250 – 4255
SL: 4240
Expectation: A rebound back toward the channel’s midline, and if momentum returns, continuation toward 4433.
Logic: This is the “better price” area aligned with the channel structure + key liquidity. Risk-reward is far cleaner than buying at the highs.
3) Short-term plan: SELL the correction only after confirmation
Because Wave 5 looks completed, a corrective sell is valid — but I only want to sell after the market confirms on the lower timeframe:
✅ Bearish confirmation: break below 4309
After the break, prefer a sell on retest (no chasing).
A realistic correction target is a move back toward the 425x liquidity zone.
Note: This is a short-term correction trade and doesn’t conflict with the mid-term buy bias.
4) Fundamentals next week: Holiday liquidity = more sweeps
Dec 22–26 includes multiple European holidays, which often means thin liquidity: price may not trend hard, but it can still wick and sweep stops.
Geopolitical risk remains elevated: Israeli officials plan to brief Trump on potential new strikes on Iran — this can trigger sudden safe-haven flows into gold.
Action: Trade smaller, trade cleaner, and avoid getting trapped in abnormal volatility.
5) Execution checklist
Mid-term BUY: wait for 4250–4255, SL 4240.
Short-term SELL: only activate if 4309 breaks, then sell the retest on lower TF.
No FOMO in a low-volume holiday week.
Which scenario are you leaning into next week: buying 425x, or waiting for a 4309 breakdown to sell the correction?

XAUUSD H4 – Medium-Term Outlook for the Coming WeekGold remains within a broad rising channel, but recent price action shows clear rejection at the upper trendline. For the week ahead, the focus is on a potential technical pullback, while keeping an alternative bullish scenario if the market fully accepts higher prices.
PRIORITY SCENARIO – MAIN SCENARIO
Wait for structural confirmation to sell the medium-term corrective move.
Key confirmation level: a break of the trendline around 4317.
Trade idea: look for confirmation below 4317 to sell the corrective leg within the rising channel.
Technical context: price is trading near the upper boundary of the channel and showing rejection, a common setup before a rotation back toward lower value areas.
Position management:
Sell positions should be treated strictly as corrective trades within a broader uptrend. If price fails to stay below 4317 and regains bullish structure, risk should be reduced and short positions avoided.
ALTERNATIVE SCENARIO – SECONDARY SCENARIO
Trend continuation if price breaks to new highs and finds acceptance.
Trigger condition: a clean breakout to new highs with sustained bullish momentum.
Trade idea: prioritize buy setups once the market clearly accepts higher prices.
Technical context: successful breakouts often lead to range expansion, making short positions unfavorable.
KEY MEDIUM-TERM BUY ZONE
Liquidity-based opportunity in the event of a deeper pullback.
Reference buy zone: around 4220.
Rationale: this area represents a major liquidity cluster and a logical zone to monitor for bullish reactions during a deeper year-end pullback.
KEY TECHNICAL REASONS
The dominant H4 trend remains bullish, but rejection at the upper channel increases the probability of a technical correction.
The 4317 level acts as a key decision point to distinguish between a genuine pullback and temporary consolidation.
The 4220 area serves as a value zone aligned with liquidity for potential trend-following buys.
MACRO AND NEWS CONTEXT
Recent comments have reinforced expectations of future rate cuts to address labor market risks, which remains supportive for gold in the broader context. Geopolitical developments, including discussions around the next steps in the Gaza peace process, continue to underpin safe-haven demand. However, year-end holiday conditions often result in thinner liquidity, wider spreads, and less reliable price moves, making discipline and risk control essential.
RISK MANAGEMENT AND WEEKLY PLAN
Avoid chasing long positions near the upper trendline of the rising channel. Only consider short positions after clear confirmation below 4317, avoiding emotional top-picking in a bullish market. If price breaks and holds above recent highs, shift focus back to trend-following buy setups. Reduce position size during the holiday week and prioritize trades around well-defined key levels rather than extended moves.

XAUUSD (D1) – Weekly OutlookLana focuses on buying discounted zones, preparing for a possible ABC correction 💛
Quick summary
Higher timeframe (Daily): The main uptrend remains intact and structurally strong
Elliott Wave: Gold likely completed Wave 5, with a potential ABC corrective phase ahead to complete the cycle
Liquidity: Christmas week and year-end positioning may cause thin liquidity and irregular price movements
Plan: No chasing. Lana waits for price to reach key buy zones at 4250 and 4205
Market context for next week
Next week’s trading activity may slow down due to the Christmas holiday and preparations for the year-end. Thinner liquidity often leads to sharp, irregular moves and liquidity sweeps. At the same time, ongoing geopolitical tensions continue to support gold, while USD weakness adds further tailwinds. Because of this, Lana prefers a zone-based approach rather than trying to predict exact tops or bottoms.
Technical view on D1
On the Daily chart, gold still shows a solid bullish foundation. However, from an Elliott Wave perspective, price appears to be finishing the final impulsive wave (Wave 5). After a Wave 5 completion, a corrective ABC structure is common, allowing the market to rebalance before the next major move.
For Lana, a correction is not bearish—it’s an opportunity to look for higher-probability buys at discounted levels instead of chasing price at elevated zones.
Key levels Lana is watching
1) Primary buy zone: 4250
This level previously acted as a strong resistance and was decisively broken. Liquidity remains concentrated in this area, making it a favorable zone to look for buying opportunities if price pulls back.
2) Long-term buy zone: 4205 (POC from Volume Profile)
This is a major Point of Control where price previously accumulated heavily. If the ABC correction extends deeper, this zone becomes a key area for longer-term positioning.
Trading plan for next week (overview)
Early in the week, Lana will observe lower timeframes to confirm entries.
Priority is given to pullbacks toward 4250; deeper corrections may offer opportunities near 4205.
With thin holiday liquidity, Lana plans to:
reduce position size
keep stop losses clearly defined
scale out profits once price reacts from the zones
Lana’s note 🌿
Holiday weeks often bring fewer clean setups but more unexpected liquidity grabs. Lana will stay patient, trade selectively, and focus only on price levels that truly make sense.
This is Lana’s personal market view, not financial advice

XAUUSD – Continuation Update | Buy Trade Progressing as PlannedAfter the earlier move and corrective phase, Gold once again respected the previous high → support zone, confirming that buyers were still defending structure.
🔹 Buy Trade Recap:
Entry taken after structure held above support
Price dipped close to SL, but never broke structure
Liquidity was grabbed, weak hands shaken out
Market respected demand and expanded upward
🎯 TP1 hit successfully
Partial profits secured as planned.
🔹 Current Status:
Buy position still active
Targeting TP2
SL protected and trade managed
This trade is a reminder:
Markets don’t reward impatience.
They reward those who trust their analysis and manage risk.
Almost stopped out, yes — but structure stayed intact.
And that’s all that matters.
Patience is not passive.
It’s a position.
#XAUUSD #Gold #TradeManagement #SmartMoney #TradingView #ValhallaCore

XAU/USD: SEIZE THE BUYING OPPORTUNITY BEFORE THE FED STORM!1. 📰 Fundamental Analysis (FA)
Cash flow is focusing on the FED this Wednesday.
Rate cut: A 25 basis point cut is expected. This puts downward pressure on the USD, pushing Gold (a non-yielding asset) to rise.
Safe haven: Ongoing Ukraine tensions further support the rise of precious metals.
Risk: Strong employment data (JOLTS) could slow the USD's decline, but the main trend remains policy easing.
2. 📊 Technical Analysis (TA)
On the 1H chart, Gold is completing a correction to the important Demand zone.
Buy Zone (Order Block): 4,175.00 – 4,195.00. This is where Smart Money accumulates before major events.
Target 1 (TP1): 4,228.214 – Fill the price gap (FVG).
Target 2 (TP2): 4,259.407 – Potential supply zone (POI).
Stop Loss (SL): Below 4,170.00 to protect the account if the scenario changes.
Strategy: Wait for the price to drop to 4,176.247 and a reversal signal to appear on the M15 chart to trigger a Long order. Be cautious of Chairman Powell's statements!
#XAUUSD #Gold #FED #FOMC #InterestRates #SmartMoneyConcept #OrderBlock #ForexTrading #TechnicalAnalysis #FundamentalAnalysis

Holding Breath for FOMC News - Will History Repeat?XAUUSD Trading Idea Today 10/12/25 (FOMC - Big News)
Will history repeat:
Before the news: Sideway | News release: prioritize SELL
Today's range: 417X–423X
Expectation: FOMC release leads to selling (Powell is usually hawkish → price drops like in September & October)
1) Intraday Trading (catching the Sideway range)
Upper range:
4218–4220
4230–4233
Lower range:
4170–4173
4180–4182
→ Morning & afternoon prioritize catching the range – trade within the range for safety before the news.
2) During the news (for those who trade the news)
Not suitable for those who are risk-averse, so you can skip if you can't handle it. Limit if you want to learn and profit using a very small account.
1) 4218–4220 (Risk-only) (if it doesn't break all day)
• High reaction area
• Safe → skip
• Risk → Probe sell, small SL
2) 4230–4233 (Main Sell)
• Strong resistance within the range
3) 4240–4244–424X (Best Sell)
• Liquidity zone
• If spike during/before news → High RR sell
3) Target down
TP1: 418X
TP2: 416X-5x
TP3: 409X (main target – swing + FVG + fibo)
4) BUY?
Attention area:
4150-52
4128-32
4102-96
5) Note on the news
This scenario holds if Powell maintains a hawkish tone.
If Powell is more "dovish" → it may go against expectations.
Risk-averse traders → do not trade the news.
News traders → use a small account to test market reactions.
Quick Summary
Before the news → Sideway, catch the range 417X–423X
News release → prioritize SELL
SELL zone: 4218, 4230–4233, 4240–4244
Main target: 409X
The price will move with each statement from the Fed Chairman and keep an eye on Trump too.
Wishing everyone a victorious day.

XAU/USD: Hold Gold, Await Big Waves from PCE!Gold is moving sideways within a narrow range, supported by a weak USD and expectations of a dovish Fed. All attention is focused on the upcoming PCE Index – the data will determine the long-term momentum of XAU/USD!
📰 Fundamentals: Awaiting Major Signals
Gold's Advantage: USD weakens due to predictions of early Fed rate cuts + Safe haven demand.
Key Point: PCE data will be the "push" confirming the Fed's path.
📊 4H Technical: Trend-Following Buy Strategy
Market structure remains BULLISH. We await a correction to enter at optimal price levels:
Ideal BUY Zone (OTE/Support):
Price: $4,133 - $4,161
Action: Wait for reversal signals here to BUY (Long).
Upside Target: $4,334 up to $4,382 (Previous high).
Safe Stop Loss: Below $4,046 (Below OB), a break here will invalidate the bullish structure.
🎯 In Summary: BE PATIENT! Look to BUY in the $4,133 - $4,161 zone after PCE release to optimize R:R.
#XAUUSD #GOLD #Gold #PCE #FED #TradingView #MarketStructure #OTE #Forex

Bullish Breakout & Golden Zone Reversal AnalysisChart Analysis (Gold – 15m)
1. Trend Structure
Price has been moving inside a descending channel, showing short-term bearish pressure.
Now price is attempting a breakout from the channel, signaling a potential bullish reversal.
2. Key Support Zones (Demand Areas)
4,187.08 → First support where buyers reacted.
4,178.10 → Deep liquidity zone (strong demand).
These levels align with Fibonacci retracement clusters:
0.618 (4,186.98)
0.705 (4,184.22)
0.79 (4,181.51)
This confirms a high-probability reversal zone.
3. Fibonacci Strategy
Price touched the 0.618–0.79 golden pocket and bounced.
This supports a long setup targeting the 1:1 impulse projection.
4. Moving Averages (EMA Strategy)
EMA 70 and EMA 200 are above price during correction.
A breakout + retest above EMAs would confirm further bullish momentum.
5. Breakout Strategy
A clear breakout above the descending channel suggests the beginning of a new bullish leg.
6. Target Projection
The measured move indicates:
Target Point: 4,240.21
Expected gain: ≈ +1.25% (≈ 52.5 points)
7. Signal Summary
✔️ Support respected
✔️ Breakout forming
✔️ EMA alignment improving
✔️ Fibonacci golden zone bounce
✔️ Bullish target activated
📌 Final Signal
Bullish Bias (Long) above 4,187
🎯 Target: 4,240
🛡 Stop-loss: Below 4,178 NSE:BANKNIFTY1! CME_MINI:MNQ1! CME_MINI:ES1! CME_MINI:NQ1! CME_MINI:MES1! COMEX_MINI:MGC1! CBOT_MINI:YM1! NSE:NIFTY1! NSEIX:NIFTY1! NYMEX:CL1! COMEX:SI1!

Gold (XAU/USD): FED WILL CUT! ADP HAS MADE IT CLEAR.🎯 Fundamental Summary
SHOCKING News: ADP private payrolls unexpectedly DECREASED by 32,000 (completely contrary to the expected increase).
Impact on Fed: This weak labor data strongly reinforces the expectation that the Fed will cut interest rates by 25 basis points at the next meeting.
Conclusion: A lower interest rate environment is the main "tailwind," boosting demand for non-yielding Gold.
📈 Technical Analysis
The market is approaching a decisive zone. Gold needs a breakthrough:
Strong Supply Zone (Key Level): $4,200 – $4,212
Expected Action/Reaction: If Gold breaks and closes above $4,212, the fundamental momentum will prevail, confirming a strong UP trend.
Important Demand Zone (Strong Support): $4,131 – $4,140
Expected Action/Reaction: The final support area. If there is a deep decline, this is a potential buying point based on the news.
#XAUUSD #GoldAnalysis #SmartMoneyConcepts #FundamentalAnalysis #Fed #ADP #LaborMarket #TradingView

1. Bullish Reversal Setup From POI Toward Key TargetChart Analysis (Gold – 30m)
Trend Structure:
Price is currently in a corrective down-move inside a rising channel, but overall structure still respects higher-timeframe bullish momentum.
🔵 Key Zones
Bullish POI (Demand Zone): Lower blue zone – strong reaction point from previous impulsive move.
Bullish Order Block: Upper blue zone – price is retesting this area for liquidity collection.
📈 Indicators Used
EMA 70 & EMA 200:
Price is oscillating between both EMAs.
EMA 70 above EMA 200 → bullish bias still intact.
Liquidity Sweep:
Wick rejections below structure indicate liquidity grab before bullish reaction.
📌 Market Behavior
Price is expected to dip into POI to collect liquidity.
From POI, a bullish reversal is projected toward target zone 4,264.57.
🎯 Target
4,264.57 (Highlighted target level; aligns with channel top + liquidity zone)
📊 Summary Signal
Price likely retraces into the Bullish POI, then forms a strong bullish impulse toward the target. CME_MINI:NQ1! CME_MINI:MNQ1! CME_MINI:MES1! COMEX_MINI:MGC1! CME_MINI:ES1! NYMEX:CL1! NSE:BANKNIFTY1! CBOT_MINI:YM1! NSEIX:NIFTY1! NSE:NIFTY1! COMEX:SI1!

XAUUSD: Rate Cut Storm Ahead! Is Gold Set to Soar?1. 📢 FUNDAMENTALS PUSHING PRICE
FED About to Cut Interest Rates (90%): Cooling U.S. economic data strengthens the expectation of a 25bps cut next week. This weakens the USD and supports Gold.
Geopolitical Risks: Russia-Europe tensions keep the safe-haven demand for Gold high.
Key Event: Watch PCE on Friday to better determine the Fed's monetary policy path.
2. 🎯 TECHNICAL ENTRY POINTS
The optimal strategy is to BUY ON DIPS at strong support:
Optimal Buying Zone (Discount Zone): $4,181 – $4,186. This is the ideal Long Entry Point.
Resistance/POC: $4,207. Important short-term level.
Upside Target: $4,240. Next profit-taking target.
👉 Conclusion: Be patient and wait for Gold to adjust to the $4,181 - $4,186 zone to enter a buy order with low-risk advantage, leveraging macro upward momentum.
#XAUUSD #GOLD #FED #InterestRateCut #GoldAnalysis

Gold Price at Critical Resistance Breakout or Rejection SetupChart Analysis (All Strategies Used)
1️⃣ Trend Analysis
Price is moving inside a descending structure, but recently broke above the short-term trendline, showing bullish momentum.
EMAs 70 & 200 are acting as dynamic support—bullish signal
2️⃣ Support & Resistance
Strong resistance zone: 4,228 – 4,236 (multiple rejections earlier).
Support zone: around the 4,195 – 4,200 region.
If price stays above support + EMAs, bullish continuation likely.
3️⃣ Breakout Strategy
Price is retesting resistance again.
A clean breakout above 4,236 can send the price toward the buying target: 4,263.60 🚀.
4️⃣ Rejection / Pullback Strategy
If price fails at 4,236 and rejects strongly, expect a drop back toward:
Support 4,195
Selling Target: 4,162 📉
5️⃣ EMA Strategy
Price is above both EMAs → trend favors buyers.
If price dips and closes below EMA 70 + EMA 200, selling pressure strengthens.
6️⃣ Risk–Reward Strategy
Buy setup: Break & retest above 4,236 → target 4,263.
Sell setup: Strong rejection at resistance → target 4,162.
Good RR on both sides depending on breakout vs. rejection.
📌 Final Summary
Price is at a critical resistance zone (4,236).
➡️ Breakout = BUY toward 4,263
➡️ Rejection = SELL toward 4,162 CME_MINI:MES1! CME_MINI:ES1! CBOT_MINI:YM1! CME_MINI:MES1! NSE:BANKNIFTY1! COMEX_MINI:MGC1! CME_MINI:MNQ1! COMEX:SI1! NYMEX:CL1! CME_MINI:NQ1!

Gold 4H Technical Outlook: Demand Zone Re-Test and Bullish ContiChart Analysis (Gold – 4H)
1. Market Structure
Price is in a clear ascending channel, respecting both the support line and rejection line.
Recent pullback has returned to a demand zone (4,114–4,148), which has acted as a strong buy area before.
2. Key Zones
Demand Zone: 4,114 – 4,148
Strong reaction expected; buyers previously stepped in here.
Target Point: 4,319
Based on channel top + measured move projection (153 pts).
3. Moving Averages (EMA 200 & EMA 70)
Price is trading above both EMAs, indicating bullish market sentiment.
EMA70 is acting as dynamic support inside the channel.
EMA200 supports the overall long-term uptrend.
4. Pattern Recognition
A bullish flag (red highlighted area) recently broke upward, confirming continuation.
Current movement shows another retest of the demand zone, which aligns with the channel support.
5. Trendline Analysis
Support trendline has been touched multiple times — strong confirmation.
Rejection line shows sellers but remains intact inside the channel.
6. Price Action Signals
Recent wicks near the demand zone show buyer interest.
Higher lows continue to form.
🎯 Expected Move
If price maintains above 4,114–4,148, the next target remains:
➡️ 4,319 (upper channel resistance)
Bullish continuation is favored unless price closes below 4,114, which would break structure. CBOT_MINI:YM1! CME_MINI:MES1! CME_MINI:MNQ1! CME_MINI:NQ1! NSE:BANKNIFTY1! NYMEX:CL1! CME_MINI:ES1! COMEX_MINI:MGC1! COMEX:SI1!
