XAU/USD – Big Move Loading? Liquidity Grab Before the Next RallyGold has been holding strong at higher levels, consolidating near resistance without showing a real liquidity sweep yet. With key US data coming in (Prelim GDP q/q & Unemployment Claims), the market could be setting up for a sharp correction first – before the next bullish leg in September, especially as USD weakens and Fed rate cuts get closer.
🔑 Key Levels to Watch
Resistance: 3400 → A breakout can quickly push Gold to 342x – 343x, retesting old ATH.
Support: 3370 → A breakdown can send price into the 335x BUY Zone for a clean long setup.
📌 MMFLOW Trading Plan
✅ BUY ZONE
3356 – 3354
SL: 3349
TP: 3360 → 3365 → 3370 → 3375 → 3380 → 3390 → 3400+
❌ SELL ZONE
3424 – 3426
SL: 3430
TP: 3420 → 3395 → 3390 → 3385 → 3380 → 3370
🎯 MMFLOW View
End of month often comes with liquidity flushes before the market decides its next big move. Watch for a potential drop into 335x as a golden buying opportunity before Gold makes a run at new highs.
👉 Trade with discipline. Stick to Key Levels. No FOMO.
🔥 What do you think traders?
Will Gold break 3400 first or flush to 335x for the perfect buy?
👇 Drop your views in the comments – let’s analyze together!
Xauusdupdates

Gold (XAU/USD) Targets $3,397 – $3,406 Amid Bullish MomentumAnalysis:
The 4H chart of Gold (XAU/USD) shows strong bullish momentum after a corrective phase. Price has broken above consolidation and is currently trading around $3,382, with upside targets at $3,397 and $3,406 (highlighted resistance zone).
The supply zone on the higher timeframe remains intact below $3,280, acting as a long-term support.
Immediate support levels lie at $3,371, $3,356, and $3,348. A break below these could shift momentum bearish.
Current bullish structure suggests that as long as price holds above $3,371, buyers may drive the price higher toward the resistance levels.
A rejection from $3,406 may lead to a pullback toward the mid-support zone before another attempt higher.

Elliott Wave Analysis XAUUSD – August 28, 2025
Momentum
• D1 timeframe: Momentum is still in a bearish reversal zone (overbought). Price is stalling but has not yet given a clear reversal confirmation → showing that bullish strength is weakening.
• H4 timeframe: Momentum is also turning bearish → from now until the US session, price is likely to continue sideways or decline further.
• H1 timeframe: Momentum is turning bullish → suggesting a short-term corrective rally or sideways movement.
Wave Structure
• D1 timeframe: At the moment, there are two possible wave counts (as mentioned in yesterday’s plan). Both scenarios point to the same outcome: after completing the correction, price will move higher.
o Key note: The final corrective structure is a triangle. Once this triangle completes, it typically signals a strong upward breakout, confirming the end of the corrective phase.
• H4 timeframe: Price is consolidating within a contracting triangle, leaving two possibilities:
1. Leading diagonal for wave 4 (abcde) → once completed, price could drop sharply towards the 0.618 Fibonacci retracement.
2. Ending triangle for wave d → a strong wave e decline is expected before the next rally begins. In this case, the signal to watch is price testing the lower boundary of the triangle.
• H1 timeframe: A leading diagonal is forming, while RSI shows bearish divergence at the top. This supports the sell scenario. However, since H1 momentum is currently bullish, we expect one more push higher into resistance at 3403, which will provide a potential short opportunity.
o Note: Today’s US Jobless Claims data could trigger a stop-hunt move upward before a strong sell-off. Ahead of the news, price may continue ranging between 3385 – 3387.
Trading Plan
• Since price has not dropped significantly yet, it is likely still within wave 5 of the triangle. The upper resistance at 3403 is an ideal sell zone.
• A safer option: wait for price to break below the triangle’s lower boundary and close beneath it → then look for a breakout sell setup.
• Target: 0.618 Fibonacci retracement at 3345.
Trade Setup
• Sell Zone: 3403 – 3405
• Stop Loss: 3413
• Take Profits:
o TP1: 3374

XAU/USD Trading Plan – Gold Eyes 3400! 🚀Gold continues to hold its bullish momentum as the USD weakens, and buyers are stepping in with strong FOMO-driven demand. However, a short-term correction (1–2 days) is still possible before the next big leg higher.
The smart play? ⚡ Wait for clean pullbacks into strong liquidity zones — buy low, hold, and ride the trend.
📊 Short-Term View (M15–H1)
Break below 337x could push Gold quickly down to 335x–334x to fill liquidity gaps.
Bigger picture remains bullish with a potential run to 3400 and beyond.
🔑 Key Levels
Support: 3363 – 3356 – 3349 – 3335
Resistance: 3385 – 3391 – 3402 – 3425
🎯 Trading Plan
✅ Buy Setups
Scalp Buy: 3356 – 3354
SL: 3350
Targets: 3360 → 3365 → 3370 → 3375 → 3380 → 3390 → 3400+
Swing Buy Zone: 3336 – 3334
SL: 3330
Targets: 3340 → 3350 → 3360 → 3380 → 3400+
❌ Sell Setups
Scalp Sell: 3385 – 3387
SL: 3390
Targets: 3380 → 3375 → 3370 → 3365 → 3350
High-Risk Sell Zone: 3401 – 3403
SL: 3407
Targets: 3396 → 3390 → 3380 → 3370
📌 Takeaway
Gold is still bullish overall, but short-term dips are healthy and provide the best entry points. Stay patient, wait for price action to confirm at key support, and let the market pay you.

Elliott Wave Analysis – XAUUSD 27/08/2025
Momentum
• D1 timeframe: Momentum is showing reversal signals, as mentioned in yesterday’s plan. Currently, D1 is in the overbought zone, suggesting that bullish momentum has weakened and the market needs at least one corrective move to regain strength.
• H4 timeframe: Momentum is turning bearish. We need to wait for the current candle to close for confirmation, but there is a high probability that today’s main trend will be bearish.
• H1 timeframe: Momentum is in the oversold zone and preparing to turn up. If price rises into the overbought zone, then reverses bearish without breaking above 3394, there is a strong chance of a long-term decline – creating a sell opportunity.
________________________________________
Wave Structure
• D1 timeframe: With current reversal signals, there are two possible scenarios:
1. Triangle abcde – as shown in previous plans.
2. Combination correction (WXY) – where wave W is a zigzag, wave X is a double zigzag, and wave Y is a triangle (as on the chart). In this case, price may decline back toward 3311.
👉 Both scenarios are valid, with no clear dominance, so continued observation is required.
• H4 timeframe: A diagonal ending triangle is forming, combined with H4 momentum turning bearish. Although we need confirmation from the current H4 close, it is clear that bullish momentum is weakening → we should look for sell opportunities in line with H4 momentum.
• H1 timeframe: According to yesterday’s plan, we expected wave 3. However, several factors suggest otherwise:
o Price corrected deeply toward 3350.
o The rebound lacked strong momentum.
o An ending diagonal triangle appeared (not typical in wave 3, as it reflects very weak buying pressure).
o RSI shows bearish divergence, further confirming weakening bullish momentum.
Altogether, these point to a likely strong and sharp decline once the pattern completes.
📌 Ideal target zone: 3387 – 3390. If the current drop is wave A or wave 1, then the rebound of wave B or wave 2 should unfold within this zone.
________________________________________
Trading Plan
• Sell Zone: 3387 – 3390
• Stop Loss: 3397
• Take Profit:
o TP1: 3371
o TP2: 3350
o TP3: 3330

Smart money sold at premium (after BSL sweep)1.Premium Array (Top Zone)
• Price rallied into the Premium Array (above equilibrium).
• This is where smart money looks to sell, because the market is at a premium.
• The spike above PDH/PWH = Buy-Side Liquidity (BSL) raid → stop hunt.
2.Liquidity Grab
• That long wick above the Premium Array shows liquidity being taken.
• Breakout traders went long; their stops funded institutional sell orders.
• After liquidity is taken, price reverses down.
3.Market Structure Shift (MSS)
• Once price rejected the premium zone, it broke lower, showing bearish intent.
• This aligns with the “sell high, buy low” ICT logic.
4.Discount Array (Lower Zone)
• The area below equilibrium (50% of the range) = Discount Array.
• Smart money looks for buys in this zone.
• Your chart shows 1H FVG + PDL + Sell-Side Liquidity (SSL) as confluence.
5.Bullish Setup Area
• The shaded “Good area for bullish” + “Powerful A+ area for bullish” means:
• Price may drop into the PDL/SSL/FVG confluence.
• Once liquidity is grabbed below → market could reverse upward again.
📘 Narrative in ICT Style
• First, price ran above BSL in the Premium Array to engineer liquidity.
• Then, distribution happened at premium, shifting structure bearish.
• Now, price is likely being delivered toward discount zones (PDL, FVG, SSL).
• These are the optimal trade entry (OTE) zones for longs if bullish narrative holds.
👉 So in short: will look to buy back at discount (PDL/SSL/FVG zones).

XAU/USD - H4 Downtrend Broken – Watch Key Liquidity Zones!MMFLOW Trading Plan | 26 Aug 2025 ⚡
💰 Gold looks ready for a strong move!
Gold has smashed through the H4 downtrend line, showing strong buying pressure and clear liquidity sweeps. This signals a potential bullish continuation. ⚠️ Be aware: wide support zones below may trigger quick pullbacks as liquidity gets collected.
📊 Market Snapshot (India Focus)
USD is losing strength amid political uncertainty and Fed moves
Trump’s efforts to influence lower interest rates are indirectly supporting gold
H4 downtrend line broken → buyers are in control
Short-term: expect sideways swings + liquidity tests
Watch for fast spikes – FOMO buy zones are usually targeted
⚡ Key Levels to Watch
Resistance: 3378 → 3384 → 3400
Support: 3363 → 3354 → 3340
🔥 Trading Scenarios
BUY SCALP (Short-Term Quick Trade)
Entry: 3355 – 3353
Stop Loss: 3349
Targets: 3360 → 3365 → 3370 → 3380 → 3390 → 3400+
BUY ZONE (Swing / Longer-Term Trade)
Entry: 3341 – 3339
Stop Loss: 3335
Targets: 3345 → 3350 → 3355 → 3360 → 3365 → 3370 → 3380 → 3390 → 3400+
SELL SCALP (Quick Reversal)
Entry: 3382 – 3384
Stop Loss: 3388
Targets: 3378 → 3374 → 3370 → 3365 → 3360 → 3350
SELL ZONE (High Risk / Big Moves)
Entry: 3400 – 3402
Stop Loss: 3406
Targets: 3395 → 3390 → 3385 → 3380 → 3370 → 3360
⚠️ Risk Notes
Expect rapid drops or spikes – stops can trigger fast
Sideways movement likely during sessions + retests of highs
Only trade when price action confirms key levels
🎯 Key Takeaways for Indian Traders
Gold is poised for a strong bullish continuation, but quick pullbacks will happen to collect liquidity
Use support / liquidity zones for entries and resistance zones for exits
MMFLOW = Market Rules | Key Levels = Profit

Elliott Wave Analysis – XAUUSD 26/08/2025
1. Momentum
• D1 timeframe: Price is currently in the overbought zone. The ongoing bullish cycle has already produced 5 daily candles. Combined with the overbought condition, this suggests that upside momentum is weakening. If no strong breakout occurs within the next 1–2 days, it is likely that the market is still in a larger corrective phase on the daily chart.
• H4 timeframe: Momentum has turned bearish, with strong selling pressure emerging right after wave 2 was considered complete. This is an unusual sign and raises caution for the bullish scenario.
• H1 timeframe: Momentum is also about to turn bearish, which implies an incoming corrective pullback. This is not an encouraging signal at a stage where wave 3 is expected to develop.
2. Wave Structure
• D1: The main scenario still follows the larger corrective triangle. Price is unfolding waves 1–2 (green), and the current bullish leg is expected to be wave 3 (green). However, the strength so far has not been convincing. Having already completed 5 D1 candles without a decisive breakout suggests weakness in the rally.
• H4: The Asian session opened with a strong rally, but this momentum quickly faded and was followed by aggressive selling. Momentum reversed sharply, highlighting abnormal behavior for the expected uptrend.
• H1: At the 3387 level, strong selling pressure appeared, whereas this should have been the breakout zone for wave 3 (black) after surpassing wave 1 (black). Ideally, price should have pushed straight toward 3403 to confirm the impulsive strength of wave 3. This unusual behavior suggests that wave 1 (black) actually completed at 3387, and the market is now in wave 2 (black).
On the lower timeframe (M15), the current decline is forming an ABC structure, with the measured target for wave C at 3364 – a potential buy zone.
If price falls back to 3350 and breaks below, the 1–2–3–4–5 (yellow) count will be invalidated. In that case, the market may be unfolding a larger corrective structure, and the wave count plan will need to be updated.
3. Trading Plan
• Buy Zone: 3365 – 3363
• Stop Loss: 3349
• Take Profit 1: 3387
• Take Profit 2: 3403
⚠️ Note: The stop-loss range is relatively wide, and momentum does not fully support the bullish wave scenario yet. Traders should consider carefully before entering directly.

XAUUSD: Bulls Eyeing a Spark from the 3357 – 3352 Launchpad!We witnessed a strong bullish surge in Gold following Friday's event-driven move. Now, XAUUSD is pulling back toward a key support zone at 3357–3352, where fresh buying interest is likely to emerge. A confirmed bounce from this area could pave the way for a bullish reversal and a push toward higher targets.
🔻 Trade Setup
Entry: Buy at 3357 | Add on dips near 3352
Targets: Refer to marked zones on the chart
Invalidation: Setup becomes invalid on a daily close below 3346
📌 Risk-Reward Outlook
This setup offers a tight downside risk with strong upside potential. Stick to disciplined risk management and adjust your position size accordingly to suit your strategy.
👍 If this idea resonates with your view, drop a like and share your thoughts in the comments — let’s learn and grow together!
Happy Trading,
– The InvestPro Team

Gold Weekly Plan: Correction or New Rally Ahead? 🇮🇳Gold surprised everyone last week with a strong rally after the Jackson Hole symposium. The weakness in USD gave bulls fresh momentum, and now traders are once again eyeing the possibility of a new ATH in the coming weeks.
But remember — after every big impulse, the market loves to test patience. A short-term correction is possible before the next strong leg up. This is where smart traders prepare, while emotional traders often get trapped.
📊 Technical Outlook (H4 Chart)
Gold is moving inside a tight triangle pattern, signaling that a breakout is close.
Friday’s bullish candle shows the market still favors buyers, but watch out: gold often dips lower before making a major breakout move.
The strategy? Stay disciplined and only enter at confirmed Key Levels.
📌 Key Levels to Watch
Resistance: 3370 – 3383 – 3400 – 3425
Support: 3350 – 3340 – 3326 – 3315
🔥 Trading Plan (MMFlow Strategy)
BUY ZONE 🟢
Entry: 3340 – 3338
SL: 3334
Targets: 3345 – 3350 – 3355 – 3360 – 3370 – 3380 – 3390 – 3400+
SELL ZONE 🔴
Entry: 3400 – 3402
SL: 3407
Targets: 3395 – 3390 – 3385 – 3380 – 3375 – 3370
✨ Question for Indian Traders: Do you think Gold will retest supports first or break 3400 directly? 🚀

Elliott Wave Analysis – XAUUSD 24/8/2025
Momentum
• D1 timeframe: Momentum is still rising → High probability that price will continue its bullish move on Monday.
• H4 timeframe: Momentum remains bullish → Price is expected to keep rising early in the week to complete wave (3) in yellow.
• H1 timeframe: Momentum is heading into the oversold zone → The short-term correction is nearing its end, we look for buy opportunities.
Wave Structure
• D1 timeframe: Friday’s strong bullish candle reinforces the scenario that wave (1) and (2) in blue are complete, and wave (3) in blue may already be forming. We need price to break above the top of wave (1) in blue to confirm the development of wave (3).
• H4 timeframe: Price rallied sharply and broke above the top of wave (1) in yellow → This confirms price is currently in wave (3) in yellow. With momentum on H4 still rising, wave (3) likely has more room to continue.
• H1 timeframe: The corrective ABC structure has completed, followed by a sharp and steep rally (as projected in Friday’s plan). Price broke above 3350 – the top of wave (1) in yellow → Confirming the scenario that price is in wave (3) in yellow.
o Minimum target for wave (3) in yellow: 3387.
o Principle: Do not counter-trade wave (3); instead, wait for wave (4) correction to look for buy entries in wave (5).
Trading Strategy
With H1 approaching the oversold zone and showing a mild correction, we have two options for entries:
1. Breakout: Wait for price to break above the small descending trendline as shown on the chart → Enter breakout buy.
2. Pullback entry: Wait for price to retrace to the 3362 area → Buy from there.
Trade Plan:
• Buy Zone: 3364 – 3361
• Stop Loss: 3354
• Take Profit:
o TP1: 3378
o TP2: 3387
o TP3: 3403

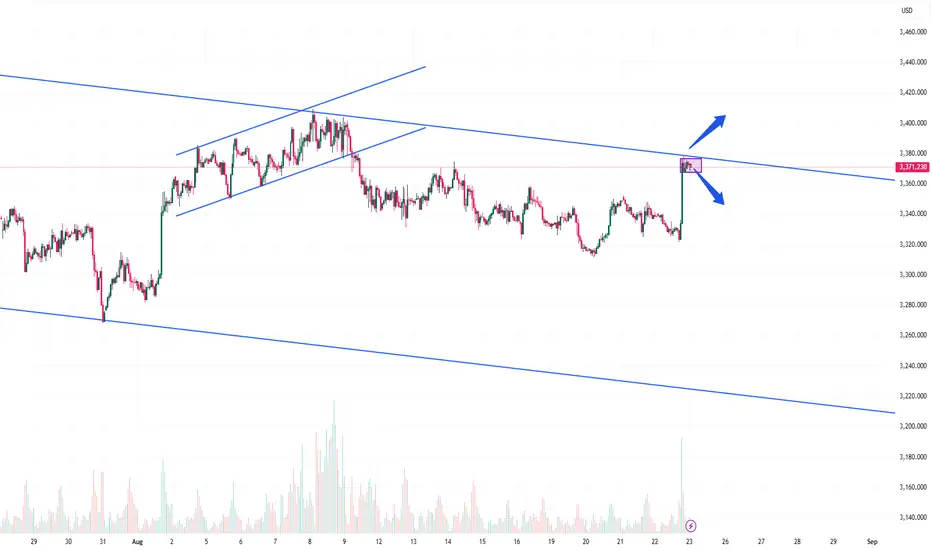
XAUUSD – At Critical Trendline | Breakout vs. RejectionDescription:
Gold has reached a major descending channel resistance where the next move could define short-term direction.
🔹 Market Context:
Price has been respecting the broader descending channel.
Recent sharp rally has brought price into the upper boundary of this structure.
Volume has picked up, showing strong participation at this zone.
🔹 Key Levels to Watch:
Upper Trendline Resistance: Potential breakout zone (monitor for candle closes above with volume).
Immediate Support Zone: Near current consolidation area – holding this level keeps bullish pressure alive.
Mid-Channel Level: Acts as a pivot; rejection could bring price back here as the first downside target.
Lower Channel Support: Remains the major bearish target if rejection extends further.
🔹 Scenarios:
Bullish: A clean breakout above the descending trendline with follow-through momentum could trigger upside continuation.
Bearish: Failure to break higher and rejection from this zone could re-align price back into the channel, targeting mid- and lower boundaries.
👉 This is a high-probability decision point. Confirmation will be key before aligning with either direction.
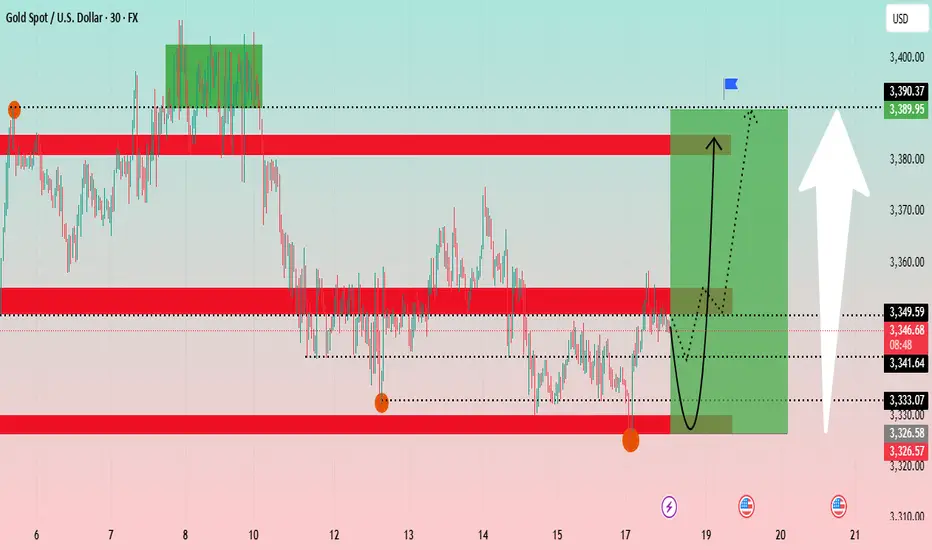
Gold Technical Analysis: Navigating Key Support ?The Gold chart shows a 30-minute timeframe analysis, highlighting recent price consolidation and potential future trends. The analysis suggests a potential V-shape recovery for gold.
Key Levels: The price is currently at a critical juncture, having tested a support zone around 3,326 - 3,333 USD. This zone has proven to be a strong base. Above it, a significant resistance zone is identified between 3,349 - 3,353 USD. Further up, another major resistance is at approximately 3,389 USD.
Price Action: The price has recently experienced a sharp decline and is now in a consolidation phase. The chart projects a potential bounce from the current levels, indicated by the black curved arrow, with the target being the upper resistance zone around 3,389 USD. The green shaded box illustrates the potential upward movement from the current position.
Conclusion: Gold appears to be at a key support level and could be poised for a rally if it successfully breaks above the immediate resistance zone.
Bitcoin (BTC/USDT) 4-Hour Chart Analysis
The Bitcoin chart shows a 4-hour timeframe analysis, focusing on a short-term uptrend channel.
Key Levels: The price is trading within an ascending channel. A significant support zone is identified between 112,000 - 114,000 USDT. A "weak supply zone" is marked around 118,000 USDT, which is currently acting as support. A major resistance is at approximately 124,564 USDT.
Price Action: After a strong push towards the channel's upper boundary, the price has pulled back and is now retesting the "weak supply zone." The blue and red arrows project two possible scenarios: a bounce back up towards the channel's high, or a deeper retracement towards the channel's lower trendline. The price movement appears to be following the blue projected path.
Indicators: The Ichimoku cloud and RSI strategy are used to confirm the trend and identify entry/exit points. The price is above the Ichimoku cloud, indicating a bullish trend.
Conclusion: Bitcoin is at a pivotal point within its uptrend channel. Its ability to hold the 118,000 USDT level will be crucial for a potential re-test of the 124,564 USDT resistance.
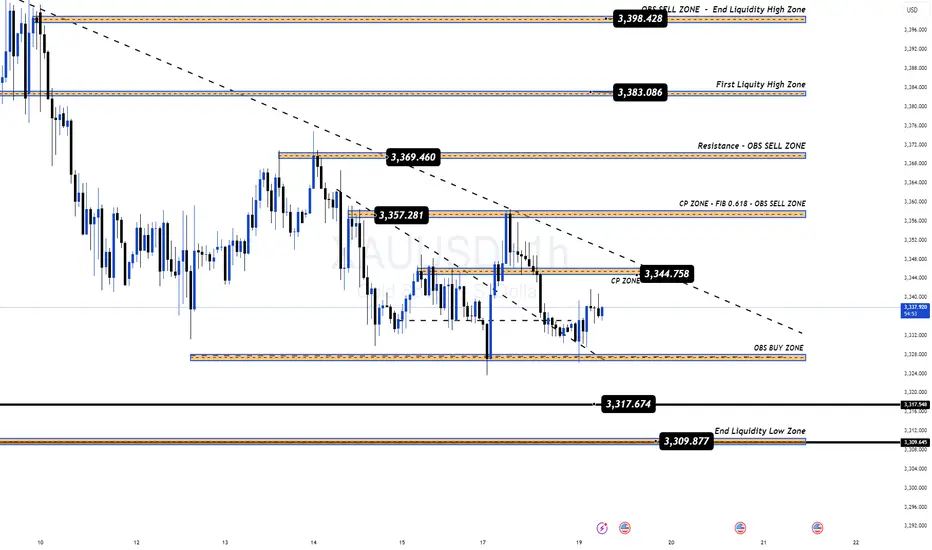
XAU/USD Price Action Zones & Trade Setup (Aug 20, 2025)Analysis:
The market recently made a CHoCH (Change of Character), signaling a possible bearish structure.
First Selling Zone (3340 – 3350): Strong resistance area where sellers may push price down.
Second Selling Zone (3350 – 3360): A deeper liquidity grab area for confirmation shorts.
First Buying Area (3308 – 3320): Demand zone where buyers might step in for a short-term bounce.
Second Buying Area (3270 – 3280): Stronger demand, ideal for swing buy opportunities if price dips further.
Price is currently around 3323, hovering near equilibrium, likely to retest selling zones before dropping to buying areas.
📈 Trade Plan:
Sell Entries
🔹 First Short: Around 3340 – 3350 (First Selling Zone).
🔹 Second Short (confirmation): Around 3350 – 3360 (Second Selling Zone).
🎯 Targets:
TP1: 3320 (First Buying Area)
TP2: 3280 (Second Buying Area)
🛑 Stop Loss: Above 3365
Buy Entries
🔹 First Buy: Around 3310 – 3320 (First Buying Area) for a small bounce.
🔹 Second Buy (stronger): Around 3270 – 3280 (Second Buying Area).
🎯 Targets:
TP1: 3340 (back to resistance)
TP2: 3355 (liquidity above first selling zone)
🛑 Stop Loss: Below 3260

XAUUSD – Gold getting ready for a big breakout!Gold is moving exactly as expected: consolidation – breakout – consolidation again. Right now, price is forming a tight triangle pattern, showing strong pressure for the next move.
👉 With both technical setup and global macro headlines creating indecision, the market is waiting for a clear breakout. Once it happens, we can expect a strong trend in either direction.
🔑 Key Levels
Resistance: 3337 – 3343 – 3350 – 3356 – 3365
Support: 3325 – 3320 – 3314
📌 Buy Plan
Buy Zone: 3316 – 3314
SL: 3309
TP: 3320 – 3325 – 3330 – 3335 – 3340 – 3345 – 3350 – 3360 – 3370
📌 Sell Plan
Scalp Sell: 3348 – 3350
SL: 3355
TP: 3344 – 3340 – 3335 – 3330
Sell Zone: 3365 – 3367
SL: 3372
TP: 3360 – 3355 – 3350 – 3345 – 3340
🎯 MMFLOW Note
The tighter the range, the stronger the breakout.
Always prepare for both bullish & bearish scenarios.
Wait for confirmation at the Key Levels before taking positions.

Elliott Wave Analysis – BTCUSD 22/8/2025
Momentum
• D1 timeframe: Momentum is currently in the oversold zone, with the downside range narrowing → suggesting the decline is slowing. This supports the potential for a short-term bullish rebound.
• H4 timeframe: Momentum is turning upward, but the current strength is not yet enough to confirm a sustainable uptrend. Key signal: if H4 momentum enters the overbought zone and price breaks above the previous high, it will confirm a more solid bullish trend.
• H1 timeframe: Momentum is turning down. Ideally, the pullback should not break below the 112k level. If this support holds, it would be the first signal of a possible bullish reversal.
Wave Structure
• D1 timeframe: Price has broken below the wave 4 low and is now reacting around this zone → confirming the risk of a longer-term corrective decline. However, D1 momentum still supports a short-term rebound in the form of wave B. This means we should avoid long-term Buy positions for now, and only treat upcoming upside moves as corrective rallies.
• H4 timeframe: Price remains within a 5-wave structure (1–2–3–4–5, red). This could either be wave A of an ABC correction or wave 1 of a larger corrective structure. Further observation is needed.
• H1 timeframe: A 5-wave structure (black) seems to be forming, with wave 5 potentially unfolding as an ending diagonal (triangle). Once this triangle completes, a sharp upward move is expected. Confirmation will come if price breaks above the 2–4 trendline. For now, watch for a break above 113.5k to trigger entry.
Trading Plan
• Stay patient and wait for a breakout above the 2–4 trendline on H1.
• If confirmed, consider entering Buy positions to ride the corrective rebound.

XAUUSD Bullish Breakout! Ready to Ride Gold’s Pre-FOMC Pump? XAUUSD Bullish Breakout! Ready to Ride Gold’s Pre-FOMC Pump? 🇮🇳
Subheader:
Gold surged past short-term resistances overnight – here’s a clear plan for Indian traders to scalp, swing, and ride the bullish momentum safely.
📊 Market Outlook – MMFLOW India Edition
Primary Bias: Bullish – Buy the dips
Key Observations:
Gold broke through the descending trendline and short-term resistance in a single session.
Early pre-FOMC breakout confirms strong bullish momentum.
Market cleared liquidity below and reclaimed higher zones – bullish case remains strong.
Scenarios:
🔹 Buy near strong support zones (dip-buying opportunities)
🔹 Tactical sells only at confirmed resistance with clear rejection
Technical Insight (Daily Chart):
Strong bullish confirmation candle – pullbacks are ideal reload points for long positions.
🔥 Trading Plan – Buy/Sell Zones & Scalp Strategy
✅ BUY SCALP
Entry: 3333 – 3331
Stop Loss: 3327
Take Profit: 3338 – 3343 – 3348 – 3352 – 3356 – 3360
✅ BUY ZONE (Swing / Positional Trades)
Entry: 3316 – 3314
Stop Loss: 3310
Take Profit: 3320 – 3325 – 3330 – 3335 – 3340 – 3350 – 3360
🔻 SELL ZONE (Tactical)
Entry: 3368 – 3370
Stop Loss: 3375
Take Profit: 3364 – 3360 – 3355 – 3350 – 3345 – 3340 – 3330
📌 Key Levels to Watch
Support Levels: 3332 – 3323 – 3315
Resistance Levels: 3348 – 3362 – 3370 – 3383
🚨 Risk Note for Indian Traders
If price dips deep into 331x, watch out for liquidity traps.
Always stick to TP/SL rules – volatility is high around FOMC events.
✨ MMFLOW Reminder
Key Levels = Profits
Buy the dips, ride the bullish momentum
💡 Pro Tips for TradingView India Users
Bookmark support & resistance zones
Observe liquidity sweeps before major news
Use scalp or swing strategies depending on your timeframe

Elliott Wave Analysis – XAUUSD (21/8/2025)
1. Momentum
• D1 timeframe: Yesterday’s daily candle closed bullish, confirming upward momentum. This suggests that the dominant trend could remain bullish for the next 4–5 days.
• H4 timeframe: Currently in a corrective move with only 2 bearish candles formed so far. This decline may need another 2–3 candles to complete. A potential bullish reversal could occur during the US session tonight.
• H1 timeframe: Momentum is turning bullish, signaling a short-term upward move. However, since H4 is still in a corrective phase, it is better to observe for now rather than take immediate action.
2. Wave Structure
• D1 timeframe:
With the bullish confirmation on D1, the corrective a–b–c–d–e triangle scenario remains valid. At present, the market is forming wave 1 and wave 2 in blue. This view will be further confirmed once price breaks above the top of wave 1 (blue).
• H4 timeframe:
Previously, I anticipated a possible ending diagonal for wave C in purple. However, with yesterday’s strong rally and the bullish confirmation on D1, the updated structure is more consistent with:
o Wave B (purple) forming a triangle.
o Wave C (purple) already completed.
This suggests the market has entered wave 1 (yellow) and we are now waiting for wave 2 (yellow) to complete in order to look for buy opportunities.
If price drops below 3314, the extended scenario remains valid with a target around 3298. But since D1 momentum supports the bullish case, I will prioritize the bullish scenario for trading.
• H1 timeframe:
H1 momentum indicates a possible pullback. Typically, wave 2 forms as a zigzag or flat correction, retracing to the Fibonacci levels of 0.5 – 0.618 – 0.782.
I believe wave 1 (yellow) may already be complete. However, if H1 momentum continues to push higher, price could reach around 3362 before finalizing wave 1. In that case, traders can use Fibonacci retracement levels to identify entry points for a buy on wave 2.
Potential retracement zones for wave 2: 3333 – 3327 – 3315.
3. Trading Plan
• Buy Zone: 3333 – 3330
• Stop Loss: 3323
• Take Profit 1: 3350
• Take Profit 2: 3381
• Take Profit 3: 3409

Gold (XAU/USD) Short-Term Bearish Setup1. Well-Defined Resistance Zones
Two horizontal shaded areas labeled Resistance R1 and Resistance R2 mark zones near $3,360–$3,380, where price repeatedly failed to break higher.
Trading ideas from analysts on TradingView reinforce that the immediate resistance lies around $3,364–$3,370. As long as price stays below that, sellers remain in control
TradingView
+1
.
2. Descending Channel & Bearish Momentum
The chart highlights a shift from an earlier ascending channel (green), followed by breakdown and decline — a classic reversal from bullish to bearish.
In line with this, there’s also mention of a bearish flag pattern forming on the 30-minute (M30) timeframe, offering a potential shorting opportunity
TradingView
+1
.
3. Key Support Levels & Targets
Multiple support levels annotated: Support S2 (at two levels) and Support S3, with notable levels around $3,315, $3,301–$3,302, and $3,300.
The annotated price action indicates projected declines toward those levels—especially highlighting $3,314.94, $3,301.55, and $3,300.96 as intermediate and key targets.
Ultimately, the red “High support area” below suggests a broader demand zone, perhaps around $3,280–$3,300, where stronger support may emerge.
4. Trading Plan Illustrated
White arrows depict a descending trajectory: from current levels down to each support, suggesting a sell-on-rally approach.
Blue markers denote possible bounce points for pullbacks before continuation lower.
Broader Market Context
Gold prices have recently been tracking in the $3,330–$3,350 range, facing resistance near $3,350–$3,360 and support near $3,300. Analysts caution that a break below that could push it toward $3,245 or $3,150–$3,120
TradingView
+1
.
Overall momentum has turned cautious or bearish—bearish engulfing patterns, weakening rally strength, and below-average technical indicators emphasize the risk of further declines
FXEmpire
+2
FXEmpire
+2
.
Weak U.S. economic indicators or dovish signals from Fed officials (like Powell) could offer brief relief rallies; but failure to reclaim resistance may extend the slide
FXEmpire
+1
.
Key Levels at a Glance
Level Type Price Range Notes
Resistance ~$3,350–$3,360+ Strong ceiling—decline confirms bearish bias
Support S1 ~$3,315–$3,320 First potential reaction zone
Support S2 ~$3,301 Intermediate target for sellers
Support S3 ~$3,300 Psychological barrier; near high support zone
High Support Area ~$3,280–$3,300 Zone where bullish buyers might regroup
Conclusion
Your chart effectively captures a short-term bearish trend in gold (XAU/USD), showing:
Failed attempts to overcome resistance near $3,360.
A bearish flag breakout signaling potential continuation downward.
Clearly plotted support targets, with bounce zones drawn out.
A visual trade plan suggesting sell-on-rallies targeting declining support levels until reaching a strong demand zone.
To succeed with this setup, traders might wait for a brief rally into one of the identified sell zones (e.g. ~$3,314 or $3,325) before entering shorts, with stop-loss placements above the resistance areas and profit objectives aligned with support levels ($3,301 or near $3,300).

Gold Price Awaits FOMC – Liquidity Levels in PlayGold price continued to slide into liquidity zones during the late US session yesterday and reacted perfectly at the MMFLOW BUY ZONE 3314 – 3316, delivering over +70 pips profit to traders ✅.
At present, on M5–M15, Gold is showing signs of a short-term recovery. However, for a strong upside move, buyers must break through the 3320 – 3322 resistance zone. A confirmed breakout here could trigger momentum towards higher KeyLevels, allowing price to retest important supply zones.
📈 Upside Targets (Intraday): 333x and 334x remain the key areas to watch for take-profits or potential reversal setups.
🔔 Why This Week Matters – The FOMC Decision
The highlight of the week is the FOMC meeting during the US session. Markets are awaiting clarity on the Fed’s next move. Any hint towards a September rate cut could trigger massive bullish momentum, breaking Gold out of its corrective channel.
👉 Asian & European sessions: Focus remains bullish toward 333x – 334x, with potential SELL setups at resistance.
⚠️ US session with FOMC: Expect extreme volatility – risk management is critical.
📉 MMFLOW Technical Trading Plan
🔹 BUY Scalp Setup
Entry: 3311 – 3309
SL: 3305
TP: 3315 → 3320 → 3325 → 3330 → 3340 → 3350 → 3360+
🔹 BUY Zone (FOMC Plan)
Entry: 3290 – 3288
SL: 3282
TP: 3295 → 3330 → 3335 → 3340 → 3350 → 3360 → 3370+
🔸 SELL Scalp Setup
Entry: 3342 – 3344
SL: 3348
TP: 3338 → 3332 → 3328 → 3324 → 3320
🔸 SELL Zone (FOMC Plan)
Entry: 3360 – 3362
SL: 3368
TP: 3355 → 3350 → 3345 → 3340 → 3330
⚠️ Key Notes for Indian Traders
FOMC = high volatility event – manage your exposure carefully.
Stick to strict TP/SL discipline to protect capital.
Smart traders know: KeyLevels = Profits ✅
🔥 Follow MMFLOW TRADING for daily Gold price analysis, liquidity maps, and Smart Money insights – designed for Forex & Gold traders in India.

Elliott Wave Analysis – XAUUSD 20/8/2025
1. Momentum
• D1 timeframe: Momentum lines are still “sticking” together, signaling that the bearish pressure is weakening. However, without a strong bullish D1 candle to confirm reversal, there is still a risk of sudden downward spikes. Patience is required until a clear bullish confirmation appears.
• H4 timeframe: Momentum is currently turning bullish, suggesting a potential upward move today. But caution is needed: if the bullish candles are short, overlapping each other, and when momentum reaches the overbought zone without breaking the previous high → this move is likely just a corrective rebound.
• H1 timeframe: Momentum is in the overbought area, indicating the possibility of a minor pullback or sideways movement in the short term.
2. Wave Structure
• D1 timeframe: The corrective triangle structure remains valid (only invalidated if price breaks below 3270). The main scenario continues to favor wave 1 and 2 in blue, with price currently in wave 2.
• H4 timeframe: The decline in wave C shows overlapping sub-waves, each formed by 3-wave structures, hinting at the possibility of an ending diagonal for wave C. The pattern is not yet complete, so we need further observation for confirmation.
• H1 timeframe: Within the 5-wave structure of an ending diagonal, wave 3 is typically the strongest and a divergence usually occurs between wave 3 and wave 5 on RSI. Yesterday’s decline pushed RSI into the oversold zone, but no divergence has formed yet. Combined with H4 momentum turning bullish, this suggests the current move is likely wave 3 (yellow). A corrective wave 4 upward is expected, followed by a final decline to complete wave 5 with RSI divergence. Once wave 5 ends, the entire wave C diagonal will be complete, paving the way for a strong bullish rally — a typical characteristic of ending diagonals.
3. Trading Plan
The strategy is based on the ending diagonal pattern:
• Conservative approach: Wait for a breakout above the upper boundary of the diagonal before entering.
• Aggressive approach: Wait for wave 5 to complete and enter at the projected bottom of wave 5.
Trade setup:
• Buy Zone: 3301 – 3299
• Stop Loss (SL): 3219
• Take Profit (TP1): 3314
• Take Profit (TP2): 3362
• Take Profit (TP3): 3381

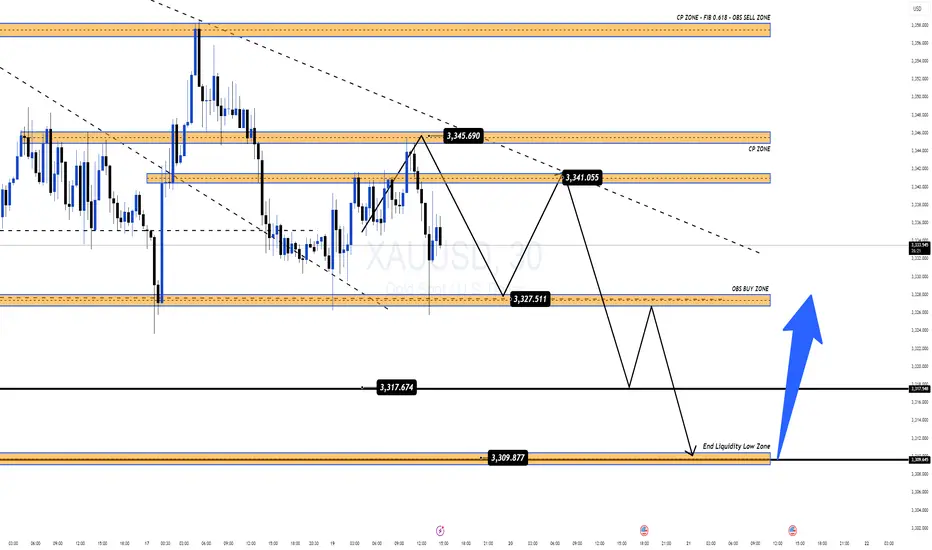
Gold Consolidates Ahead of FOMC Liquidity SweepGold is currently moving within a narrow range, with downside pressure becoming increasingly evident. With just over a day left before the FOMC meeting – an event that could shape the next major trend – the market seems to be preparing for a sharp liquidity sweep.
👉 At first glance, price action looks frustrating and unclear. But for traders following MMFLOW KeyLevels, this is actually the “golden range”, as key zones continue to hold with remarkable precision.
📉 Today’s Outlook
Main Trend: Ongoing corrective downside move.
Potential Scenario: A deep liquidity sweep towards the 331x zone before a strong bullish rebound.
🔑 Key Trading Levels
SELL Zone: 3340 – 3345 | Short SL: 4 – 5$
🎯 Targets: 3325 → 3317 → extended 3310
📌 Note: Manage risk tightly and watch reactions around KeyLevels – a single BreakOut move post-FOMC could unlock the next major opportunity.
✨ Once again: KeyLevels = Profits ✅
👉 Follow MMFLOW TRADING for daily KeyLevel strategies, liquidity maps & smart money insights
🇮🇳 Gold Under Pressure | Key Levels to Watch TodayGold continues to move in line with our weekly outlook. Despite strong rebounds from liquidity zones, the market still faces heavy selling pressure, unable to break out of the 335x – 336x resistance area.
With no major news events scheduled today, price action is expected to remain within range, making KeyLevels the most important zones to trade from.
📌 Trading Bias Today
Priority remains on SELL setups at upper resistance zones. Adjust entries slightly for better risk–reward.
For BUY positions, wait for deeper entries to avoid liquidity sweeps around 333x – 332x, which have been tested multiple times recently.
🔑 Key Market Levels
Resistance: 3346 – 3357 – 3370 – 3383
Support: 3324 – 3316 – 3309
📌 Trading Plan for India Traders
✅ BUY Zone: 3316 – 3314
SL: 3310
TP: 3320 – 3324 – 3328 – 3332 – 3336 – 3340 – 3350 – 3360+
✅ SELL Zone: 3356 – 3358
SL: 3362
TP: 3352 – 3348 – 3344 – 3340 – 3330 – 3320
⚠️ Summary
Gold remains inside a bearish channel, waiting for a clear breakout. Until major news like the FOMC hits, expect sideways price action within today’s KeyLevels.
👉 Watch reactions closely around 333x – 336x for the next potential move.
Stay disciplined, trade the levels, and let the market show its hand.